

2014 Week 5 Football Playoff Listing
September 23, 2014
By Geoff Kimmerly
Second Half editor
Here is a list of Michigan High School Athletic Association football playing schools, displaying their win-loss records and playoff averages through the fourth week of the season.
Schools on this list are in enrollment order for 11-player teams, with 8-player teams ordered by playoff average. An asterisk (*) beside a record indicates a team has eight or fewer games scheduled. A caret (^) beside a school’s name indicates a team is one win away from playoff qualification.
Those schools with 11-player teams with six or more wins playing nine-game schedules, or five or more wins playing eight games or fewer, will qualify for the MHSAA Football Playoffs beginning Oct. 31. Schools with 5-4, 4-3 or 4-4 records may qualify if the number of potential qualifiers by win total does not reach the 256 mark. Schools with six or more wins playing nine-game schedules or five or more wins playing eight games or fewer may be subtracted from the field based on playoff average if the number of potential qualifiers exceeds the 256 mark.
Once the 256 qualifying schools are determined, they will be divided by enrollment groups into eight equal divisions of 32 schools, and then drawn into regions of eight teams each and districts of four teams each.
Those schools with 8-player teams will be ranked by playoff average at season’s end, and the top 16 programs will be drawn into regions of eight teams each for the playoff in that division, which also begins Oct. 31.
To review a list of all football playoff schools, individual school playoff point details and to report errors, visit the Football page of the MHSAA Website.
The announcement of the qualifiers and first-round pairings for both the 11 and 8-player playoffs will take place on Oct. 26 on the Selection Sunday Show on FOX Sports Detroit. The playoff qualifiers and pairings will be posted to the MHSAA Website following the Selection Sunday Show.
11-Player Playoff Listing
1. Macomb Dakota, 2814, 3-1, 72.750
2. Sterling Heights Stevenson, 2767, 3-1, 66.250
3. Clarkston, 2742, 4-0, 98.000
4. Grand Blanc, 2668, 3-1, 66.500
5. East Kentwood, 2592, 4-0, 90.000
6. Rockford, 2555, 4-0, 98.000
7. Dearborn Fordson, 2411, 4-0, 88.000
8. Northville, 2298, 3-1, 64.750
9. Holland West Ottawa, 2293, 3-1, 74.500
10. Canton, 2289, 3-1, 66.500
11. Detroit Cass Tech, 2277, 4-0, 86.000
12. Plymouth, 2116, 3-1, 62.750
13. Lapeer, 2112, 4-0, 82.000
14. Hartland, 2007, 3-1, 72.000
15. Monroe, 1992, 3-1, 66.750
16. Grand Haven, 1960, 3-1, 70.500
17. West Bloomfield, 1929, 3-1, 66.750
18. Westland John Glenn, 1872, 3-1, 62.750
19. Warren Mott, 1870, 3-1, 70.500
20. Oxford, 1864, 4-0, 94.000
21. Livonia Stevenson, 1848, 3-1, 58.250
22. Saline, 1844, 3-1, 68.500
23. Walled Lake Central, 1815, 3-1, 68.500
24. Hudsonville, 1759, 3-1, 64.750
25. Waterford Mott, 1738, 3-1, 66.750
26. Livonia Churchill, 1696, 4-0, 98.000
27. Flint Carman-Ainsworth, 1568, 3-1, 64.500
28. Warren DeLaSalle, 1562, 3-1, 52.750
29. Detroit Western International, 1521, 3-1, 54.500
30. Detroit Martin Luther King, 1507, 4-0, 88.000
31. Walled Lake Western, 1502, 4-0, 88.000
32. Traverse City Central, 1490, 3-1, 66.250
33. Oak Park, 1486, 3-1, 66.750
34. Brownstown Woodhaven, 1484, 4-0, 92.000
35. Southgate Anderson, 1374, 3-1, 60.750
36. Dearborn Edsel Ford, 1356, 3-1, 66.250
37. Wyandotte Roosevelt, 1351, 3-1, 72.500
38. Detroit East English, 1345, 3-1, 66.750
39. Portage Northern, 1345, 3-1, 71.833
40. Port Huron, 1336, 3-1, 72.750
41. Ypsilanti Community, 1300, 3-1, 66.250
42. Birmingham Brother Rice, 1298, 4-0, 96.000
43. Garden City, 1290, 3-1, 50.750
44. Muskegon Mona Shores, 1274, 3-1, 74.750
45. Birmingham Groves, 1270, 4-0, 84.000
46. Berkley, 1265, 4-0, 80.000
47. Flushing, 1260, 3-1, 70.250
48. Midland Dow, 1255, 4-0, 90.000
49. South Lyon, 1254, 4-0, 94.000
50. Southfield, 1239, 3-1, 68.750
51. Farmington Hills Harrison, 1212, 3-1, 68.500
52. Fenton, 1181, 4-0, 92.000
53. Farmington, 1178, 3-1, 66.500
54. Grand Rapids Northview, 1177, 3-1, 62.500
55. Warren Woods Tower, 1175, 4-0, 86.000
56. Muskegon, 1157, 4-0, 98.000
57. Lowell, 1145, 4-0, 78.000
58. Greenville, 1130, 3-1, 52.250
59. Gibraltar Carlson, 1129, 3-1, 62.500
60. Grand Rapids Forest Hills Northern, 1113, 4-0, 86.000
61. Holland, 1109, 3-1, 60.250
62. Marquette, 1090, 3-1, 58.100
63. St. Johns, 1088, 4-0, 88.000
64. Byron Center, 1085, 3-1, 62.750
65. Allen Park, 1069, 3-1, 68.750
66. Auburn Hills Avondale, 1056, 3-1, 58.500
67. Orchard Lake St. Mary's, 1054, 4-0, 88.000
68. Mt. Pleasant, 1050, 3-1, 70.750
69. St. Joseph, 1028, 3-1, 70.750
70. Petoskey, 965, 3-1, 60.750
71. Romulus, 950, 3-1, 50.500
72. Riverview, 935, 4-0, 84.000
73. DeWitt, 930, 4-0, 92.000
74. Gaylord, 927, 4-0, 74.000
75. Linden, 921, 3-1, 60.750
76. Detroit Mumford, 919, 3-1, 56.250
77. Cedar Springs, 910, 3-1, 52.250
78. Grand Rapids Christian, 895, 3-1, 62.750
79. Stevensville Lakeshore, 887, 4-0, 97.333
80. Niles, 885, 3-1, 60.500
81. Carleton Airport, 879, 3-1, 52.750
82. Coldwater, 876, 4-0, 72.000
83. New Boston Huron, 867, 3-1, 58.750
84. Warren Fitzgerald, 857, 3-1, 60.750
85. Zeeland West, 850, 4-0, 74.000
86. Dearborn Divine Child, 848, 3-1, 57.583
87. St. Clair, 844, 3-1, 60.750
88. Edwardsburg, 839, 3-1, 58.750
89. Chelsea, 838, 3-1, 70.500
90. Plainwell, 812, 3-1, 56.500
91. Detroit Denby, 800, 3-1, 68.500
92. Vicksburg, 794, 4-0, 80.000
93. Bloomfield Hills Cranbrook-Kingswood, 790, 3-1, 50.500
94. Cadillac, 747, 4-0, 88.000
95. Goodrich, 737, 3-1, 64.750
96. Dearborn Heights Robichaud, 717, 4-0, 64.667
97. Yale, 716, 3-1, 50.750
98. Muskegon Orchard View, 662, 3-1, 52.250
99. Williamston, 659, 4-0, 80.000
100. Paw Paw, 657, 3-1, 56.750
101. Lansing Sexton, 652, 4-0, 98.000
102. Whitehall, 644, 4-0, 72.000
103. Kalamazoo Hackett, 635, 4-0, 64.000
104. Richmond, 630, 4-0, 80.000
105. Wyoming Kelloggsville, 610, 3-1, 50.750
106. Wyoming Godwin Heights, 609, 4-0, 58.000
107. Saginaw Swan Valley, 602, 4-0, 64.000
108. Birch Run, 575, 4-0, 72.000
109. Remus Chippewa Hills, 567, 4-0, 80.000
110. Marine City, 553, 4-0, 74.000
111. Flint Powers Catholic, 553, 3-1, 66.500
112. Freeland, 549, 4-0, 80.000
113. Ann Arbor Gabriel Richard, 545, 3-1, 46.750
114. Stanton Central Montcalm, 539, 3-1, 54.250
115. Portland, 538, 3-1, 62.750
116. Menominee, 532, 4-0, 81.467
117. Detroit University Prep, 530, 3-1, 52.750
118. River Rouge, 530, 3-1, 62.000
119. Frankenmuth, 528, 3-1, 54.750
120. Gladwin, 528, 3-1, 48.750
121. Ida, 527, 4-0, 66.000
122. Hopkins, 522, 3-1, 52.250
123. Lansing Catholic, 515, 4-0, 78.000
124. Almont, 512, 4-0, 64.000
125. Newaygo, 506, 3-1, 52.750
126. Olivet, 505, 3-1, 48.000
127. Muskegon Oakridge, 501, 3-1, 46.750
128. Onsted, 499, 3-1, 40.750
129. Chesaning, 480, 3-1, 52.750
130. Manistee, 479, 3-1, 50.500
131. Gladstone, 473, 3-1, 40.750
132. Stockbridge, 462, 3-1, 52.500
133. Reed City, 461, 3-1, 46.500
134. Harrison, 444, 4-0, 62.000
135. Kingsley, 439, 3-1, 48.750
136. Grand Rapids West Catholic, 438, 4-0, 82.000
137. Lakeview, 426, 3-1, 42.000
138. Beaverton, 422, 3-1, 42.250
139. Jonesville, 419, 3-1, 46.500
140. Jackson Lumen Christi, 417, 4-0, 72.000
141. Monroe St. Mary Catholic Central, 417, 4-0, 78.000
142. Millington, 414, 4-0, 74.000
143. Warren Michigan Collegiate, 414, 4-0, 66.000
144. Ithaca, 405, 4-0, 66.000
145. Sanford Meridian Early College, 404, 3-1, 44.250
146. Hillsdale, 401, 3-1, 50.750
147. Hanover-Horton, 399, 4-0, 48.000
148. Boyne City, 395, 4-0, 64.000
149. Grass Lake, 395, 4-0, 48.378
150. Madison Heights Madison, 393, 4-0, 86.000
151. Montrose, 392, 4-0, 66.000
152. Tawas, 385, 3-1, 52.500
153. Niles Brandywine, 383, 3-1, 47.833
154. Manchester, 379, 3-1, 46.750
155. Watervliet, 378, 3-1, 40.500
156. Quincy, 375, 3-1, 32.500
157. Vassar, 375, 3-1, 44.750
158. St. Charles, 373, 3-1, 54.500
159. Constantine, 371, 4-0, 70.000
160. Clinton, 367, 4-0, 62.000
161. Vandercook Lake, 366, 3-1, 36.500
162. Laingsburg, 361, 3-1, 42.750
163. Flint Beecher, 350, 4-0, 72.000
164. Grand Rapids NorthPointe Christian, 347, 3-1, 46.500
165. Ravenna, 342, 4-0, 58.000
166. Carson City-Crystal, 330, 3-1, 42.500
167. Ishpeming Westwood, 318, 3-1, 38.750
168. Marlette, 316, 3-1, 44.250
169. Homer, 312, 4-0, 50.000
170. Elkton-Pigeon-Bay Port Laker, 308, 4-0, 60.000
171. Ishpeming *^, 307, 4-0, 64.000
172. Traverse City St. Francis, 305, 3-1, 48.750
173. Burton Atherton, 304, 3-1, 44.750
174. Pewamo-Westphalia, 302, 3-1, 42.750
175. Dansville, 301, 3-1, 48.500
176. Gobles, 301, 3-1, 48.750
177. Flint Hamady, 295, 4-0, 50.000
178. Union City, 294, 4-0, 48.000
179. Rochester Hills Lutheran Northwest, 289, 3-1, 42.500
180. Whittemore-Prescott, 283, 4-0, 64.000
181. Mancelona, 282, 3-1, 30.750
182. Detroit Loyola, 278, 4-0, 80.000
183. Manton, 276, 3-1, 38.250
184. Royal Oak Shrine Catholic, 273, 4-0, 58.000
185. Hudson, 271, 3-1, 40.750
186. Grosse Pointe Woods University Liggett, 270, 3-1, 46.750
187. Decatur, 262, 4-0, 66.000
188. Lincoln Alcona, 260, 3-1, 38.500
189. Iron River West Iron County, 259, 4-0, 60.000
190. New Lothrop, 259, 4-0, 66.000
191. Blanchard Montabella, 256, 3-1, 40.000
192. Norway, 244, 3-1, 37.933
193. Saginaw Michigan Lutheran Seminary, 243, 3-1, 46.750
194. Suttons Bay, 243, 3-1, 43.667
195. Indian River Inland Lakes, 242, 3-1, 30.750
196. Ottawa Lake Whiteford, 238, 3-1, 42.750
197. Johannesburg-Lewiston, 237, 4-0, 52.000
198. Harbor Beach, 232, 4-0, 64.000
199. Bessemer *, 231, 3-1, 34.500
200. Beal City, 222, 4-0, 60.000
201. Lutheran Westland, 221, 3-1, 42.500
202. Coleman, 217, 3-1, 44.250
203. Mendon, 214, 3-1, 50.500
204. St. Ignace, 211, 4-0, 48.000
205. Pittsford, 205, 3-1, 30.750
206. Bark River-Harris, 194, 3-1, 30.333
207. Munising, 194, 3-1, 35.417
208. Fowler, 189, 4-0, 58.000
209. Morenci, 184, 4-0, 62.000
210. Muskegon Catholic Central, 183, 4-0, 72.000
211. Climax-Scotts, 169, 4-0, 44.000
212. Waterford Our Lady, 169, 3-1, 56.750
213. Lake Linden-Hubbell, 163, 3-1, 42.600
214. Hillman, 139, 4-0, 50.000
215. Baldwin, 137, 3-1, 36.500
216. Bay City All Saints, 133, 3-1, 40.500
217. Felch North Dickinson *, 113, 3-1, 30.500
218. Clarkston Everest Collegiate *, 105, 3-0, 59.333
8-Player Playoff Listing
1. Deckerville, 183, 4-0, 42.000
2. Cedarville, 158, 4-0, 42.000
3. Peck, 158, 4-0, 42.000
4. Portland St. Patrick, 96, 4-0, 42.000
5. Rapid River, 108, 4-0, 40.667
6. Battle Creek St. Philip, 157, 4-0, 40.000
7. Owendale-Gagetown, 49, 4-0, 40.000
8. Bellaire, 151, 4-0, 38.667
9. Lawrence, 191, 4-0, 32.000
10. Waldron, 89, 3-1, 28.750
11. New Haven Merritt Academy, 145, 3-1, 26.750
12. Webberville, 189, 3-1, 24.500
13. Posen, 90, 2-2, 21.500
14. Eben Junction Superior Central, 126, 2-2, 19.000
15. Kingston, 191, 2-2, 17.500
16. Engadine, 85, 2-2, 17.500
17. Burr Oak, 69, 2-2, 17.250
18. Morrice, 196, 2-2, 16.750
19. Ontonagon *, 138, 1-2, 12.167
20. Kinde-North Huron, 172, 1-3, 12.000
21. Caseville, 81, 1-3, 11.250
22. Brimley, 144, 1-3, 9.750
23. Akron-Fairgrove, 99, 1-3, 9.250
24. Big Rapids Crossroads Academy, 188, 0-4, 3.000
25. St. Joseph Michigan Lutheran *, 101, 0-4, 2.500
26. Tekonsha, 146, 0-4, 2.250
27. Carsonville-Port Sanilac, 147, 0-4, 2.000
28. Ewen-Trout Creek, 135, 0-4, 2.000
29. Litchfield, 106, 0-4, 2.000
30. Flint Michigan School For The Deaf, 56, 0-4, 2.000
31. Charlton Heston Academy, 54, 0-4, 0.750
Early Wins Leader Maskill Built Champions
November 12, 2019
By Ron Pesch
Special for Second Half
The long shadows of “midcentury modern” coaching legends have mostly disappeared from the gridirons of Michigan.
One more vanished in late October at the age of 96.
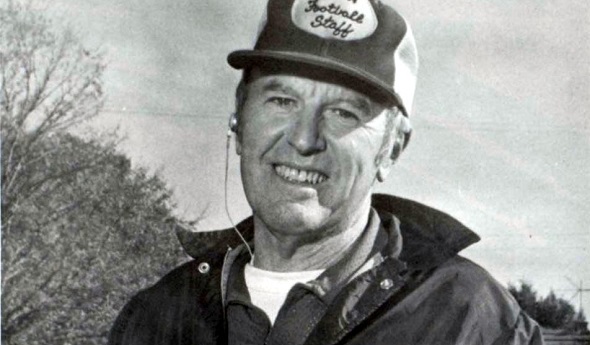
Bill Maskill was once the winningest football coach in Michigan high school history, chalking up the majority of his victories at Galesburg-Augusta. One of only six who could claim such an honor – coaches are first counted after reaching 200 wins – he received his start in coaching at Sheridan High School (now known as Central Montcalm since the Sheridan and Stanton school districts merged in 1963). In 1980, he became only the second coach to compile 200 varsity victories as a coach, and in the fall of 1982 he surpassed Muskegon Heights’ coaching legend Oscar E. ‘Okie’ Johnson on the victory list.
Maskill’s coaching accomplishments – and their historic significance – are a reminder of a change in eras. Michigan prep sports in the pre-playoff days were filled with coaches with Swiss-Army like skills, as many were expected to coach multiple sports at their respective schools. The gridiron season was unlike today’s in many ways, and the differences are reflected in a variety of manners within the state record books.
Coaching and player season performances up to the creation of the MHSAA Playoffs in 1975 were constrained by the schedule. In general, nine games was the max. (With the playoffs, a season can extend up to 14 games.) Maskill’s victory total now ranks 16th overall in Michigan high school history, as there are 63 coaches with at least 200 varsity wins. Two coaches, John Herrington of Farmington Hills Harrison – the state’s current leader – and Al Fracassa, long of Bloomfield Hills Brother Rice, amassed more than 400 varsity victories during their careers. In both cases, more than 65 victories were earned during the postseason.
The MHSAA postseason was approaching its eighth year of existence when Maskill passed Johnson as the winningest football coach in state history. To that point, Maskill’s Rams had twice qualified for the playoffs – the first time in 1976, and again in 1980 – but had yet to win a game during the postseason.
But he stayed atop the state’s football wins list for more than a decade – and later found playoff successes as well, more crowning achievements for a coach whose many wins came after turning around both programs fortunate enough to employ him over a combined 44 seasons.
A Rough Start
Maskill’s career, at least in his eyes, was nearly derailed during his first season at the helm.
“The year was 1949, and Bill Maskill was in his first year as varsity football coach at Sheridan High, about 50 miles north of Lansing. He thought it would probably be his last. His team did not win a single game. ‘A couple of times, I thought of throwing in the towel,’” Maskill told Mick McCabe of the Detroit Free Press in October 1982, when he surpassed Johnson in victories.
There was little likelihood that Maskill would be dismissed as coach after that disappointing season. But it took a few years for his Redskins to become competitive.
“Previous to his work there, Sheridan had not played football and there was little interest in the game,” noted the Battle Creek Enquirer in the spring of 1957, when Maskill was announced as the new football and baseball coach at Galesburg-Augusta High School. “He built up interest to the point that during the past five years, Sheridan has won the Montcalm County League championship once and finished second for four years. During this period, the team’s overall record was 31 won, 9 lost and 2 tied. In baseball, he had one county championship, finished second twice and third twice.”
A 1941 graduate of Detroit DeLaSalle, Maskill had been a hard-plunging fullback on the football team who also boxed in Catholic Youth Organization tournaments. Following graduation, he initially enrolled at the University of Michigan in 1942, receiving his freshman numerals from coach Wally Weber, but only after a year at prep school near Pittsburgh.
“I screwed around a lot in high school and couldn’t get into Michigan,” he told McCabe years later, laughing. “They sent me to this prep school, and I couldn’t believe all the studying I had to do. It was the best thing to ever happen to me.”
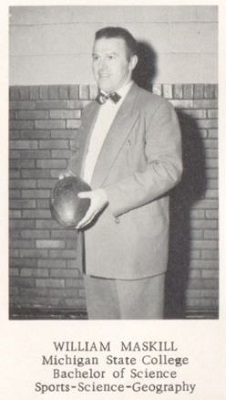
He ended up at Michigan State, where he earned a varsity letter from coach Charlie Bachman in 1944 and his bachelor’s degree.
“He was hard of hearing; he had it bad,” recalled Bob Ludwig of Muskegon, a football teammate with Maskill in the backfield for the Spartans in 1945. “Our quarterback would mouth the words of the play to him.”
Over time, Maskill had multiple operations in hopes of correcting the issue.
The attempts improved his hearing, according to Maskill, “to about six percent. And that’s the truth. But there are some advantages. The kids can cuss at me and I don’t know it.”
The disability never stopped him. He told McCabe that the only thing he ever wanted to be in life was a football coach: “I just liked playing football, and that made me want to coach.”
Another Rough Start
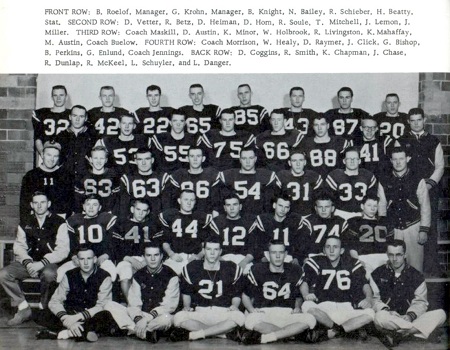
At Galesburg-Augusta, he inherited a team that finished with a single tie amid eight losses the year prior to his arrival. Improvement certainly wasn’t reflected in the standings in Maskill’s first year in charge. The Rams completed the eight-game season without a victory or a tie to show for their efforts. That changed in year two, as G-A finished with a 7-1 mark. The only loss was to unbeaten Bangor, 40-21, in the season finale. In 1959, Maskill and his stable of assistants had completely flipped the table, as the Rams ended with a perfect 8-0 mark.
“Galesburg-Augusta blasted Bangor, 27-0, before a crowd of more than 2,500 fans at jam-packed Angell Field in Kalamazoo … in a battle between the Kalamazoo Valley’s unbeaten football teams. Bangor’s great 21-game winning streak simply collapsed before the high-powered running attack as the Rams rolled to their seventh straight victory of the season,” wrote Dick Kishpaugh in his coverage for the Enquirer. Kishpaugh would later be known as Michigan’s authority on high school sports.
A week later, the Rams trounced a solid Paw Paw team on the road, 33-7. They finished third in the United Press International season-ending Class C-D rankings behind Charlevoix and Cassopolis.
Statewide Success
That was the first of eight G-A squads to finish the regular season undefeated for Maskill. The next four would each be named mythical state champions according to the polls.
His 1962 team allowed only 14 points across eight games to end the year as Class C-D champion ahead of St. Joseph Catholic according to The Associated Press poll of Michigan sportswriters and sportscasters.
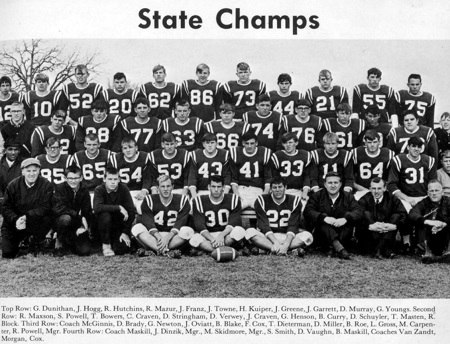
Maskill’s 1966 and 1967 Rams squads each finished unbeaten and untied in nine contests. The 1967 team scored a school-record 389 points on the year, and held opponents to a mere seven points – a touchdown and an extra point scored by Springfield in a midseason 27-7 triumph. The 1970 team also finished with a flawless 9-0 mark, topping the 1967 team’s offensive output with 408 points on the season.
Maskill’s 1976 team ended the regular season 9-0 and was one of only four teams to advance to the Class C postseason in place during those earliest days of the MHSAA playoff system. G-A immediately was eliminated by Flat Rock, the eventual champion.
The media spotlight came to Galesburg-Augusta in 1980 for a regular season-ending contest with Constantine. A victory would give the veteran coach another perfect regular season and push Maskill’s career win total to 200. The week played out under television station coverage and multiple newspaper reports.
“More than 120 of Maskill’s former players were on hand, some wearing varsity letter jackets that were nearly 20 years old. All trotted onto the field, according to their graduation years, during halftime festivities,” said Bob Byington in the Enquirer. “… The warmest embrace and greeting were reserved for Maskill’s son, Bill Jr., an assistant coach at the University of Louisville. The younger Maskill drove in from Kentucky to surprise his dad …”
 The Rams won 28-6 to finish 9-0, qualifying for the MHSAA Playoffs for the second time in school history. The team ranked fifth in the final AP poll. A loss to White Pigeon in the opening round capped the season.
Despite impressive 8-1 records in 1981, 1982 and 1983, the Rams didn’t return to the playoffs until 1985. There, they won their first postseason contest, downing Hudson, 21-6, in a Pre-Regional. G-A fell the next weekend to eventual Class C titlist Lansing Catholic Central.
Lansing Catholic would again eliminate the Rams from the postseason the following year.
We Have a Lot of Heart
The MHSAA approved an expansion to the football playoff system in 1990, doubling the classifications from four to eight, which in turn doubled the number of annual qualifiers. While the Rams finished the regular season with a single defeat, they were unranked in the weekly press polls. Thanks to the changes to the playoff system, they were in the tournament, but weren’t expected to go far.
Rumors had circulated that this – Maskill’s 40th year as a head coach – would be the last go-around for the 67-year-old veteran coach. The first-round opponent was No. 4-ranked Dansville. With the Rams trailing 17-0 with 8:33 remaining in the third quarter, the result didn’t look promising.
But Jason Meek would have none of that. The Rams started their comeback with a trick play – a halfback pass by Meek off a lateral for a touchdown reception by Rusty Smith. It was followed on the next possession by a 27-yard TD reception by Meek from reserve quarterback Dave Lemmien. A pair of 2-point conversions by Rick Tyson had cut the lead to 17-16. Tyson scored the game winner on a one-yard touchdown run, set up by an interception by Meek that capped a 14-play, 59-yard drive – all rushes – that burned 6:53 off the clock. The defense shut down Dansville for the remaining six minutes of the contest.
A week later, the Rams lined up against No. 1 Schoolcraft, the two-time reigning Class C champion which was riding a 16-game win streak. The Eagles had lost only three of their last 57 games.
Galesburg-Augusta stunned all prognosticators with a 15-13 win before nearly 5,000 fans.
The Rams ran the ball 52 times, with Tyson handling the ball 28 occasions for 78 yards including a 19-yard TD that opened the game’s scoring. Schoolcraft tied the game at 7-7 just before the half, then opened a 13-7 lead on its second drive of the second half.
“It took all of us to do it,” said G-A junior fullback Paul Zimmerman, who scored the game-tying touchdown, and winning 2-point conversion on nearly identical plays with 4:01 remaining in the game.
Again, like the previous week, the Rams’ defense rose to the occasion, shutting down the Eagles for the remaining minutes.
“They kept the football,” said Larry Ledlow, coach of Schoolcraft about the second half. “Our defense was on the field much too long.”
G-A would win its Week 12 Semifinal contest with Clinton, 22-7, to advance to its first MHSAA Final. Corky Meinecke wrote a career-respective feature on Maskill that appeared in the Free Press on the day of the game:
“Just about everyone who loves, respects and admires Bill Maskill … figures he’ll announce his retirement sometime after the Rams play Muskegon Catholic Central … in the Class C championship game at the Silverdome. The timing couldn’t be better. Getting the Rams (11-1) to the Silverdome was the last notch on a heavyweight coaching belt that includes four mythical state titles … and five playoff appearances. He is the winningest football coach in state prep history …”
Weighing into the pending decision was a surprising aspect few ever considered.
“Maskill never figured he’d run out of players before he ran out of desire,” wrote Meinecke, “but that appears to be the case. Of G-A’s 24 players, only six are underclassmen. The school did not field a freshman team and the junior varsity – comprised of mostly freshmen – forfeited its last two games because it could not suit up enough players.”
 “A normal person would retire,” said Ken Buelow, Maskill’s assistant for all but three of the coach’s seasons at G-A and Sheridan. “But you have to remember, Bill is not a normal person. You’re talking about one hell of a human being here.”
“We don’t have size, we don’t have quickness and we don’t have speed,” Maskill said to Meinecke about this team that was perhaps the most satisfying of his career. “But we have a lot of heart.”
The Rams lost to MCC.
Changing landscapes
Maskill’s decision still took time. In August 1991, the G-A administration officially announced that the district would not field a varsity football team that coming fall.
“We do not have the numbers,” said athletic director Alex Forrester at the time. “It has nothing to do with money. … We do not have enough players.”
G-A chose to sponsor only a JV team that season. Instead of walking away, Maskill chose to stay on.
“I’ve never not coached a varsity,” he told Mark Bradley of the Enquirer. “I won’t know how to coach at the junior varsity level. But coaching is coaching, whether it be at the varsity or junior varsity level.”
He had retired from teaching following the 1980-81 school year and was one of 30 individuals inducted into the inaugural class of the Michigan High School Football Coaches Association’s Hall of Fame in April 1983. In October 1986, the school district honored him by naming the G-A football field in his honor. Without Maskill walking the halls and recruiting, fewer and fewer kids came out for football. After a year leading the JV, in July of 1992, he officially stepped aside from coaching. Forrester, one of his longtime assistants, took charge.
Maskill had purchased a tire company after he retired from teaching, and that became his focus.
In October 1994, over 12 years after Maskill had passed Johnson on the win list, Marysville’s Walt Braun passed Maskill in total wins. Leo “Smokey” Boyd of Saginaw Nouvel overtook Braun on the list in 1996. In turn, Fracassa topped Boyd in 2001, and Herrington bettered Fracassa’s total in 2017.
The “Ram Family”
The floor-to-ceiling mementos from his career that Maskill shared with Meinecke during their conversation were a feature of a party that Maskill would host annually.
“… It was not unusual to have 200-plus (former players, coaches, and new and old friends) there to celebrate the man they knew as ‘Coach’,” wrote Bill Broderick in a heartfelt article in the Enquirer, announcing Maskill’s passing.
Several years back, Buelow, his old assistant coach, had organized a group to create “a would-be Galesburg-Augusta football museum” in Maskill’s basement.
“… I was shocked when I heard,” said Bill Maskill, Jr., to Broderick concerning his Dad’s passing. Head football coach at Midwestern State University in Wichita Falls, Texas, since 2002, Bill Jr. had earned all-state honors at quarterback as a senior at G-A in 1966. "He went out and walked a mile on Monday. We all thought he would live forever."
 Ron Pesch has taken an active role in researching the history of MHSAA events since 1985 and began writing for MHSAA Finals programs in 1986, adding additional features and "flashbacks" in 1992. He inherited the title of MHSAA historian from the late Dick Kishpaugh following the 1993-94 school year, and resides in Muskegon. Contact him at [email protected] with ideas for historical articles.
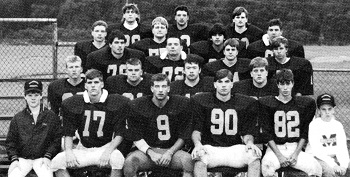
PHOTOS: (Top) Bill Maskill Sr., here during the 1980-81 school year, was the state’s winningest high school football coach all-time after his final varsity season in 1991. (2) Maskill, shown here during the 1954-55 school year, played football and earned his bachelor’s degree from Michigan State. (3) The 1959 Galesburg-Augusta team finished 8-0. (4) The 1966 Galesburg-Augusta team was named a mythical state champion by media rankings. (5) Maskill took his team to the MHSAA Finals for the first time in 1990, when it finished Class C runner-up. (Photos gathered by Ron Pesch.)