


Best Practices
June 28, 2016
Two-thirds of concussions reported in Michigan high school football last fall occurred in games. Even though there are at least five times more hours of exposure during practices than games, there are half as many concussions during practice, according to the mandated concussion reporting requirement of the Michigan High School Athletic Association that is unmatched in the country in terms of its depth and breadth for a statewide requirement.
Michigan was among the handful of states to restrict contact in practice, in 2014, a full season prior to recommendations from the National Federation of State High School Associations and later action by most other statewide associations.
Some of those statewide organizations continue to operate without limitation on contact in football practices, while their counterpart organizations in other states have gone so far as to limit contact to a certain number of minutes in a day and/or week.
Entering mostly uncharted waters for high school football in early 2014, an MHSAA task force recommended that the number of practices be limited where collisions between players could occur – no more than one per day during preseason, no more than two per week after the first game.
This change was embraced by this state’s football coaches association and adopted by the MHSAA Representative Council. All parties liked the ease of administration of this policy, and all distrusted the idea of limiting the number of minutes of contact during practices.
If there is a 30-minute limit on contact in a day or a 90-minute limit on contact in a week, is it the same 30-minute or 90-minute period for all players, even if many are not involved in one or more of the contact drills? Or does the limit apply to each player individually; and if so, how is that tracked, and by whom?
These and other questions made coaches and administrators question how effective a limit on minutes might really be. Nevertheless, a 90-minute per week limit during regular season has been made an MHSAA recommendation for the 2016 season. This will provide an opportunity to address and possibly answer some of the questions that have been raised.
The MHSAA will survey schools this fall about their practice plans and the actual time spent in contact drills by players, assessing how that differs according to offense, defense, player position and grade in school, and determining best practices for how to track player contact minutes.
When Michigan acted in 2014 to limit contact in practice, it was one of the first states to do so. As Michigan takes additional steps to limit contact in practice, it will be one of the first states to do so after researching the best ways to actually do it.
Finals Four: Ithaca Adds to Title Streak
November 29, 2013
By Geoff Kimmerly
Second Half editor
DETROIT – As the final seconds ticked down in Friday’s Division 6 Final, Ithaca’s players predictably began throwing four fingers into the air – signifying their fourth straight MHSAA title.
But the Yellowjackets could’ve chosen instead to press a thumb and fingertip together and form a zero – as in how many times they’ve lost during this greatest run in state football history.
Ithaca re-claimed a tie with Iowa City Regina (Iowa) for the nation’s longest active winning streak of 56 straight by climbing back from an early deficit to beat Clinton 41-22 at Ford Field.
The Yellowjackets’ run of perfection also is the longest in MHSAA history to occur entirely during the playoff era. Only Hudson, with 72 straight wins between 1968-75, put together a longer streak – and the Tigers’ included only one playoff win before they fell in the first-ever MHSAA Class C Final.
Also, only two teams have won more consecutive titles than Ithaca; East Grand Rapids and Farmington Hills Harrison achieved five straight apiece.
“We have a huge target on our back, and we all know that. As a team, we handle it pretty well,” said Ithaca senior quarterback Travis Smith, who finished his career 41-0 as a starter and as the only player who dressed for all four Finals wins.
“We left the whole winning streak for our community to play with. We don’t really think about it too much. We just focus on the task at hand, which is what our coaching staff says all the time. And I’m just so proud of my team and my friends.”
Despite the convincing final score, Ithaca did trail Clinton into the third quarter. Amazingly, the Yellowjackets trailed in all of the final four playoff games this fall.
Coach Terry Hessbrook, in his 10th season running the program and a former Ithaca standout himself, called three of the running backs his team faced during the run – Maple City Glen Lake’s Trevor Apsey, Negaunee’s Tyler LaJoie and Clinton junior Collin Poore – among the best Ithaca has ever faced. Then there was the more sizable Montrose, which provided the season’s greatest scare before falling to the Yellowjackets by a point in the Semifinal.
 “We’ve been behind four playoff weeks in a row. It just does not seem to faze them,” Hessbrook said of his players. “With the big heavy weight, burden, on their shoulders and the bulls eye and the winning streak and all that kind of stuff, I’ve got to believe that a lot of high school kids would crumble under that kind of pressure.
“These guys are going to go on to do amazing things in life because they’re special people.”
But it was Clinton (13-1) that appeared early to be special enough to end Ithaca’s streak. The Redskins capped their best season ever by making their first MHSAA Final.
“I came last year to watch Ithaca play. Just coming to play the game is totally different,” Clinton senior quarterback T.J. Baker said. “I knew I was nervous right when I stepped on the first. It was just crazy to play in this game. But at the same time, it was fun. Our community has never been here before, and it was just a fun game to play in.”
After Ithaca jumped to a 14-0 lead, Clinton bounced back with a Poore 18-yard touchdown run and an 86-yard punt return score by sophomore Mathew Sexton.
That seemed to nudge Ithaca’s offense – which finished this season with 710 points, third most in MHSAA history. Smith threw the second of his four touchdown passes to give Ithaca back the lead heading into halftime, and followed another Poore score at the start of the third quarter with two more scoring passes and a scoring run.
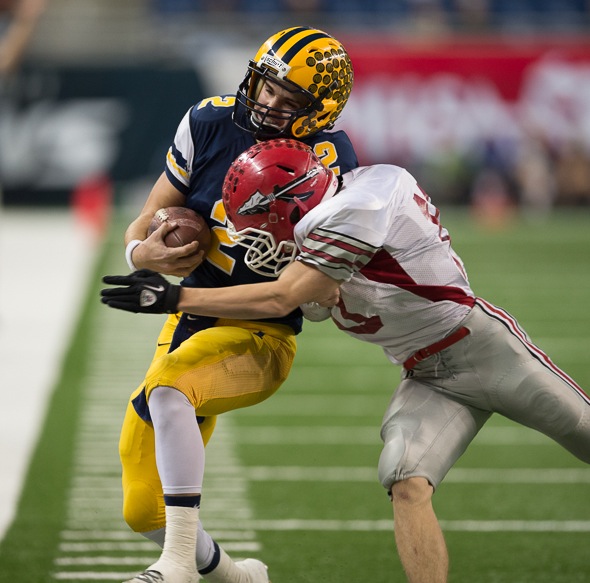
Smith also returned an interception 30 yards for a touchdown during the first quarter, giving him a hand in all six Ithaca scores. He finished his high school career with an MHSAA record 104 touchdown passes, and in this game 123 yards rushing and 247 passing.
“He lived up to his billing,” Clinton coach Scott McNitt said. “We did the best we could against him. And for two and a half quarters, we felt we were right there. And then it just got away from us a bit, and the momentum changed.
“I couldn’t be more proud of a group of young men who overcame a lot of adversity. To make it to the state finals, it’s unheard of where we come from.”
Hessbrook said everything he feared about Clinton seemed to go wrong for his team during the first half. Poore finished with 125 yards rushing and the team as a whole had 254, taking advantage of its perimeter speed to get around the corner on pitch sweeps and other similar runs for 208 of those yards during the first half.
But the Yellowjackets made the necessary adjustments during the third quarter, taking away that edge while bringing more pressure – Ithaca finished with 13 tackles for losses including seven sacks.
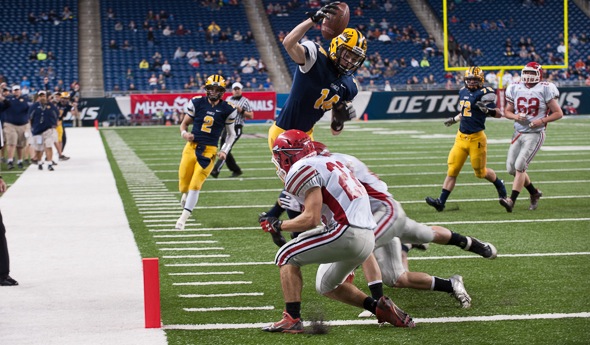
Senior Josh Hafner caught two of the scoring passes from Smith, and senior Eli Villalobos had six catches for 82 yards and a score. Senior Logan Hessbrook also had six catches, for 93 yards and a score, to follow last season’s performance when he stepped in for an injured Smith at quarterback and led the team to the title.
“You’re playing with your best friends you’ve grown up with your whole life. It’s the best group of friends I’ve ever had and could ask for,” said Hessbrook, who also is the coach’s nephew. “And the coaching staff and the community, it’s amazing.
“Ithaca’s a special place. Coach says that; everyone says that. And when I get out of college, I’m going to try to come right back to Ithaca, because it’s amazing to live there.”
PHOTOS: (Top) Ithaca senior Josh Hafner (14) leaps over two Clinton defenders on the way to one of his two touchdowns. (Middle) Ithaca quarterback Travis Smith holds tight to the ball after a big hit from Clinton’s Mathew Sexton. (Click to see more from Terry McNamara Photography.)