


Inside Selection Sunday: Mapnalysis '13
October 28, 2013
By Geoff Kimmerly
Second Half editor
At the end of the day – Sunday, in this case – the 2013 MHSAA football playoff field was determined based on a set of numbers we began working with long before the first kickoff of this season.
So to kick off our discussion of how some of the 2013 playoff-selection decisions were made, here are a few numbers that might boggle the mind – or at least surprise:
- A total of 3,111 high school results were used in determining this season’s field – 2,978 for 11-player and 133 for 8-player games.
- We inputted and then followed the schedules for 623 MHSAA teams.
- We also inputted and followed weekly the schedules for 50 teams from surrounding states and Ontario that played at least one game against one of our MHSAA schools.
- We worked through complicated maneuverings made necessary by seven teams playing a mix of 11 and 8-player games, plus two more teams that played a mix of varsity and junior varsity opponents.
- And by Sunday morning we ended up with a few more numeric rarities: only 225 automatic qualifiers, the fewest since the current playoff system was introduced in 1999, and also an uneven number of at-large bids from our four classes because only six Class D teams reached the number of victories needed to be considered. (This was balanced by taking more at-large qualifiers from Classes A, B and C.)
And that was just the start of one of our most exciting days of the school year.
Following are more details. First, I explain some of the history of the MHSAA playoffs – I’ve lifted this in part from our 2012 report, so skip ahead if you’ve already got that down. Next, I touch on five themes that emerged as we built the brackets for this season’s tournament.
The process
Our past: The MHSAA playoff structure – with 256 teams in eight divisions, and six wins equaling an automatic berth (or five wins for teams playing eight or fewer games) – debuted in 1999, as mentioned above. An 8-player tournament was added in 2011, resulting in nine champions total when November is done.
That’s a long way from our start. The first playoffs were conducted in 1975 with four champions. Four more football classes were added in 1990 for a total of eight champions each fall. Through 1998, only 128 teams made the postseason, based on their playoff point averages within regions (four for each class) that were drawn before the beginning of the season. The drawing of Districts and Regions after the end of the regular season did not begin until the most recent playoff expansion.
In early years of the current process (or until the middle of the last decade), lines were drawn by hand. Dots representing qualifying schools were pasted on maps, one map for each division, and those maps were then covered by plastic sheets. Districts and Regionals literally were drawn with dry-erase markers.
Our present: After a late Saturday night tracking scores, we file in as the sun rises Sunday morning for a final round of gathering results we may still need (which can include making a few early a.m. calls to athletic directors). Then comes re-checking and triple-checking of enrollments, what schools played in co-ops, some records and more before the numbers are crunched and the fields are set.
Those 256 11-player teams are then split into eight equal divisions based on enrollment, and their locations are marked on digital maps that are projected on wall-size screens and then discussed by nearly half of the MHSAA staff plus a representative from the Michigan High School Football Coaches Association. Only the locations themselves are marked (by yellow dots) – not records, playoff point averages or names of the schools or towns. In fact, mentions of those are strictly prohibited. Records and playoff points are not part of the criteria. Matchups, rivalries, previous playoff pairings, etc. also DO NOT come into play. The same process is followed for organizing the 8-player bracket.
Observations and answers: 2013
This doesn’t happen overnight: Preparation for selecting the MHSAA playoff field begins long before the first kickoff of fall, much less the first practice. We load schedules for all 600-plus varsity teams during the summer, and many schedules remain fluid right up until the first Friday of the season – and this fall, a few weren’t settled until Week 2 or 3.
This summer as in some past we also worked through schools closing (Inkster, Saginaw Buena Vista, Detroit Northwestern, Flint Northern), and others deciding in mid-July and early August they would not field teams because of a lack of players.
Sometimes we have to take odd paths to find scores for these games. The last 11-player score to be added to our data this regular season came in as a result of tweeting the sports anchor of a Wheeling, W.Va., television station. Our last 8-player score came in via email from a Wisconsin athletic director at 10:30 Saturday night. Thankfully, we get plenty of assistance from some of our friends in the field, who keep an eye on the data and alert us when something appears missing or incorrect.
Win and advance: This season’s list of 5-4 teams includes a number of heavy hitters that did not receive at-large bids – East Grand Rapids, Utica Eisenhower, Orchard Lake St. Mary’s and Flint Powers Catholic to name a few. All were solid teams and played strong competition. All missing the playoffs likely raised some eyebrows.
But we have to take a look at this from a statewide view. There admittedly can be some argument about what schools qualified for the 226-256 spots in the field – but the important part is that 225 qualified because they all met the minimum win requirement. A playoff is simply that – it decides a champion based on teams winning. For some it’s harder to pile wins, of course, because they play in tough leagues. But the winners of those leagues are in the field – and surely will credit that tough road with getting them prepared to now play the state’s best.
Geography rules: This long has been rule number one for drawing MHSAA brackets in any sport, and is a repeat as well for those who have read this report the last two Octobers. Travel distance and ease DO come into play. Jumping on a major highway clearly is easier than driving across county-wide back roads, and that’s taken into consideration.
Also, remember there’s only one Mackinac Bridge and hence only one way to cross between peninsulas – and boats are not considered a possible form of transportation. When opponents from both peninsulas will be in the same District, distance to the bridge is far more important than as the crow flies.
The best example of this comes this season in Division 5. Grayling clearly is east of both Kingsley and Kalkaska – but also sits on I-75, while those two do not. So while those more western teams are geographically closer to Houghton, Menominee and Kingsford from the Upper Peninsula, we instead paired the three U.P. teams with Grayling because being on a main highway made for a shorter trip. The trip to Grayling for any of those U.P. teams would be 36 miles shorter to Grayling than Kingsley and 13 miles shorter to Grayling than Kalkaska.
Sometimes it’s where the points aren’t: Sure, it would be best-case scenario to have perfect sets of eight dots split into four quadrants from Calumet to Bedford. But generally that doesn’t occur. “Dots determine the map” is a common phrase heard here during this selection process, but that works the other way as well. If there are no qualifiers in a division from a specific area of the state – see Division 1, with none south of Holland or west of the greater Lansing area – there’s no choice but to create the unusual Regional Final possibility of Traverse City West vs. Brighton. Brighton is simply closer to the west side of the state than our other options.
Border to border vs. coast to coast: Should Regions be grouped north to south or east to west? There isn't a right or wrong answer – it just depends on that set of dots.
Whenever we have Upper Peninsula teams in a division, they’ll be grouped with those from the northernmost points of the Lower Peninsula for a District. The next northernmost schools will be grouped into a District, and together those eight will form a Region.
But the tough decision comes with the other six Districts. Look at this season’s Division 5 map: Six Districts are grouped south of U.S. 10 with three near or west of U.S. 127 and three east of that highway, which runs through the center of the Lower Peninsula. We grouped the two southwestern Districts into a Region and the two southeastern Districts into a Region – leaving a final Region that stretches from Muskegon on Lake Michigan to Almont, about 35 miles west of Lake Huron.
That’s a haul. But it’s also the best of our possible compromises. We could’ve instead paired regions that would’ve stretched from Hopkins to Monroe – only 19 fewer miles in distance than Muskegon Oakridge to Almont, but a scenario that could’ve created travel increases for a number of additional teams. Another option included a possible trip from Detroit University Prep to Freeland, which also would take more than two hours.
Bottom line – it’s been written here before – we pour all we have into this process, asking questions often more than once until we come up with a consensus. We do appreciate the arguments that arise once brackets are released to the public: The discussions are proof of how much players, coaches and fans care – and often show us new ways we can look at a system that’s now 15 years old.
But we must remember that the good news is the tournament is still set up to reward nine champions over the next five weeks, and five schools – Auburn Hills Oakland Christian, Coldwater, Detroit Allen, Eaton Rapids and Muskegon Mona Shores – will be competing for those titles for the first time.
It’s not so much how the tournament starts as how it ends. And we’re preparing for nine more memorable conclusions.
PHOTO: Each collection of grouped dots is a District on this season's Division 3 playoff map.
Ithaca Finds a Hero in Hessbrook
November 23, 2012
By Geoff Kimmerly
Second Half editor
DETROIT – Logan Hessbrook started at quarterback for Ithaca’s junior varsity last season as a sophomore, and probably would start for a few hundred teams that don't have the luxury of all-state quarterbacks every season.
But neither takes away from the fact that he’d taken only one or two reps at the position during the last four weeks of practice. With junior superstar Travis Smith behind center, there really wasn't a need.
So when Smith was injured on his team's second play of Friday’s MHSAA Division 6 Final at Ford Field, his coach and top receiver were quick to offer encouragement.
“I said, ‘Listen bud. Travis isn't coming back,’” Ithaca coach (and Logan’s uncle) Terry Hessbrook said. “’We’re going to live and die with you. Just play the way you’re capable of playing.’”
Senior Markes Gadlen – a three-year starting receiver and the third-string quarterback – also took Logan aside. “I can’t see over the line,” Gadlen told him, “so I was just letting him know he’s all we've got.”
And Hessbrook was more than enough.
Ithaca won its third straight MHSAA title – with a third quarterback leading the way – by downing Constantine 37-27. It was the second straight season the teams met in the championship game.
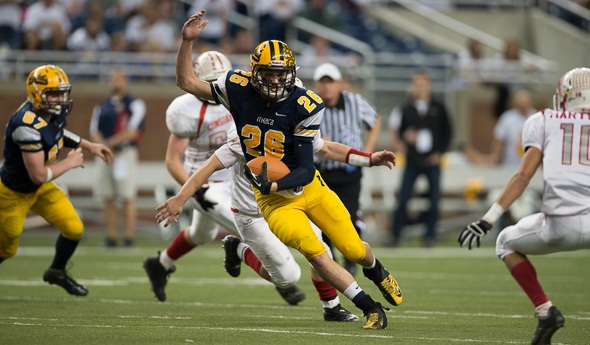
And Hessbrook was the most unlikely of heroes. Sure, he’s a starting defensive back. But in his number 26 jersey, he couldn't have looked more out of place running the offense – until he led it to four straight scores to break the game open midway through the fourth quarter.
“I was obviously nervous at the beginning, but I settled in as the game went on, and my teammates kept picking me up,” Hessbrook said. “They were saying you’re all right, we can help you, we can pick you up. The linemen did a great job blocking, the receivers did a good job blocking on the edge, and they ran good routes. We just did what we could do.”
The win also gave Ithaca its third straight 14-0 season. That streak of 42 straight victories is fourth in MHSAA history and two from tying for second. It’s also second and one win shy of the longest streak among those that took place entirely within the playoff era that began in 1975.
The Yellowjackets have beaten opponents by an average of 37 points over those games. And this season, they scored their most points (675, good for third-most in MHSAA history) and gave up their fewest (110) of the streak. But this game had all the signs of a streak buster.
“This might be the toughest game we've ever been a part of,” Terry Hessbrook said. “We haven’t faced a lot of adversity during this run. And a lot of our games have been over in the second or the third quarter. For these players to continue to fight the way they (were), I can’t put it into words and I can’t express how proud I am of the way they just kept fighting.”
Smith was hurt on a four-yard run on his team’s second play from scrimmage. But after that and despite his sizable absence, this rematch began playing out a lot like the teams' matchup in 2011.
Like last season, Ithaca and Constantine went into halftime tied – this time 20-20. And like last season, Ben Mallo and the Falcons’ run game was doing just about everything they wanted.
That’s hardly rare – the team ran for 6,407 yards on the season. And in this game, Constantine ran for 287 yards during the first half, and Mallo had 147. But after the Yellowjackets reviewed their assignments during halftime, the Falcons added only 130 more yards over the final two quarters.
 And Logan Hessbrook looked like yet another star Ithaca quarterback. After completing just 2 of 5 passes this season heading into the game, he hit 7 of 13 for 104 yards and two touchdowns. He ran for 113 yards and two more scores.
“ We've struggled all year stopping people defensively. So when we game-planned to stop Ithaca, it wasn't to stop Travis Smith, so to speak,” Constantine coach Shawn Griffith said. “They did step up, I think, and show the ability to run a little bit better than we thought they were capable of doing when we came into the game. And they still hit the big pass when they needed to. You don’t win 42 straight football games because of one good football player. You've got to have a stable of them, and he’s got quite a few.”
While Ithaca’s second-half possessions amounted to 17 points, Constantine’s turned into seven – and included a turnover on downs, a lost fumble and a punt that was blocked by senior Tyler Gibson and eventually led to a field goal.
Constantine did end up with 504 total yards. Mallo ran for 207 and a touchdown – and had 12 tackles at linebacker – and sophomore Justin Hull added 102 yards and a score on the ground. Senior Tommy Reed, who didn't get to play quarterback in last season’s Final because of an injury, ran for a score and had 10 tackles at safety.
The Falcons finished 11-3 and made their run after finishing third in the Kalamazoo Valley Association.
“We were all seniors, and we all wanted to get back. We didn't want football to end, because for most of us this is our last chance,” Reed said. “Once the playoffs came, we finally started playing as a team. Our defense picked up and our offense continued to roll.
“To get back here, we had a couple turnovers that went our way, and we were able to convert on every turnover. This game was the opposite. We had a couple of turnovers and we couldn't convert, and the one we turned over to them they ended up converting. That’s what hurt us.”
Senior Jared Evers ran for one score and caught a pass for another for Ithaca. Senior Josh Capen had a team-high 10 tackles.
Click for full statistics and to watch a replay of the game. See below for the full press conference.
PHOTOS: (Top) Ithaca quarterback Logan Hessbrook (26) eludes Constantine defenders during one of his runs Friday. (Middle) Ithaca receiver Markes Gadlen hauls in a touchdown pass midway through the second quarter. (Click for more from Terry McNamara Photography.)