

Inside Selection Sunday: Mapnalysis '13
October 28, 2013
By Geoff Kimmerly
Second Half editor
At the end of the day – Sunday, in this case – the 2013 MHSAA football playoff field was determined based on a set of numbers we began working with long before the first kickoff of this season.
So to kick off our discussion of how some of the 2013 playoff-selection decisions were made, here are a few numbers that might boggle the mind – or at least surprise:
- A total of 3,111 high school results were used in determining this season’s field – 2,978 for 11-player and 133 for 8-player games.
- We inputted and then followed the schedules for 623 MHSAA teams.
- We also inputted and followed weekly the schedules for 50 teams from surrounding states and Ontario that played at least one game against one of our MHSAA schools.
- We worked through complicated maneuverings made necessary by seven teams playing a mix of 11 and 8-player games, plus two more teams that played a mix of varsity and junior varsity opponents.
- And by Sunday morning we ended up with a few more numeric rarities: only 225 automatic qualifiers, the fewest since the current playoff system was introduced in 1999, and also an uneven number of at-large bids from our four classes because only six Class D teams reached the number of victories needed to be considered. (This was balanced by taking more at-large qualifiers from Classes A, B and C.)
And that was just the start of one of our most exciting days of the school year.
Following are more details. First, I explain some of the history of the MHSAA playoffs – I’ve lifted this in part from our 2012 report, so skip ahead if you’ve already got that down. Next, I touch on five themes that emerged as we built the brackets for this season’s tournament.
The process
Our past: The MHSAA playoff structure – with 256 teams in eight divisions, and six wins equaling an automatic berth (or five wins for teams playing eight or fewer games) – debuted in 1999, as mentioned above. An 8-player tournament was added in 2011, resulting in nine champions total when November is done.
That’s a long way from our start. The first playoffs were conducted in 1975 with four champions. Four more football classes were added in 1990 for a total of eight champions each fall. Through 1998, only 128 teams made the postseason, based on their playoff point averages within regions (four for each class) that were drawn before the beginning of the season. The drawing of Districts and Regions after the end of the regular season did not begin until the most recent playoff expansion.
In early years of the current process (or until the middle of the last decade), lines were drawn by hand. Dots representing qualifying schools were pasted on maps, one map for each division, and those maps were then covered by plastic sheets. Districts and Regionals literally were drawn with dry-erase markers.
Our present: After a late Saturday night tracking scores, we file in as the sun rises Sunday morning for a final round of gathering results we may still need (which can include making a few early a.m. calls to athletic directors). Then comes re-checking and triple-checking of enrollments, what schools played in co-ops, some records and more before the numbers are crunched and the fields are set.
Those 256 11-player teams are then split into eight equal divisions based on enrollment, and their locations are marked on digital maps that are projected on wall-size screens and then discussed by nearly half of the MHSAA staff plus a representative from the Michigan High School Football Coaches Association. Only the locations themselves are marked (by yellow dots) – not records, playoff point averages or names of the schools or towns. In fact, mentions of those are strictly prohibited. Records and playoff points are not part of the criteria. Matchups, rivalries, previous playoff pairings, etc. also DO NOT come into play. The same process is followed for organizing the 8-player bracket.
Observations and answers: 2013
This doesn’t happen overnight: Preparation for selecting the MHSAA playoff field begins long before the first kickoff of fall, much less the first practice. We load schedules for all 600-plus varsity teams during the summer, and many schedules remain fluid right up until the first Friday of the season – and this fall, a few weren’t settled until Week 2 or 3.
This summer as in some past we also worked through schools closing (Inkster, Saginaw Buena Vista, Detroit Northwestern, Flint Northern), and others deciding in mid-July and early August they would not field teams because of a lack of players.
Sometimes we have to take odd paths to find scores for these games. The last 11-player score to be added to our data this regular season came in as a result of tweeting the sports anchor of a Wheeling, W.Va., television station. Our last 8-player score came in via email from a Wisconsin athletic director at 10:30 Saturday night. Thankfully, we get plenty of assistance from some of our friends in the field, who keep an eye on the data and alert us when something appears missing or incorrect.
Win and advance: This season’s list of 5-4 teams includes a number of heavy hitters that did not receive at-large bids – East Grand Rapids, Utica Eisenhower, Orchard Lake St. Mary’s and Flint Powers Catholic to name a few. All were solid teams and played strong competition. All missing the playoffs likely raised some eyebrows.
But we have to take a look at this from a statewide view. There admittedly can be some argument about what schools qualified for the 226-256 spots in the field – but the important part is that 225 qualified because they all met the minimum win requirement. A playoff is simply that – it decides a champion based on teams winning. For some it’s harder to pile wins, of course, because they play in tough leagues. But the winners of those leagues are in the field – and surely will credit that tough road with getting them prepared to now play the state’s best.
Geography rules: This long has been rule number one for drawing MHSAA brackets in any sport, and is a repeat as well for those who have read this report the last two Octobers. Travel distance and ease DO come into play. Jumping on a major highway clearly is easier than driving across county-wide back roads, and that’s taken into consideration.
Also, remember there’s only one Mackinac Bridge and hence only one way to cross between peninsulas – and boats are not considered a possible form of transportation. When opponents from both peninsulas will be in the same District, distance to the bridge is far more important than as the crow flies.
The best example of this comes this season in Division 5. Grayling clearly is east of both Kingsley and Kalkaska – but also sits on I-75, while those two do not. So while those more western teams are geographically closer to Houghton, Menominee and Kingsford from the Upper Peninsula, we instead paired the three U.P. teams with Grayling because being on a main highway made for a shorter trip. The trip to Grayling for any of those U.P. teams would be 36 miles shorter to Grayling than Kingsley and 13 miles shorter to Grayling than Kalkaska.
Sometimes it’s where the points aren’t: Sure, it would be best-case scenario to have perfect sets of eight dots split into four quadrants from Calumet to Bedford. But generally that doesn’t occur. “Dots determine the map” is a common phrase heard here during this selection process, but that works the other way as well. If there are no qualifiers in a division from a specific area of the state – see Division 1, with none south of Holland or west of the greater Lansing area – there’s no choice but to create the unusual Regional Final possibility of Traverse City West vs. Brighton. Brighton is simply closer to the west side of the state than our other options.
Border to border vs. coast to coast: Should Regions be grouped north to south or east to west? There isn't a right or wrong answer – it just depends on that set of dots.
Whenever we have Upper Peninsula teams in a division, they’ll be grouped with those from the northernmost points of the Lower Peninsula for a District. The next northernmost schools will be grouped into a District, and together those eight will form a Region.
But the tough decision comes with the other six Districts. Look at this season’s Division 5 map: Six Districts are grouped south of U.S. 10 with three near or west of U.S. 127 and three east of that highway, which runs through the center of the Lower Peninsula. We grouped the two southwestern Districts into a Region and the two southeastern Districts into a Region – leaving a final Region that stretches from Muskegon on Lake Michigan to Almont, about 35 miles west of Lake Huron.
That’s a haul. But it’s also the best of our possible compromises. We could’ve instead paired regions that would’ve stretched from Hopkins to Monroe – only 19 fewer miles in distance than Muskegon Oakridge to Almont, but a scenario that could’ve created travel increases for a number of additional teams. Another option included a possible trip from Detroit University Prep to Freeland, which also would take more than two hours.
Bottom line – it’s been written here before – we pour all we have into this process, asking questions often more than once until we come up with a consensus. We do appreciate the arguments that arise once brackets are released to the public: The discussions are proof of how much players, coaches and fans care – and often show us new ways we can look at a system that’s now 15 years old.
But we must remember that the good news is the tournament is still set up to reward nine champions over the next five weeks, and five schools – Auburn Hills Oakland Christian, Coldwater, Detroit Allen, Eaton Rapids and Muskegon Mona Shores – will be competing for those titles for the first time.
It’s not so much how the tournament starts as how it ends. And we’re preparing for nine more memorable conclusions.
PHOTO: Each collection of grouped dots is a District on this season's Division 3 playoff map.
1st & Goal: 2025 Football Finals Review
By
Geoff Kimmerly
MHSAA.com senior editor
December 3, 2025
This season’s MHSAA Football Finals saw only two of 20 teams reach championship games for the first time – the lowest number of first-timers since the start of the 2020s – but several more play for Finals titles for the first time in a decade, or two, or even three or four.
 Dearborn Divine Child won its first championship since 1985, Portland St. Patrick its first since 1992, and Harbor Beach, Menominee and Detroit Catholic Central all claimed their first titles in more than a decade as this fall came to a close over the last two weekends.
We also had repeat winners – Orchard Lake St. Mary’s, Jackson Lumen Christi and Martin – and although their runs ended in defeat, Blanchard Montabella and Dexter did advance to championship weekends for the first time.
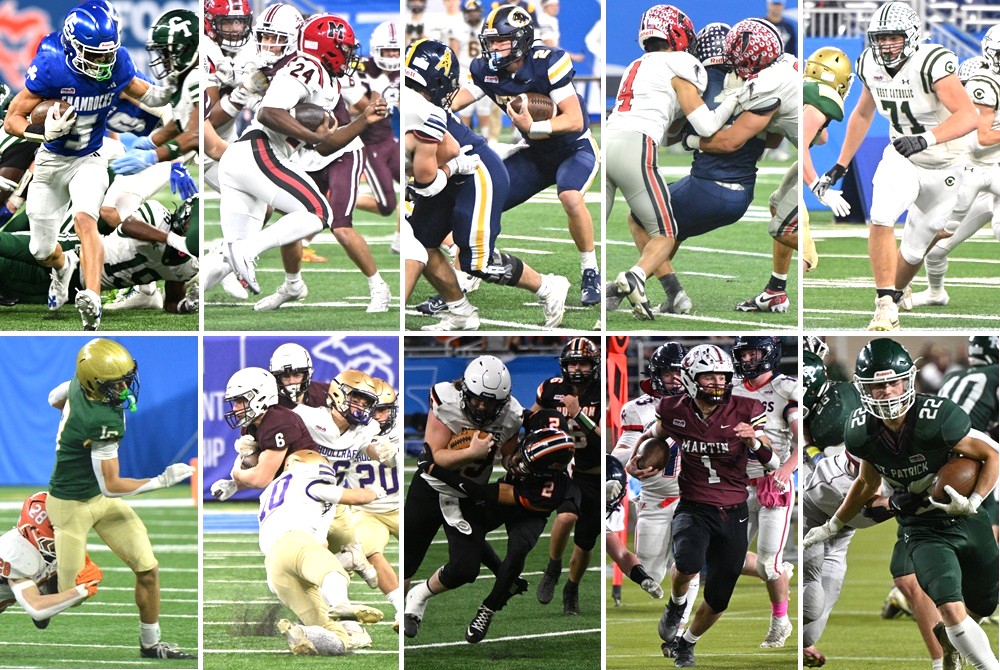
MHSAA.com once again covered all 10 championship games, with quick recaps and links to those stories below followed by notations of performances entered into the MHSAA Finals record books and a report on some of the main storylines to emerge as those championships were being decided.
Finals in Review
11-Player Division 1: Detroit Catholic Central 42, Detroit Cass Tech 19 – Read
DCC claimed its first Finals championship since 2009 by emerging from this matchup of undefeated teams and avenging a 2024 Semifinal loss to eventual champion Cass Tech. While Shamrocks senior Samson Gash has received some of the highest statewide praise for his offensive talents this season, junior brother Gideon Gash starred this time with three touchdown catches all 37 yards or longer.
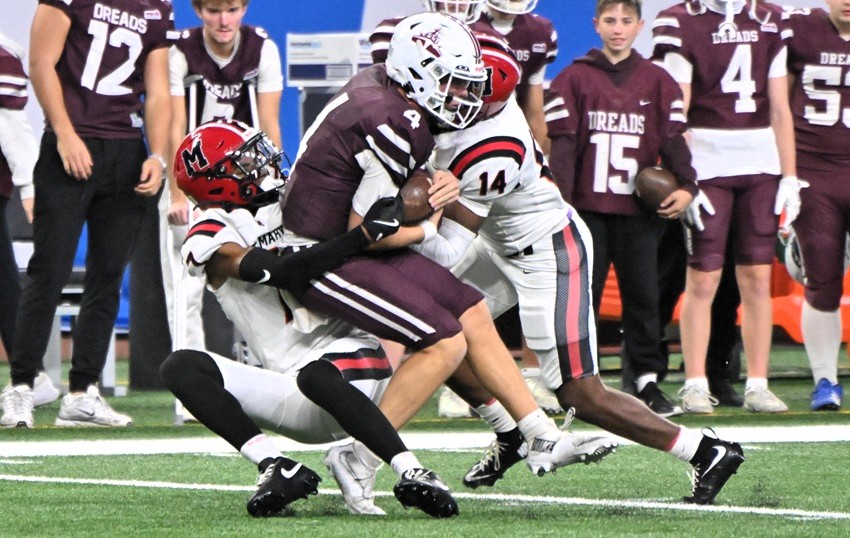
11-Player Division 2: Orchard Lake St. Mary’s 51, Dexter 14 – Read
Orchard Lake St. Mary’s repeated as Division 2 champion following quarterback Jabin Gonzales (304 yards/4 TDs passing, 102 yards rushing) but also thanks to a stellar defensive effort against the Dreadnaughts’ record-setting offensive attack. The Eaglets held Dexter to just 266 total yards, and only 69 during the second half after taking a 24-14 lead into the break.
11-Player Division 3: DeWitt 54, Mount Pleasant 20 – Read
This was another matchup of undefeated contenders, and DeWitt again lit up the scoreboard in winning its second championship. The Panthers set a team Finals record for most rushing yards (575) with senior Traverse Moore claiming the individual Finals rushing record with 397 – 83 more than the previous all-time best.
11-Player Division 4: Dearborn Divine Child 23, Hudsonville Unity Christian 22 – Read
Divine Child’s first Finals championship since 1985 was a product of steady play on both sides of the ball. Offensively, Marcello Vitti ran 19 times for 120 yards and a score and Drew Sheridan completed 19 passes for 241 yards and two touchdowns. Defensively, Divine Child stopped a two-point conversion try midway through the fourth quarter to keep a one-point lead, then held Unity to two yards on its final possession.
11-Player Division 5: Grand Rapids West Catholic 42, Pontiac Notre Dame Prep – Read
West Catholic jumped out to a 28-0 lead and didn’t allow reigning champion Notre Dame Prep to get on the scoreboard until the final minute of the first half. The 1-2 punch of running back Collin Abram and quarterback Grady Augustyn accounted for a combined 347 yards for the Falcons, and the Fighting Irish also lost all-state quarterback Sam Stowe for the majority of the second half with an injury.
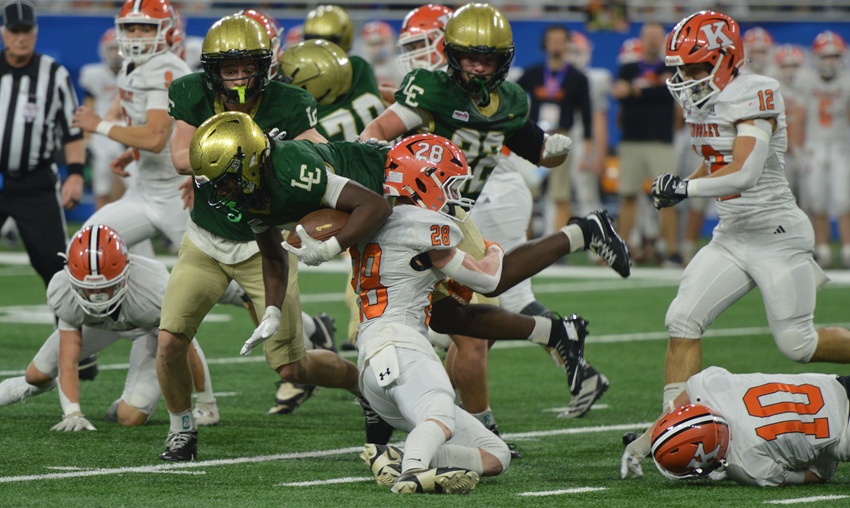
11-Player Division 6: Jackson Lumen Christi 28, Kingsley 15 – Read
The Titans claimed a fourth-straight Finals championship and repeat in Division 6 by scoring the game’s only second-half points – 14 to go ahead and stay there during the fourth quarter. Lumen Christi’s Sean Walicki starred on both sides of the ball, running for 142 yards and two touchdowns and making 17 tackles.
11-Player Division 7: Menominee 34, Schoolcraft 6 – Read
Two years after finishing Division 7 runner-up and only four points shy of Lumen Christi in that title decider, Menominee returned to Ford Field and won its first championship since 2007. Clayton Miller ran for 112 yards and three touchdowns for the Maroons, who finished a perfect 14-0. Schoolcraft’s only points came with 6:09 to play.
11-Player Division 8: Harbor Beach 31, Hudson 20 – Read
The 11-Player Finals opened with a matchup of undefeated contenders. Harbor Beach withstood Hudson’s powerful running attack and followed quarterback Caden Bucholtz (146 yards/1 TD rushing, 82 yards/2 TDs passing) to its first Finals title since 2012. The Pirates took a 21-0 lead into the final four minutes of the first half and got a scoring run, touchdown reception and 20-yard field goal from Skiler Kruse.
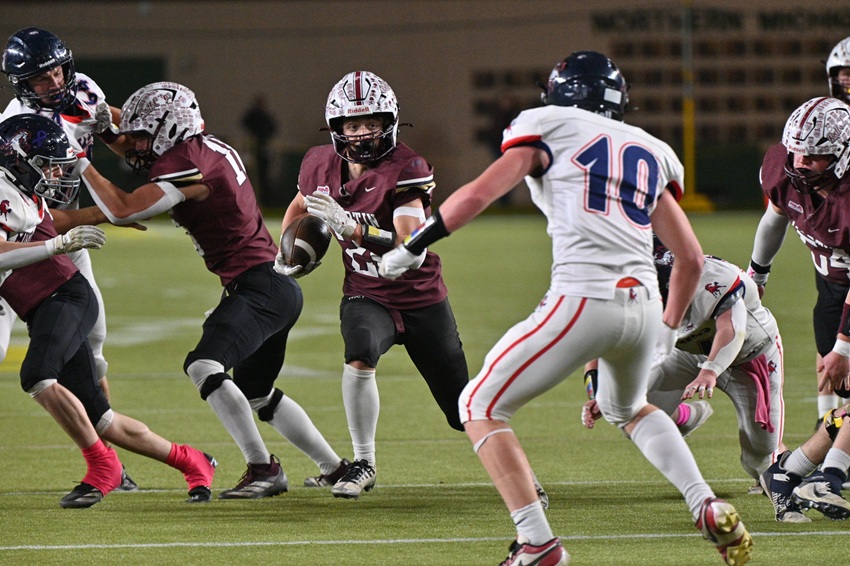
8-Player Division 1: Martin 52, Blanchard Montabella 8 - Read
Hudson claimed its third Division 1 title in four seasons with a dominating performance, as Montabella scored the game’s first points but were held off the board the rest of the way. Quarterback Haylen Buell ran for 179 yards and three touchdowns on only nine carries, and completed all seven of his passes – including one for another score – for the undefeated Clippers.
8-Player Division 2: Portland St. Patrick 53, Felch North Dickinson 0 – Read
The Shamrocks seemed to set the tone on the opening kickoff – returning it to North Dickinson’s 3-yard line – on the way to winning their first 8-player championship and first in either football format since 1992. St. Patrick led 20-0 after just seven minutes and 33-0 at halftime, with seven players reaching the end zone at least once by the end of the contest.
Record Report
Detroit Catholic Central and Jackson Lumen Christi moved into a first-place tie with Farmington Hills Harrison for 11-Player Finals appearances as all three have played in 18. (Harrison closed in June 2019).
DeWitt senior Traverse Moore earned seven 11-Player Finals record book listings, his most notable for an all-time best 397 yards rushing – which broke Kadale Williams of Lumen Christi’s record of 314 set just last season. Moore also set records with three touchdown runs during the first quarter, and his 461 total yards (including 64 passing) are the second-most in Finals history. He made four more lists as well, including for 24 points scored.
Mount Pleasant quarterback Xavier Creguer also set a record during the Division 3 game, his 91-yard scoring run the longest rush in 11-player championship game history.
Three kickers made the 11-player single-game extra points list with six apiece – Orchard Lake St. Mary’s Beckett Keifer in Division 2, DeWitt’s Vincent Rose in Division 3 and Grand Rapids West Catholic’s Landon Smith in Division 5
A trio of quarterbacks also made 11-player record lists. Orchard Lake St. Mary’s Jabin Gonzales did so with 304 yards passing, his four touchdown tosses, and 406 total yards (including 102 rushing); the total yards rank eighth all-time. Detroit Cass Tech’s Donald Tabron II made passing lists with 25 completions, 37 attempts and 285 yards, and Dearborn Divine Child quarterback Drew Sheridan also made the completions list with 19. Tabron’s attempts rank eighth, and his completions tied for fourth on that list.
On the receiving end of some fine quarterback play, Cass Tech’s Corey Sadler Jr. made the 11-player single-game receptions list with 11, tying for third-most catches, while Grand Rapids West Catholic’s Thomas Puksta made the single-game receiving yardage list with 161 and Detroit Catholic Central’s Gideon Gash tied for the second-most touchdown receptions with three.
Dexter’s Cole Novara rewrote the season receiving records this fall, and added an 11-player championship game listing with a 96-yard kickoff return touchdown. St. Mary’s Daniel Taylor Jr. also made a return list, bringing back a fumble 59 yards for a score.
DeWitt with 54 points made the 11-player team single-game scoring list, but that was just the start. The Panthers’ 575 rushing yards and 639 total yards were records, their seven rushing touchdowns tied another one, their 24 first downs made a record list and their combined 959 total yards with Mount Pleasant made the total offense list for both teams in one game.
Orchard Lake St. Mary’s also made the 11-player scoring list with 51 points, and earned another entry with 314 passing yards. Dexter made the single-game completions list in that game with 24, and Detroit Cass Tech made that same list with 25 completions. Hudsonville Unity Christian made the single-game rushing carries list with 66.
Grand Rapids West Catholic tied the Finals record with two other teams by returning two interceptions for touchdowns.
Hudson made the list of teams that did not punt in a Final, and also joined Harbor Beach – which punted once – on the list for fewest punts by both teams combined in one game.
Martin quarterback Haylen Buell made the 8-player total yardage list with 313 in the Division 1 game, leading a Clippers attack that also made the single-quarter points list with 30, single-Final rushing list with 364 yards and rushing touchdown list with six.
Portland St. Patrick quarterback Jerryd Scheurer made the list for fastest touchdowns to begin an 8-Player Final, scoring on a run just 20 seconds into his team’s Division 2 win against Felch North Dickinson. St. Patrick also made the single-game touchdowns list with seven.
Stories Behind the Scores
Single Wing, Several Records: We detailed above most of how DeWitt ran its way into the Finals record book, but the Panthers’ strategy this season deserves more credit for its brilliance. Recognizing his team’s strength on the offensive line and depth of dynamic ball carriers, DeWitt coach Rob Zimmerman leaned heavily on single wing concepts that saw direct snaps to Traverse Moore – technically his quarterback – who then ran behind multiple blockers or worked through counters and other slights of hand that opened up multiple running lanes on just about every play. The Panthers have added several record book entries over the last 25 years thanks to a high-scoring spread passing attack, but they followed last season’s 702 points (ranking eighth all-time before this fall) with 727 this season that will ran fifth on the single-season scoring list. Moore finished with 2,512 yards and 33 touchdowns rushing, and it will be interesting to see if other programs follow suit by incorporating single-wing looks.
Memorable Menominee: The Maroons were once known as one of the last teams to run the single wing, and although they’ve added different looks and more balance under fourth-year coach Chad Brandt, that tough-running, physical culture lives on – and played a big part in Menominee’s perfect season and first Finals championship since 2007. The Maroons just missed winning the Division 7 title in 2023, losing to Jackson Lumen Christi 34-30, but came through this time to claim the Upper Peninsula’s first 11-player championship since 2015. This season, only 16 UP teams played 11-player, while 19 played 8-player.
Watch List: A total of 44,733 fans attended the 11 or 8-Player Finals this season, the highest combined total for the three days since 2019 and despite a snowstorm that blanketed much of the Lower Peninsula over the 11-player weekend. A notable crowd of fans also watched online; although this was the first year the 11-Player Finals were streamed only, on the NFHS Network, we know that the Division 1 championship game drew the fourth-most viewers all-time of any event from any state broadcast on the Network, and that they watched the game for the most minutes ever for a Network broadcast.
MHSAA.com's weekly “1st & Goal” previews and reviews are powered by MI Student Aid, a division within the Department of Lifelong Education, Advancement, and Potential (MiLEAP). MI Student Aid encourages students to pursue postsecondary education by providing access to student financial resources and information. MI Student Aid administers the state’s scholarship and grant programs that help make college Accessible, Affordable and Attainable for you. Click to connect with MI Student Aid and find more information on Facebook and Twitter @mistudentaid.
PHOTOS (Top) This collage shows action photos from all 10 MHSAA Finals played this season. (2) Orchard Lake St. Mary’s Kareem Pruit (7) brings down Dexter quarterback Cooper Arnedt in 11-player Division 2. (3) Kingsley’s Nolan Hodges (28) wraps up Lumen Christi’s Ayden Gatewood in Division 6. (4) Martin’s Seth Toris (24) charges through a hole with Montabella’s Noah Carlson lining up to attempt a tackle in 8-player Division 1.