

Inside Selection Sunday: Mapnalysis '16
October 24, 2016
By Geoff Kimmerly
Second Half editor
There was a wheel and something that looked like a magic wand. Another started out looking like the head of a caterpillar.
 A number of Michigan football teams realized their sky-high dreams with Sunday’s playoff selection announcement on Fox Sports Detroit.
But earlier that day, as is the case at the end of each fall, shaping this season’s tournament at times looked a little like finding pictures in the clouds.
Beginning last night and into this morning, MHSAA staff have been busily gathering game days and times for this weekend’s opening round. We’re assigning officials for those contests. Schools are preparing for what likely will be one of their biggest crowds of the season. And, of course, teams are preparing for what surely will be one of their most memorable games.
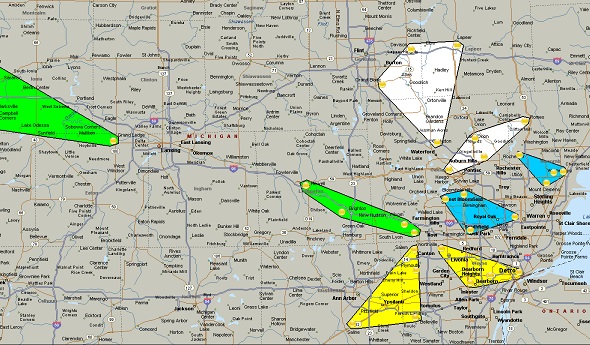
But before all of that could begin, we met Sunday morning with nine maps of Michigan and 272 dots that needed to be organized to set another playoffs in motion.
As we’ve done the past five seasons, we’ll explain our most difficult decisions in this Mapnalysis 2016 breakdown of how we paired 272 teams that will play next month for championships across nine divisions. For those familiar with our playoff selection process, or who have read this report in the past and don’t want a refresher on how we do what we do, skip the next section and go directly to the “Observations & Answers: 2016.” For the rest, what follows is an explanation of how we selected the playoff pairings during the morning hours Sunday, followed by how we made some of the toughest decisions and a few thoughts on the breakdown of the field.
Ground Rules
Our past: The MHSAA 11-player playoff structure – with 256 teams in eight divisions, and six wins equaling an automatic berth (or five wins for teams playing eight or fewer games) – debuted in 1999. An 8-player tournament was added in 2011, resulting in nine champions total each season.
The first playoffs were conducted in 1975 with four champions. Four more football classes were added in 1990 for a total of eight champions each fall. Through 1998, only 128 teams made the postseason, based on their playoff point averages within regions (four for each class) that were drawn before the beginning of the season. The drawing of Districts and Regionals after the end of the regular season did not begin until the most recent playoff expansion.
In early years of the current process, lines were drawn by hand. Dots representing qualifying schools were pasted on maps, one map for each division, and those maps were then covered by plastic sheets. Districts and Regionals literally were drawn with dry-erase markers.
Our present: After a late Saturday night tracking scores, we file in as the sun rises Sunday morning for a final round of gathering results we may still need (which can include making a few early a.m. calls to athletic directors). Re-checking and triple-checking of enrollments, what schools played in co-ops and opted to play as a higher class start a week in advance, and more numbers are crunched Sunday morning as the fields are set.
This season, there were 218 automatic qualifiers by win total – only two more than the record low set a year ago – with the final 38 at-large qualifiers then selected, by playoff-point average, one from each class in order (A, B, C, D) until the field was filled. For the second consecutive season there were only four Class D additional qualifiers with 5-4 or 4-4 (playing eight games) records from which we could choose – so after those four we added 12 teams from Class A and 11 each from Class B and Class C.
Those 256 11-player teams are then split into eight equal divisions based on enrollment, and their locations are marked on digital maps that are projected on wall-size screens and then discussed by nearly half of the MHSAA staff plus a representative from the Michigan High School Football Coaches Association. Only the locations themselves are marked (by yellow dots) – not records, playoff point averages or names of the schools or towns. In fact, mentions of those are strictly prohibited. Records and playoff points are not part of the criteria. Matchups, rivalries, previous playoff pairings, etc. also DO NOT come into play.
The same process is followed for organizing the 8-player bracket, with the difference that the 16 teams are selected purely on playoff-point average.
Geography rules: This long has been rule number one for drawing MHSAA brackets in any sport. Travel distance and ease DO come into play. Jumping on a major highway clearly is easier than driving across county-wide back roads, and that’s taken into consideration. Also, remember there’s only one Mackinac Bridge and hence only one way to cross between peninsulas – and boats are not considered a possible form of transportation. When opponents from both peninsulas will be in the same District, distance to the bridge is far more important than as the bird flies.
Tradition doesn’t reign: Every group of 32 dots is a new group – these 32 teams have not been placed in a bracket together before. How maps have been drawn in the past isn’t considered – it’s hard to say a division has been drawn in a certain way traditionally when this set of 32 teams is making up a division for the first time.
Observations & Answers: 2016
First things, first: Congratulations to five first-time playoff qualifiers – Bloomfield Hills, Detroit Delta Prep, Southfield Arts & Technology, Southfield Bradford and Wyoming Tri-unity Christian. Bloomfield Hills (Lahser and Andover) and Southfield Arts & Technology (Southfield and Southfield-Lathrup) were created by mergers of previous schools. Southfield A&T and Detroit Delta Prep are eligible for tournament play this season for the first time. Bradford and Tri-unity Christian both started programs during the latter half of the 2000s; Tri-unity qualified in 8-player after moving back to that format from 11-player this fall. Of 617 varsity football programs that played games this season (including five not eligible for the playoffs as either a first-year program or with an enrollment too high for 8-player), all but 18 have made the playoffs at least once going back to the first series in 1975.
Tie it up: We had a few ties in a few ways this season. In two situations, we had multiple teams with the same enrollment at a line between divisions. In those cases, the teams with the higher playoff point averages go to the larger divisions – so Ferndale went to Division 2 and East Lansing to Division 3 to settle one tie, and Lansing Sexton went to Division 4 and Dowagiac to Division 5 to settle the other. The additional tie came in 8-player football, with Portland St. Patrick and Wyoming Tri-unity Christian both having the same playoff point average, the same opponents’ winning percentage and drawn into the same District. A coin flip was used to determine St. Patrick as the top seed and home team both this week and next if it advances and plays the Defenders.
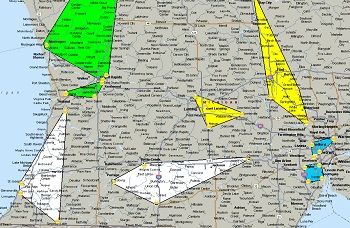 Local really is the rule: Division 3 provided us with a fine example to help show that we work to draw maps locally and beginning with the earliest rounds. There were at least three ways to separate the schools in Region 3 District 1: East Lansing, DeWitt, Fowlerville and Mason. DeWitt, as the westernmost of the group, could’ve been drawn southwest with R2D2’s Vicksburg, Battle Creek Harper Creek and Coldwater, replacing Chelsea. Doing so would’ve literally split the state’s regions down the middle along U.S. 127, which is a favorable picture. But protocol is to favor local matchups at the earliest rounds, and it just didn’t make sense to take DeWitt away from three schools mere minutes away when subbing it in for Chelsea would’ve created a wash in terms of travel for the other three teams in R2D2.
Sometimes, there’s no choice: But keeping a group of four local teams together often is impossible. Remember, 32 dots usually are spread out at least all over the Lower Peninsula. In Division 4, we had Grand Rapids Catholic Central, Wyoming Godwin Heights, Wyoming Kelloggsville and Grand Rapids South Christian stacked nicely along U.S. 131 – but had to send southernmost South Christian down with Benton Harbor, Three Rivers and Hudsonville Unity Christian because there was no other grouping for Allendale, which is about 20 miles west of Grand Rapids. Another incident of splitting up near-neighbors happened in Division 2; we had Lowell and Grand Rapids Forest Hills Central next door to each other, but no other Grand Rapids area teams qualify. By only a few miles, Forest Hills Central is south of Lowell – so although the Rangers had shorter drives than Lowell to possible opponents both north and south, they went into a group with Portage Northern, Portage Central and Battle Creek Lakeview, and Lowell went north to join Greenville, Traverse City West and Traverse City Central.
Why coast to coast: It wasn’t lost on the committee that teams waking up looking at Lake Huron traveling to play on Lake Michigan isn’t the greatest scenario. But it was the best of the options, and we stayed consistent by setting up a possible two District trips across the Lower Peninsula. Tawas will journey to Maple City Glen Lake in Division 6 this week. With wins this week, Lincoln Alcona could end up heading to Frankfort for a Division 8 District Final. Those trips aren’t ideal, but they did allow us to keep northern Lower Peninsula teams together – and in reality, aren’t too different than when teams from the Lower Peninsula and Upper Peninsula match up the first week, as will be the case in Division 4 (Whitehall to Escanaba), Division 5 (Kalkaska to Menominee and Grayling to Kingsford), Division 6 (Charlevoix to Negaunee and Boyne City to Calumet) and Division 8 (Gaylord St. Mary to Newberry).
It’s just the math: The one unexpected oddity of this week’s matchups is Canton going back to Northville for the second week in a row, and after beating Northville 42-27 last week. But math does rule, and Northville does have a higher playoff point average despite that Week 9 loss; the Mustangs beat five teams that finished with winning records, while Canton beat three – which of course is no fault of the Chiefs. It's just the way – rarely – things work out.
At the end of the day …
In six years of being part of these discussions, this weekend’s at least seemed to be the most extensive. We had two and three versions of multiple divisions before deciding which we believed to be the best.
Only one division map – 8-player – was an absolute slam dunk. The rest received plenty of scrutiny from a committee that now includes veterans going back to the beginning but also has had some new eyes join in over the last couple of years. That variety of viewpoints certainly pays off.
And wow, did we fall into some incredible first-week matchups:
• Rockford and Hudsonville in a rematch of the Ottawa-Kent Conference Red-deciding game of Week 9 (a Hudsonville 14-7 win).
• Traverse City West vs. Traverse City Central for the first time in playoff history (Central won 10-8 in Week 3).
• Bloomfield Hills Cranbrook Kingswood at Detroit Country Day in a homecoming for longtime Yellowjackets coach Joe D’Angelo.
• Constantine at Schoolcraft in a matchup of longtime southwestern rivals (Schoolcraft won 20-10 in Week 8).
• Cedarville at Engadine in arguably the most intriguing of three all-U.P. 8-player matchups (Engadine won 52-42 in Week 7).
Truly, at the end of November, the best teams will have to beat the rest to finish as champions – regardless of maps, matchups, weather and anything else that won’t really factor into what eventually is settled on the field.
For many high school sports fans, it’s the favorite time of year. Join us now as we prepare for kickoff.
The MHSAA Football Playoffs are sponsored by the Michigan National Guard.
PHOTOS: (Top) The Division 1 bracket mapped out on the Lower Peninsula. (Middle) The Division 3 map keeps four mid-Michigan teams together.
Week 9 Football Playoff Listing
October 22, 2013
By Geoff Kimmerly
Second Half editor
Here is a list of Michigan High School Athletic Association football playing schools, displaying their win-loss records and playoff averages through the eighth week of the season. Schools on this list are in enrollment order. An asterisk (*) beside a record indicates that a team has eight or fewer games scheduled. A caret (^) beside a school’s name indicates that a team is one win away from playoff qualification.
Those schools with 11-player teams with six or more wins playing nine-game schedules, or five or more wins playing eight games or fewer, will qualify for the MHSAA Football Playoffs beginning Nov. 1-2. Schools with 5-4, 4-3 or 4-4 records may qualify if the number of potential qualifiers by win total does not reach the 256 mark. Schools with six or more wins playing nine-game schedules or five or more wins playing eight games or fewer may be subtracted from the field based on playoff average if the number of potential qualifiers exceeds the 256 mark.
Once the 256 qualifying schools are determined, they will be divided by enrollment groups into eight equal divisions of 32 schools, and then drawn into regions of eight teams each and districts of four teams each.
Those schools with 8-player teams will be ranked by playoff average at season’s end, and the top 16 programs will be drawn into regions of eight teams each for the playoff in that division, which also begins Nov. 1-2.
To review a list of all football playoff schools, individual school playoff point details and to report errors, visit the Football page of the MHSAA Website.
The announcement of the qualifiers and first-round pairings for both the 11 and 8-player playoffs will take place on Oct. 27 on the Selection Sunday Show at 7 p.m. on FOX Sports Detroit. The playoff qualifiers and pairings will be posted to the MHSAA Website following the Selection Sunday Show.
--------------------------------------------------------------------------------------------------------------------
11-Player Playoff Listing
1. Sterling Heights Stevenson, 2781, 4-4, 51.500
2. Utica Eisenhower, 2772, 4-4, 53.750
3. Clarkston, 2737, 7-1, 95.500
4. Macomb Dakota, 2693, 8-0, 108.000
5. Howell ^, 2672, 5-3, 64.625
6. Grand Blanc, 2624, 6-2, 81.625
7. East Kentwood ^, 2612, 5-3, 66.750
8. Rockford, 2572, 7-1, 92.750
9. Clinton Township Chippewa Valley, 2506, 7-1, 95.875
10. Lake Orion, 2490, 6-2, 78.375
11. Dearborn Fordson ^, 2309, 5-3, 68.589
12. Holland West Ottawa ^, 2293, 5-3, 66.000
13. Northville, 2275, 7-1, 97.250
14. Detroit Cass Tech, 2262, 8-0, 107.000
15. Brighton ^, 2164, 5-3, 69.000
16. Monroe ^, 2145, 5-3, 62.500
17. Detroit Catholic Central, 2132, 7-1, 94.161
18. Plymouth ^, 2126, 5-3, 61.625
19. Canton, 2078, 7-1, 95.750
20. Novi, 1986, 4-4, 52.375
21. Livonia Stevenson, 1983, 4-4, 49.000
22. Macomb L'Anse Creuse North, 1965, 7-1, 89.500
23. West Bloomfield ^, 1941, 5-3, 63.750
24. New Baltimore Anchor Bay, 1899, 4-4, 48.875
25. Saline, 1897, 7-1, 94.275
26. Westland John Glenn ^, 1880, 5-3, 61.375
27. Holt, 1866, 4-4, 53.250
28. Warren Mott, 1796, 8-0, 99.000
29. Romeo, 1793, 4-4, 54.750
30. Oxford, 1782, 4-4, 51.625
31. Rochester Hills Stoney Creek, 1759, 6-2, 79.250
32. Hudsonville ^, 1736, 5-3, 70.875
33. Ann Arbor Skyline, 1715, 4-4, 49.250
34. Grand Ledge, 1715, 4-4, 51.250
35. Belleville ^, 1714, 5-3, 64.750
36. Davison, 1692, 4-4, 44.250
37. Walled Lake Northern, 1688, 6-2, 80.125
38. Traverse City West ^, 1653, 5-3, 66.500
39. Rochester, 1615, 4-4, 52.125
40. Waterford Kettering ^, 1604, 5-3, 66.125
41. Temperance Bedford, 1600, 8-0, 114.000
42. Grosse Pointe South ^, 1598, 5-3, 62.500
43. Rochester Adams ^, 1582, 5-3, 67.000
44. Saginaw Heritage ^, 1575, 5-3, 60.250
45. Warren DeLaSalle ^, 1564, 5-3, 74.500
46. Walled Lake Western, 1556, 8-0, 108.000
47. Flint Carman-Ainsworth, 1488, 7-1, 86.875
48. Detroit U-D Jesuit, 1476, 4-4, 55.500
49. Midland, 1462, 7-1, 90.750
50. Ypsilanti Lincoln, 1460, 7-1, 85.875
51. Pinckney ^, 1452, 5-3, 65.625
52. Traverse City Central ^, 1448, 5-3, 60.571
53. Oak Park ^, 1438, 5-3, 64.875
54. Detroit Martin Luther King *, 1432, 7-0, 103.571
55. Royal Oak, 1414, 4-4, 47.625
56. Southgate Anderson, 1409, 4-4, 48.500
57. Ypsilanti Community, 1399, 4-4, 45.000
58. Port Huron ^, 1398, 5-3, 63.107
59. Wyandotte Roosevelt, 1373, 8-0, 110.000
60. Portage Central, 1372, 8-0, 108.000
61. Lansing Everett ^, 1369, 5-3, 58.625
62. Portage Northern, 1364, 6-2, 74.625
63. Garden City, 1362, 4-4, 47.125
64. Southfield, 1356, 7-1, 95.875
65. North Farmington *, 1352, 5-3, 56.286
66. Caledonia ^, 1350, 5-3, 60.000
67. Battle Creek Lakeview, 1348, 8-0, 90.000
68. Birmingham Seaholm, 1337, 8-0, 103.000
69. Birmingham Brother Rice, 1326, 8-0, 111.200
70. Grosse Pointe North ^, 1323, 5-3, 65.375
71. Muskegon Mona Shores, 1314, 6-2, 79.500
72. Midland Dow, 1304, 7-1, 85.036
73. Farmington Hills Harrison, 1300, 7-1, 93.750
74. South Lyon, 1277, 6-2, 82.250
75. Swartz Creek, 1277, 4-4, 52.768
76. Birmingham Groves, 1274, 7-1, 85.875
77. Grand Rapids Ottawa Hills ^, 1231, 5-3, 52.500
78. Fenton, 1188, 8-0, 101.000
79. Grand Rapids Northview, 1182, 4-4, 49.750
80. Mattawan, 1176, 4-4, 45.625
81. Warren Woods Tower, 1170, 6-2, 62.750
82. Muskegon Reeths-Puffer, 1151, 7-1, 92.500
83. Lowell, 1146, 8-0, 118.000
84. Taylor Truman, 1131, 6-2, 74.500
85. East Lansing, 1124, 4-4, 52.750
86. Holly, 1124, 4-4, 49.375
87. Muskegon, 1118, 7-1, 97.875
88. Lapeer East, 1113, 4-4, 50.625
89. Marquette *, 1110, 5-2, 73.286
90. Detroit East English ^, 1109, 5-3, 59.750
91. Detroit Cody ^, 1106, 5-3, 57.250
92. Allen Park, 1103, 6-2, 76.625
93. Detroit Renaissance ^, 1097, 5-3, 53.268
94. Detroit Mumford, 1090, 6-2, 72.732
95. Grand Rapids Forest Hills Northern, 1079, 6-2, 71.250
96. St. Johns, 1079, 4-4, 47.625
97. Zeeland East ^, 1071, 5-3, 67.125
98. Lapeer West, 1063, 7-1, 91.375
99. Redford Thurston ^, 1063, 5-3, 65.375
100. Auburn Hills Avondale, 1055, 4-4, 42.375
101. Byron Center, 1039, 6-2, 68.750
102. Mt. Pleasant, 1033, 7-1, 92.875
103. Riverview, 993, 6-2, 66.625
104. St. Joseph, 986, 7-1, 88.875
105. Orchard Lake St. Mary's, 980, 4-4, 54.625
106. Petoskey ^, 965, 5-3, 62.000 &a