

Inside Selection Sunday: Mapnalysis '17
October 22, 2017
By Geoff Kimmerly
Special for Second Half
We haven’t had Michigan high school football teams travel by boat to their playoff games, nor fly like the birds over places like Saginaw Bay and the northern stretch of Lake Michigan.
 But phrases like “use the lake” and “follow the highway” dominated this year’s playoff mapping process, which once again saw members of the MHSAA staff and representatives of the Michigan High School Football Coaches Association draw into Districts and Regionals nearly 300 dots for our 10-division tournament that kicks off this weekend.
At the end of Saturday – around 9:48 p.m., to be nearly exact – there were 223 automatic qualifiers for the 256-team 11-player tournament, plus 32 for 8-player. By midnight, we had our entire playoff field more or less figured. Sunday at the MHSAA started before sunrise with double, triple and quadruple-checking, before a committee of 12 met to draw the tournament, go over all of each other’s work again, and then get everything ready to be presented online at MHSAA.com and broadcast across the state Sunday night on FOX Sports Detroit.
So much more than that goes into the football playoffs, of course. Athletic directors are scheduling games years in advance, and we start loading schedules into our system in late April. We monitor every game played every week by 614 Michigan varsity teams, plus this season 48 of our schools’ non-Michigan opponents located in five states and Ontario. Now we’re on to lining up everything that will come with the next five weeks of games including assigning officials, gathering potential Semifinal hosts and continuing our work with Northern Michigan University and Ford Field’s staffs to prepare for the 8 and 11-player Finals.
But we’re also the first to say that all of that is background noise to what we all look forward to most – five weeks of the best games our state has to offer again this fall.
As we’ve done the past six seasons, we’re explaining below our most difficult decisions in placing 288 playoff qualifiers in this Mapnalysis 2017 breakdown. For those familiar with our playoff selection process, or who have read this report in the past and don’t want a refresher on how we do what we do, skip the next section and go directly to the “Observations & Answers: 2017.” For the rest, what follows is an explanation of how we selected the playoff pairings during the morning hours Sunday, followed by how we made some of the toughest decisions plus a few thoughts on the breakdown of the field. Go to this page on MHSAA.com to see the pairings in full.
Ground Rules
Our past: The MHSAA 11-player playoff structure – with 256 teams in eight divisions, and six wins equaling an automatic berth (or five wins for teams playing eight or fewer games) – debuted in 1999. An 8-player tournament was added in 2011, resulting in nine champions total each season. This fall, a second division of 8-player football was introduced, and we will celebrate 10 champions for the first time.
The first playoffs were conducted in 1975 with four champions. Four more football classes were added in 1990 for a total of eight champions each fall. Through 1998, only 128 teams made the postseason, based on their playoff point averages within regions (four for each class) that were drawn before the beginning of the season. The drawing of Districts and Regionals after the end of the regular season did not begin until the most recent 11-player playoff expansion.
In early years of the current process, lines were drawn by hand. Dots representing qualifying schools were pasted on maps, one map for each division, and those maps were then covered by plastic sheets. Districts and Regionals literally were drawn with dry-erase markers.
Our present: After a late Saturday night tracking scores, we file in Sunday morning for a final round of gathering results we may still need (which can include making a few early a.m. calls to athletic directors and coaches). Re-checking and triple-checking of enrollments, what schools played in co-ops and opted to play as a higher class start a week in advance, and more numbers are crunched Sunday morning as the fields are set.
As noted above, this season there were 223 automatic qualifiers for the 11-player field by win total with the final 33 at-large qualifiers then selected, by playoff-point average, one from each class in order (A, B, C, D) until the field was filled. There were only five Class D additional qualifiers with 5-4 or 4-4 (playing eight games) records from which we could choose – so after those five we added 10 teams from Class A and nine each from Class B and Class C.
Those 256 11-player teams are then split into eight equal divisions based on enrollment, and their locations are marked on digital maps that are projected on wall-size screens and then discussed by nearly half of the MHSAA staff plus this year two representatives from the Michigan High School Football Coaches Association. Only the locations themselves are marked (by red dots) – not records, playoff point averages or names of the schools or towns. In fact, mentions of those are strictly prohibited. Records and playoff points are not part of the criteria. Matchups, rivalries, previous playoff pairings, etc. also DO NOT come into play.
The 8-player process is similar but changed this fall with the additional division. We take the top 32 teams in 8-player based on playoff point average as our field, then re-sort those 32 by enrollment – the 16 biggest make up Division 1, followed by the next 16 in Division 2. There are no automatic qualifiers by record for 8-player.
Geography rules: This long has been rule number one for drawing MHSAA brackets in any sport. Travel distance and ease DO come into play. Jumping on a major highway clearly is easier than driving across county-wide back roads, and that’s taken into consideration. Also, remember there’s only one Mackinac Bridge and hence only one way to cross between peninsulas – and boats are not considered a possible form of transportation. When opponents from both peninsulas will be in the same District, distance to the bridge is far more important than as the bird flies.
Tradition doesn’t reign: Every group of 32 dots is a new group – these 32 teams have not been placed in a bracket together before. How maps have been drawn in the past isn’t considered – it’s hard to say a division has been drawn in a certain way traditionally when this set of 32 teams is making up a division for the first time.
Observations & Answers: 2017
Let’s start with Congratulations: First to Detroit Western and St. Louis, which qualified for the MHSAA Playoffs for the first time. Then to seven more headed back for the first time in a while: Athens (first berth since 2000), Bridgeport (1999), Flat Rock (1990), Hancock (2006), Royal Oak (2006), Salem (1991) and Vermontville Maple Valley (2005). A total of 21 programs added to totals of more than 25 playoff berths, led by Beal City now with 35, Crystal Falls Forest Park and Farmington Hills Harrison with 33, Mendon with 32, Traverse City St. Francis with 31 and Frankfort with 30. Rockford earned its 23rd straight playoff berth, tying the record set by Felch North Dickinson from 1991-2013, and Menominee earned its 22nd straight to tie Traverse City St. Francis (1990-2011) for third on the list. Of our current 614 football varsities, all but 16 have made the playoffs at least once.
Break the tie: We again had to break a tie as teams that will or could meet ended up with the same playoff point averages. Ties are broken by head-to-head competition first – if the teams played each other during the regular season – followed by opponents’ winning percentage as the second criteria and then a coin flip if those two won’t do it. Cedarville will host Rudyard in an 8-player Division 1 game this week although both teams finished with the same playoff point average – Cedarville broke the tie with its 46-28 win over the Bulldogs in Week 1, which is a good thing because their opponents had matching 38-43 records this fall.
Many ways, no great way to slice it: The map in 11-player Division 2 was among our first tough challenges Sunday. Our most northern District seemed to make sense right away – keeping Traverse City West and Traverse City Central together with Midland and Midland Dow. From there, it’s not a pretty picture. We looked at three ways of splitting up the Detroit-area schools. We have five teams on the Grand Rapids/Muskegon/Kalamazoo side of the Lower Peninsula, but Lowell being eastern-most got sent to a District with three Flint-area schools. The 11-player Division 3 map provided a similar quandary – DeWitt, East Lansing and Haslett are packed nicely just north of Lansing, but an uneven seven schools on the western side of the Lower Peninsula meant DeWitt getting grouped with three closer to Grand Rapids with East Lansing and Haslett heading south to join Parma Western and Tecumseh. Bay City Central is the lone qualifier in this division from the Bay City/Saginaw/Midland area and also had to go somewhere – and in this case it made more sense to send it south along I-75 then across to Grand Rapids.
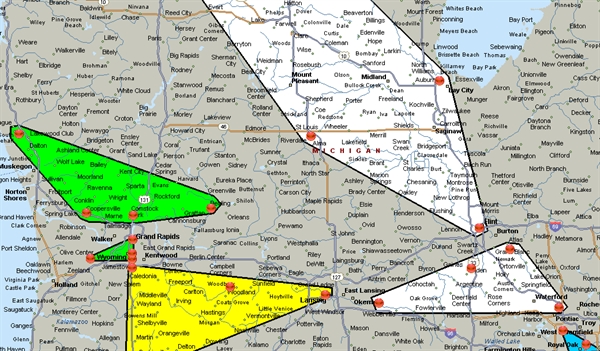
It’s a highway thing: In both Division 4 and Division 6 of 11-player, we have one Upper Peninsula school joining the rest from downstate. In Calumet’s case in Division 6, there are opponents in the northern Lower Peninsula to slot against, but Escanaba in Division 4 left us again relying on I-75. The trip from Escanaba to Flint Powers Catholic – the southernmost team in that four-team District – seems like a longer haul than sending Escanaba instead southwest to Whitehall. But a trip to Powers is estimated to be an hour shorter than from Escanaba to Whitehall, again because of the main highway.
Use the lake: At least three of our 11-player divisions – 1, 2 and 5 – have a District that rides close to the southeastern region of the Lower Peninsula up from Macomb County into Port Huron. While those thin Districts seem a little odd in shape, they make sense by normal traffic flow up from Lake St. Clair toward the Lake Huron coast. That helps explain why Port Huron Northern is with Roseville, Warren DeLaSalle and Ferndale instead of taking Lowell’s spot with Fenton, Flushing and Flint Carman-Ainsworth.
Worst map ever: At least in my seven years of being a part of the process. I’m speaking of the 11-player map in Division 8, which saw us with six Upper Peninsula schools, but then three Lower Peninsula schools grouped together just below Mackinac Bridge. One of these three had to go with another group, which is how we ended up with Frankfort joining Munising, Newberry and Gaylord St. Mary (Johannesburg-Lewiston and Hillman ended up with AuGres-Sims and Lincoln Alcona.). Then there are the pair of triangles in the southwest Lower Peninsula with Muskegon Catholic Central and Fulton-Middleton a good deal north of their District opponents, but with no other way to group those teams since the other six are all along I-94 or just south. It’s not pretty, but splitting MCC and Fulton up and sending them south was the best of the options we developed.
At the end of the day …
So here’s the fun part. We draw the maps without knowing who is where – and then we take a look at the matchups as they’re being prepared for TV and online.
It’s hard to pick out only a handful to mention at this time, but here’s one guess at a few that will create a buzz this week:
• In Division 1, Holland West Ottawa hosts Grandville after beating the Bulldogs 34-18 in Week 9 to earn an outright Ottawa-Kent Conference Red title; a Grandville win would’ve given championship shares to both and Rockford.
• Also in Division 1, Bloomfield Hills travels to West Bloomfield after beating the Lakers 28-24 in Week 2; West Bloomfield hasn’t lost again.
• In Division 3, Zeeland West and Zeeland East face off again after East downed West 28-8 on Friday to win the O-K Green championship.
• Also in Division 3, DeWitt hosts Grand Rapids Christian after rattling off eight straight wins – the Panthers’ only loss was to Christian 38-30 on opening night.
• Rivals Wyoming Kelloggsville and Godwin Heights meet in Division 4 after Kelloggsville beat Godwin by a point in Week 6 on the way to winning the O-K Silver title. Three Rivers and Vicksburg also will meet for the second straight week, this time in a Division 4 game; Vicksburg beat Three Rivers on Friday to deny the Wildcats a share of the Wolverine B Conference title. Harbor Beach claimed the Greater Thumb Conference East title by downing Ubly 26-14 in the league finale in Week 8, and they’ll meet again this week in Division 8.
• The best rivalry in 8-player last year was Powers North Central versus Crystal Falls Forest Park, and they’ll meet to start this postseason with the reigning champion Jets hitting the road looking to avenge a 66-58 loss to the Trojans in Week 2.
We know every game over the next five weeks will be memorable, at least for those on the field and the communities cheering them on. With our maps drawn, we look forward watching championship roads get blazed – and we’ll be waiting where they end at NMU and Ford Field.
The MHSAA Football Playoffs are sponsored by the Michigan National Guard.
PHOTOS: (Top) The Division 4 bracket mapped out on the Lower Peninsula shows how I-75 served as a guide for putting Escanaba in a District that includes Flint Powers Catholic.
St. Mary Erases Doubts, Ends Ithaca Run
November 28, 2014
By Bill Khan
Special for Second Half
DETROIT — The players and their coach insisted they were playing for their own glory, not to deprive Ithaca of further greatness.
Monroe St. Mary would've savored an MHSAA Division 6 football championship regardless of the opponent, regardless of the historical backdrop.
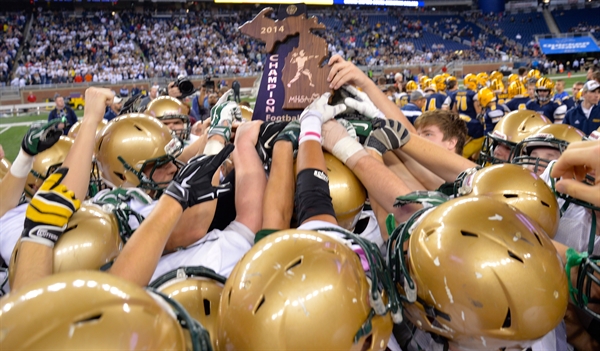
But when the clock expired on the Falcons' 22-12 victory over Ithaca on Friday at Ford Field, once they'd secured their first title since 1991, there was a little extra pride among the St. Mary players.
Yeah, it was pretty special to beat a team with a nation-leading 69-game winning streak and four consecutive Division 6 championships.
"At the beginning of the week, we didn't really think about that," St. Mary senior linebacker David Howey said. "The coach just kept preaching there's 48 minutes left in high school football. That's a pretty cool win, though, beating the nation's longest winning streak in high school football. It's pretty cool. When we told people that's who we were going to play, they'd doubt us, and that just fueled me even more."
There was also a bit of a revenge motive for St. Mary (13-1), which lost 45-35 in the Division 6 final when the Yellowjackets' string of MHSAA titles began in 2010.
"It makes it a little more sweet, but it's just awesome," said senior John Lako, who ran for two touchdowns and made seven tackles with a sack at linebacker. "I was actually at the game when we lost to them in 2010. Just to see they were that close, it feels like we finally wrote the end of the book."
Ithaca coach Terry Hessbrook hasn't had to deliver a postgame speech to his players following a loss since a 47-16 setback to Montague in a 2009 Division 6 Semifinal. From the start of 2010, the Yellowjackets assembled a winning streak that ranks 13th all-time in national high school football history. The streak included 24 consecutive playoff victories. Ithaca was trying to tie the record of five straight MHSAA titles shared by Farmington Hills Harrison (1997-2001) and East Grand Rapids (2006-10).
Ithaca had to come from behind in its previous two games just to keep the streak alive and return to Ford Field. The Yellowjackets trailed Madison Heights Madison 27-19 heading into the fourth quarter of the Regional Final before winning 41-27.
They made a stop on fourth down from the 4-yard line with 13 seconds left to preserve a 20-16 Semifinal victory over Boyne City, which took an early 14-0 lead.
"We've had maybe more talented teams, I'm going to be honest, and that's no knock on this football team," Hessbrook said. "But I've never coached a football team that has more heart and more resiliency, and that's going back to the teams we've had in the last four or five years. I don't care what team you put out there, this team will fight you every step of the way. I couldn't be more proud. We came up short. We missed a few opportunities. We came up a few plays short. One play in the kicking game, one play here or there on offense, we win that game, and we win it going away."
 Ithaca (13-1) had only three victories with a margin of fewer than 10 points during the winning streak. Missed extra points by opponents played a major role in two of those games, a 22-19 overtime victory over Montague in the 2011 Regional Final and a 21-20 victory over Montrose in a 2013 Semifinal.
Ironically, points after touchdown were critical in the outcome of Friday's championship game.
Monroe St. Mary's edge in conversions began following the first touchdown of the game, a 2-yard run by Lako that capped an opening drive that milked the first 8:15 off the clock. An off-sides penalty by Ithaca on the extra point attempt moved the ball close enough to the goal line to make a two-point attempt more feasible. Justin Carrabino ran untouched around the right side to give St. Mary's an 8-0 lead.
Ithaca tried to make up the difference following its first touchdown, an 11-yard pass from Jake Smith to Spence DeMull with 9:20 left in the second quarter, but the two-point pass fell incomplete to leave St. Mary's up 8-6.
Special teams loomed even larger with 7:11 left in the second quarter when Troy Hilkens forced a fumbled punt return. The ball popped up to Travis Vuich, who returned it 19 yards for a touchdown. Phillip Lehmann's extra point made it 15-6.
"It was a great feeling," Vuich said. "The guys did their job on the punt filling the lanes. The ball just popped right up."
Ithaca found the end zone for a second time on a 2-yard run by Smith with 33 seconds left in the first half. The extra-point attempt hit the upright, leaving the Yellowjackets down by a 15-12 margin despite matching St. Mary's two touchdowns.
"I hope that all those young people who were standing on our sideline understand what a small margin for error there is when you play for a state championship and understand how much work goes into it," Hessbrook said.
An Ithaca offense that averaged 43 points a game wouldn't score again, as St. Mary came up with huge defensive stops in the second half.
On fourth-and-one from the St. Mary 21, Ithaca was stopped in the backfield by Justin LaPlante and finished off by Darius Marks for a 1-yard loss with 2:29 left in the third quarter.
Ithaca marched to St. Mary's 19 on its next possession, but Bryce Windham (also the Falcons' quarterback) intercepted a pass after a reverse.
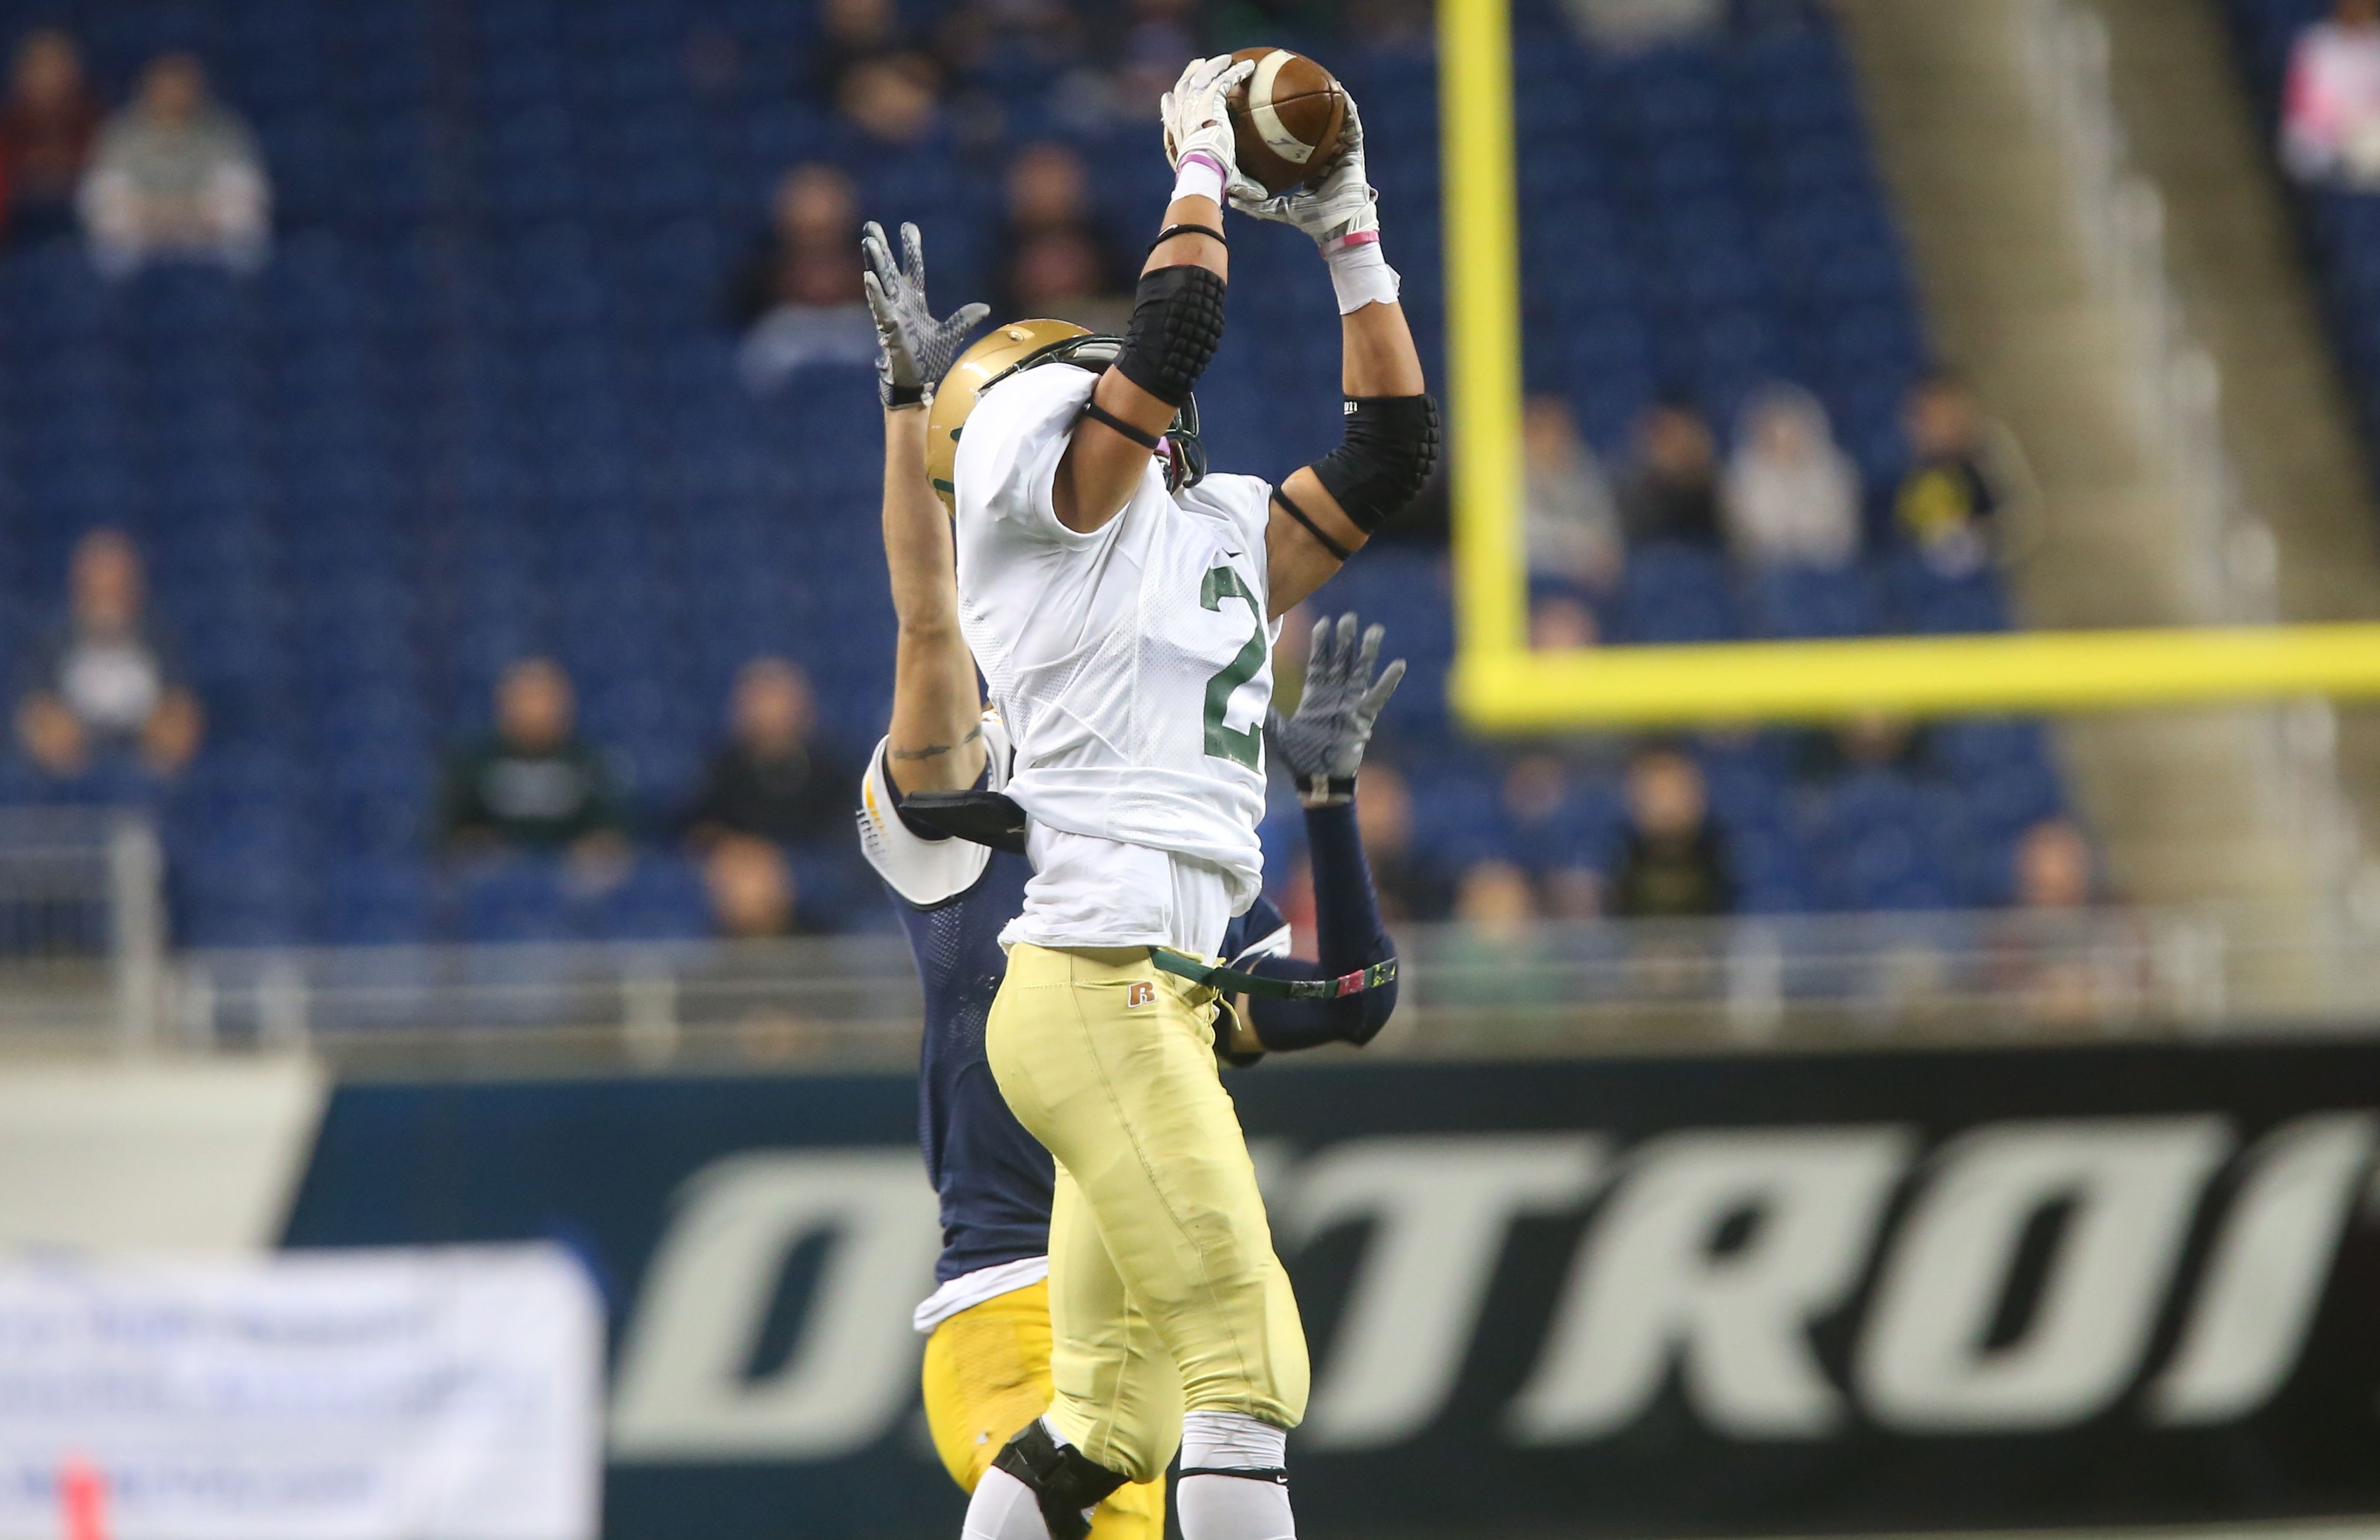
St. Mary's took over at its own 2-yard line with 10:19 remaining and was able to milk the clock down to 2:46 before punting. Ithaca got the ball at its own 20 for one final attempt to keep its winning and championship streaks alive. On second and 10, Lako sacked Smith for a 12-yard loss with 2:19 to go. On fourth-and-22, Marks intercepted a pass with 1:51 remaining and returned it to the 5.
Two plays later, Lako wrapped up the victory with a 3-yard touchdown run with 1:41 left.
Ithaca threw four incompletions on its final possession, and St. Mary kneeled out the clock.
"We won today because of our defense," St. Mary coach Jack Giarmo said. "Offensively, we struggled a little bit, but defensively the kids just did a fantastic job battling."
Ithaca outgained St. Mary, 262-182, but had three costly turnovers. Smith ran 18 times for 90 yards and a touchdown while completing 14 of 29 passes for 147 yards, one touchdown and one interception. DeMull caught nine passes for 108 yards and a touchdown.
Vuich made two clutch catches for first downs when St. Mary took 7:33 off the clock following Windham's interception. Vuich caught three passes for 38 yards, accounting for more than half of Windham's 71 yards on 7 for 12 passing.
LaPlante had nine tackles, including two for losses, to lead St. Mary's defense. Reeser had a game-high 12 tackles for Ithaca.
PHOTOS: (Top) Monroe St. Mary Catholic Central players raise their first MHSAA football championship trophy since 1991 on Friday. (Middle) St. Mary defensive back Darius Marks (2) snags an interception in front of an Ithaca receiver. (Click for action photos and team photos from Hockey Weekly Action Photos.)
VIDEO HIGHLIGHTS:
SMITH TO DEMULL FOR THE SCORE - Ithaca scores its first touchdown in the second quarter, with Jake Smith finding Spence DeMull in the end zone for the score.
FALCON FINDS GOOD FORTUNE - On its drive following the first Ithaca TD, Monroe St. Mary Catholic Central punts and a loose ball on the return finds its way into the hands of Travis Vuich, who took it 19 yards for what proved to be the winning points.
Watch the entire game and order DVDs by Clicking Here.