

Inside Selection Sunday: Mapnalysis '17
October 22, 2017
By Geoff Kimmerly
Special for Second Half
We haven’t had Michigan high school football teams travel by boat to their playoff games, nor fly like the birds over places like Saginaw Bay and the northern stretch of Lake Michigan.
 But phrases like “use the lake” and “follow the highway” dominated this year’s playoff mapping process, which once again saw members of the MHSAA staff and representatives of the Michigan High School Football Coaches Association draw into Districts and Regionals nearly 300 dots for our 10-division tournament that kicks off this weekend.
At the end of Saturday – around 9:48 p.m., to be nearly exact – there were 223 automatic qualifiers for the 256-team 11-player tournament, plus 32 for 8-player. By midnight, we had our entire playoff field more or less figured. Sunday at the MHSAA started before sunrise with double, triple and quadruple-checking, before a committee of 12 met to draw the tournament, go over all of each other’s work again, and then get everything ready to be presented online at MHSAA.com and broadcast across the state Sunday night on FOX Sports Detroit.
So much more than that goes into the football playoffs, of course. Athletic directors are scheduling games years in advance, and we start loading schedules into our system in late April. We monitor every game played every week by 614 Michigan varsity teams, plus this season 48 of our schools’ non-Michigan opponents located in five states and Ontario. Now we’re on to lining up everything that will come with the next five weeks of games including assigning officials, gathering potential Semifinal hosts and continuing our work with Northern Michigan University and Ford Field’s staffs to prepare for the 8 and 11-player Finals.
But we’re also the first to say that all of that is background noise to what we all look forward to most – five weeks of the best games our state has to offer again this fall.
As we’ve done the past six seasons, we’re explaining below our most difficult decisions in placing 288 playoff qualifiers in this Mapnalysis 2017 breakdown. For those familiar with our playoff selection process, or who have read this report in the past and don’t want a refresher on how we do what we do, skip the next section and go directly to the “Observations & Answers: 2017.” For the rest, what follows is an explanation of how we selected the playoff pairings during the morning hours Sunday, followed by how we made some of the toughest decisions plus a few thoughts on the breakdown of the field. Go to this page on MHSAA.com to see the pairings in full.
Ground Rules
Our past: The MHSAA 11-player playoff structure – with 256 teams in eight divisions, and six wins equaling an automatic berth (or five wins for teams playing eight or fewer games) – debuted in 1999. An 8-player tournament was added in 2011, resulting in nine champions total each season. This fall, a second division of 8-player football was introduced, and we will celebrate 10 champions for the first time.
The first playoffs were conducted in 1975 with four champions. Four more football classes were added in 1990 for a total of eight champions each fall. Through 1998, only 128 teams made the postseason, based on their playoff point averages within regions (four for each class) that were drawn before the beginning of the season. The drawing of Districts and Regionals after the end of the regular season did not begin until the most recent 11-player playoff expansion.
In early years of the current process, lines were drawn by hand. Dots representing qualifying schools were pasted on maps, one map for each division, and those maps were then covered by plastic sheets. Districts and Regionals literally were drawn with dry-erase markers.
Our present: After a late Saturday night tracking scores, we file in Sunday morning for a final round of gathering results we may still need (which can include making a few early a.m. calls to athletic directors and coaches). Re-checking and triple-checking of enrollments, what schools played in co-ops and opted to play as a higher class start a week in advance, and more numbers are crunched Sunday morning as the fields are set.
As noted above, this season there were 223 automatic qualifiers for the 11-player field by win total with the final 33 at-large qualifiers then selected, by playoff-point average, one from each class in order (A, B, C, D) until the field was filled. There were only five Class D additional qualifiers with 5-4 or 4-4 (playing eight games) records from which we could choose – so after those five we added 10 teams from Class A and nine each from Class B and Class C.
Those 256 11-player teams are then split into eight equal divisions based on enrollment, and their locations are marked on digital maps that are projected on wall-size screens and then discussed by nearly half of the MHSAA staff plus this year two representatives from the Michigan High School Football Coaches Association. Only the locations themselves are marked (by red dots) – not records, playoff point averages or names of the schools or towns. In fact, mentions of those are strictly prohibited. Records and playoff points are not part of the criteria. Matchups, rivalries, previous playoff pairings, etc. also DO NOT come into play.
The 8-player process is similar but changed this fall with the additional division. We take the top 32 teams in 8-player based on playoff point average as our field, then re-sort those 32 by enrollment – the 16 biggest make up Division 1, followed by the next 16 in Division 2. There are no automatic qualifiers by record for 8-player.
Geography rules: This long has been rule number one for drawing MHSAA brackets in any sport. Travel distance and ease DO come into play. Jumping on a major highway clearly is easier than driving across county-wide back roads, and that’s taken into consideration. Also, remember there’s only one Mackinac Bridge and hence only one way to cross between peninsulas – and boats are not considered a possible form of transportation. When opponents from both peninsulas will be in the same District, distance to the bridge is far more important than as the bird flies.
Tradition doesn’t reign: Every group of 32 dots is a new group – these 32 teams have not been placed in a bracket together before. How maps have been drawn in the past isn’t considered – it’s hard to say a division has been drawn in a certain way traditionally when this set of 32 teams is making up a division for the first time.
Observations & Answers: 2017
Let’s start with Congratulations: First to Detroit Western and St. Louis, which qualified for the MHSAA Playoffs for the first time. Then to seven more headed back for the first time in a while: Athens (first berth since 2000), Bridgeport (1999), Flat Rock (1990), Hancock (2006), Royal Oak (2006), Salem (1991) and Vermontville Maple Valley (2005). A total of 21 programs added to totals of more than 25 playoff berths, led by Beal City now with 35, Crystal Falls Forest Park and Farmington Hills Harrison with 33, Mendon with 32, Traverse City St. Francis with 31 and Frankfort with 30. Rockford earned its 23rd straight playoff berth, tying the record set by Felch North Dickinson from 1991-2013, and Menominee earned its 22nd straight to tie Traverse City St. Francis (1990-2011) for third on the list. Of our current 614 football varsities, all but 16 have made the playoffs at least once.
Break the tie: We again had to break a tie as teams that will or could meet ended up with the same playoff point averages. Ties are broken by head-to-head competition first – if the teams played each other during the regular season – followed by opponents’ winning percentage as the second criteria and then a coin flip if those two won’t do it. Cedarville will host Rudyard in an 8-player Division 1 game this week although both teams finished with the same playoff point average – Cedarville broke the tie with its 46-28 win over the Bulldogs in Week 1, which is a good thing because their opponents had matching 38-43 records this fall.
Many ways, no great way to slice it: The map in 11-player Division 2 was among our first tough challenges Sunday. Our most northern District seemed to make sense right away – keeping Traverse City West and Traverse City Central together with Midland and Midland Dow. From there, it’s not a pretty picture. We looked at three ways of splitting up the Detroit-area schools. We have five teams on the Grand Rapids/Muskegon/Kalamazoo side of the Lower Peninsula, but Lowell being eastern-most got sent to a District with three Flint-area schools. The 11-player Division 3 map provided a similar quandary – DeWitt, East Lansing and Haslett are packed nicely just north of Lansing, but an uneven seven schools on the western side of the Lower Peninsula meant DeWitt getting grouped with three closer to Grand Rapids with East Lansing and Haslett heading south to join Parma Western and Tecumseh. Bay City Central is the lone qualifier in this division from the Bay City/Saginaw/Midland area and also had to go somewhere – and in this case it made more sense to send it south along I-75 then across to Grand Rapids.
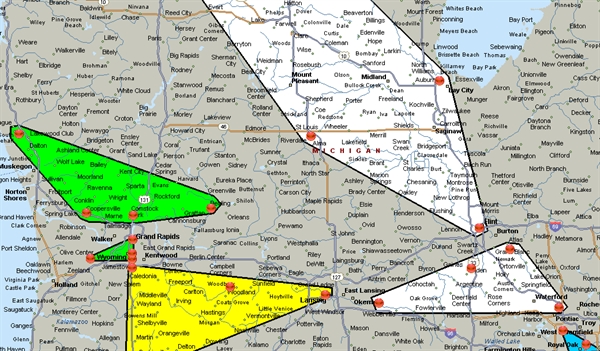
It’s a highway thing: In both Division 4 and Division 6 of 11-player, we have one Upper Peninsula school joining the rest from downstate. In Calumet’s case in Division 6, there are opponents in the northern Lower Peninsula to slot against, but Escanaba in Division 4 left us again relying on I-75. The trip from Escanaba to Flint Powers Catholic – the southernmost team in that four-team District – seems like a longer haul than sending Escanaba instead southwest to Whitehall. But a trip to Powers is estimated to be an hour shorter than from Escanaba to Whitehall, again because of the main highway.
Use the lake: At least three of our 11-player divisions – 1, 2 and 5 – have a District that rides close to the southeastern region of the Lower Peninsula up from Macomb County into Port Huron. While those thin Districts seem a little odd in shape, they make sense by normal traffic flow up from Lake St. Clair toward the Lake Huron coast. That helps explain why Port Huron Northern is with Roseville, Warren DeLaSalle and Ferndale instead of taking Lowell’s spot with Fenton, Flushing and Flint Carman-Ainsworth.
Worst map ever: At least in my seven years of being a part of the process. I’m speaking of the 11-player map in Division 8, which saw us with six Upper Peninsula schools, but then three Lower Peninsula schools grouped together just below Mackinac Bridge. One of these three had to go with another group, which is how we ended up with Frankfort joining Munising, Newberry and Gaylord St. Mary (Johannesburg-Lewiston and Hillman ended up with AuGres-Sims and Lincoln Alcona.). Then there are the pair of triangles in the southwest Lower Peninsula with Muskegon Catholic Central and Fulton-Middleton a good deal north of their District opponents, but with no other way to group those teams since the other six are all along I-94 or just south. It’s not pretty, but splitting MCC and Fulton up and sending them south was the best of the options we developed.
At the end of the day …
So here’s the fun part. We draw the maps without knowing who is where – and then we take a look at the matchups as they’re being prepared for TV and online.
It’s hard to pick out only a handful to mention at this time, but here’s one guess at a few that will create a buzz this week:
• In Division 1, Holland West Ottawa hosts Grandville after beating the Bulldogs 34-18 in Week 9 to earn an outright Ottawa-Kent Conference Red title; a Grandville win would’ve given championship shares to both and Rockford.
• Also in Division 1, Bloomfield Hills travels to West Bloomfield after beating the Lakers 28-24 in Week 2; West Bloomfield hasn’t lost again.
• In Division 3, Zeeland West and Zeeland East face off again after East downed West 28-8 on Friday to win the O-K Green championship.
• Also in Division 3, DeWitt hosts Grand Rapids Christian after rattling off eight straight wins – the Panthers’ only loss was to Christian 38-30 on opening night.
• Rivals Wyoming Kelloggsville and Godwin Heights meet in Division 4 after Kelloggsville beat Godwin by a point in Week 6 on the way to winning the O-K Silver title. Three Rivers and Vicksburg also will meet for the second straight week, this time in a Division 4 game; Vicksburg beat Three Rivers on Friday to deny the Wildcats a share of the Wolverine B Conference title. Harbor Beach claimed the Greater Thumb Conference East title by downing Ubly 26-14 in the league finale in Week 8, and they’ll meet again this week in Division 8.
• The best rivalry in 8-player last year was Powers North Central versus Crystal Falls Forest Park, and they’ll meet to start this postseason with the reigning champion Jets hitting the road looking to avenge a 66-58 loss to the Trojans in Week 2.
We know every game over the next five weeks will be memorable, at least for those on the field and the communities cheering them on. With our maps drawn, we look forward watching championship roads get blazed – and we’ll be waiting where they end at NMU and Ford Field.
The MHSAA Football Playoffs are sponsored by the Michigan National Guard.
PHOTOS: (Top) The Division 4 bracket mapped out on the Lower Peninsula shows how I-75 served as a guide for putting Escanaba in a District that includes Flint Powers Catholic.
A Game for Every Fan: 11-Player Semis
November 21, 2014
By Geoff Kimmerly
Second Half editor
This season's MHSAA football playoffs have featured their share of the unpredictable, to say the least – down to snow-driven changes we've made to the schedule as recently as Friday afternoon.
But on the field, this set of matchups as a whole could be the most competitive we've seen in some time. And we're all excited to let the games begin.
See below for brief previews of all 16 Semifinals. All are set for 1 p.m. Saturday unless noted; the only Friday game is Munising vs. Beal City at the Superior Dome.
All 16 games will be streamed live either as part of the FoxSportsDetroit.com Prep Zone or MHSAA.tv. Venue changes have led to some adjustments, so make sure to click here for up-to-date information as we receive it and links to watch.
 DIVISION 1
East Kentwood (11-1) vs. Clarkston (12-0) at Brighton High School
East Kentwood’s best season since 2002 has come down to a face-off with reigning champion Clarkston. The Falcons could work to control tempo with a rushing game averaging 235 yards per game. But they’re also giving up 204 yards rushing per game – good news for Clarkston junior running back Nolan Eriksen, who has run for 1,239 yards and 18 touchdowns, and senior quarterback D.J. Zezula (745 yards and 12 TDs rushing to go with 1,930 yards and 18 TDs passing.
Saline (11-1) vs. Detroit Cass Tech (12-0) at Troy Athens High School
Saline carries an 11-game winning streak into its first Semifinal; the Hornets’ only loss came on opening night, by three, to Division 2 semifinalist Muskegon Mona Shores. They’ve drawn tournament veteran Cass Tech, playing a Semifinal for the fifth straight season and led by arguably the best player in the state in senior running back Mike Weber. He’s committed to the University of Michigan and has run for 2,050 yards and 28 touchdowns, with 404 yards in last week’s Regional Final.
 DIVISION 2
Muskegon Mona Shores (11-1) vs. Farmington Hills Harrison (10-2) at Howell High School
Two years ago, Mona Shores had never made the playoffs. Two years later, it might be the favorite in Division 2 thanks in part to senior quarterback Tyree Jackson (2,213 yards and 23 TDs passing, 773 yards and 14 TDs rushing). Harrison is much more familiar with this stage; this is its first Semifinal since 2010, when it went on to claim the most recent of an MHSAA-best 13 football championships. Among those lining up across Jackson will be Hawks senior linebacker Michael Ojemudia, who will be key also in stopping a rushing game with more than 3,000 yards this fall.
Southfield (9-3) vs. Warren DeLaSalle (9-3) at Novi High School
Both of these are considered small surprises that have picked up big wins on the way – Southfield over Detroit Martin Luther King in their playoff opener and DeLaSalle over three-time reigning champion Birmingham Brother Rice last week. But both rosters are filled with dynamic difference-makers. Southfield senior defensive back Dior Johnson is committed to Wake Forest University, and receiver/defensive back Ray Buford is committed to Minnesota University. DeLaSalle senior defensive linemen Khary Harris (6-foot-3/234 pounds) and Mike Danna (6-3/233) key a front that is giving up a meager 73 yards rushing per game.
 DIVISION 3
Muskegon (11-1) vs. Zeeland West (12-0) at Greenville High School
Muskegon was Division 2 runner-up the last two seasons, and West is the reigning champ in Division 3. These two might be least affected by crummy weather than any others Saturday. Muskegon can ride the running of senior back Caleb Washington (1,422 yards, 14 TDs) and senior quarterback Shawn Pfenning (466/14). West has accumulated an incredible 4,870 rushing yards through its devastating T offense, led by senior Nick Jasch (1,366 yards, 25 TDs) and junior Darius Perisee (1,276/20).
Orchard Lake St. Mary's (12-2) vs. New Boston Huron (11-1) at Dearborn High School
The Eaglets are two close losses to Brother Rice from perfection and fitting their usual mold with another dominating pair of running backs, this season juniors Brandon Adams (1,251 yards, 15 TDs) and Justin Myrick (969/10), and a big-time defensive back in Michigan State University recruit Tyson Smith. Huron is a new arrival in the Semifinals but carries impressive credentials. The Chiefs’ lone loss was to Division 6 semifinalist Monroe St. Mary Catholic Central, in Week 3, and junior quarterback Matt Hartwick is a handful with 1,265 yards and 15 TDs rushing and 1,052 yards and 11 TDs passing.
 DIVISION 4
Grand Rapids South Christian (10-2) vs. Edwardsburg (11-1) at Jackson High School, 3 p.m.
The Sailors are working for a third-straight championship game appearance after winning Division 4 in 2012 and falling to Marine City in last year’s Final. They’ve been uncommonly balanced (2,482 rushing yards, 2,277 passing), as characterized by standout senior quarterback Jon Wassink (1,078 yards, 16 TDs rushing; 2,169 yards, 23 TDs passing). Edwardsburg is easier to read but no easier to stop. The Eddies have run for 4,346 yards to 683 passing, led by sophomore Isaiah Miller (1,485 yards, 22 TDs) and senior Dustin Vires (1,267/17).
Lansing Sexton (12-0) vs. Detroit Country Day (8-4) at Fenton High School
This ties the longest playoff run for Lansing Sexton, which is relying on a talented group of seniors that has carried the Big Reds to a 24-1 record over the last two seasons and just missed making last year's Final. Quarterback Malik Mack has thrown for 1,418 yards and 17 touchdowns – 11 to senior Rayshawn Wilborn – and seniors JaVon Wray and Avonte’ Bell have combined to run for 2,582 yards. Country Day made the playoffs as an at-large qualifier but is only two seasons off an MHSAA title. A player to watch is senior running back Jacob Hill, who has eight touchdowns rushing, three receiving, another on a kickoff return and one more off an interception.
 DIVISION 5
Menominee (12-0) vs. Grand Rapids West Catholic (12-0) at Northern Michigan University Superior Dome, 11 a.m
This is a rematch of last season’s championship game, a 27-14 West Catholic win. The scenario is a bit reversed this time, with West Catholic making the trip north but with an even more impressive body of work than in 2013. Senior quarterback Travis Russell is back and has thrown for 1,976 yards and 30 touchdowns and run for 1,274 yards and 20 scores. Similarly, Menominee also returns its top offensive player, senior back Justin Brilinski, who has run for 1,515 yards and 23 TDs and thrown for 1,686 yards and 18 scores.
Lansing Catholic (12-0) vs. Almont (12-0) at Brighton High School, 4:30 p.m.
This should be a battle of styles. Lansing Catholic will look to make its second championship game in four seasons keyed by the high-scoring heroics of 6-7, 230-pound junior quarterback Tony Poljan, who has thrown for 2,405 yards and 32 touchdowns and run for 871 yards and 20 scores. Almont is much more traditional offensively, eating up yards with senior running back Mike Couch (1,230 yards, 25 TDs) and junior running back Nick Baker (1,228/19). And the defense has been one of the state’s most impressive giving up only 68 points and 1,420 yards.
 DIVISION 6
Boyne City (12-0) vs. Ithaca (12-0) at Midland Community Stadium, 2 p.m.
Ithaca last week survived perhaps its greatest scare during a national-best 68-game winning streak, trailing Madison Heights Madison into the fourth quarter before scoring three times over the final seven minutes. The team has only four seniors, but as usual is led by an all-state caliber quarterback in junior Jake Smith (1,830 yards, 25 TDs passing, 1,247 yards, 17 TDs rushing). Boyne City is the next with a chance to making history by ending some, and returns to the Semifinals for the first time since another 12-0 start in 2001. The Ramblers probably won’t add to their total of six shutouts, but could slow the Yellowjackets more than most.
Grand Rapids NorthPointe Christian (11-1) vs. Monroe St. Mary Catholic Central (11-1) at Battle Creek Harper Creek High School
NorthPointe Christian has seemingly gained steam as it’s built its best season of a seven-year football history; the Mustangs have actually increased their scoring average during the playoffs four points per game to just more than 42. Senior quarterback Luke VanDyke (1,143 yards/15 TDs passing, 561/13 rushing) and senior running back Kenny Willekes (1,194 yards/15 TDs rushing) are responsible for much of that firepower. But St. Mary has eliminated two previously-undefeated teams the last two weeks and tripped up only against Lansing Catholic, in Week 9. Junior Justin Carrabino (1,268 yards, 12 TDs) is one of three backs who have run for at least 800 yards and 12 scores.
 DIVISION 7
Ishpeming (11-0) vs. Saginaw Michigan Lutheran Seminary (11-1) at the Superior Dome, 2 p.m.
The key to two-time reigning champion Ishpeming adding to its 32-game winning streak could be stopping the multiple offensive threats of Seminary, which has scored more than 400 points for the first time since 1995. Senior running back Owen Heyn is averaging 8.4 yards per carry and has run for 12 scores, and senior quarterback Nathanael Lindloff has thrown for 1,515 yards and 25 TDs – including 11 to sophomore Casey Williams, who also has run for seven, scored twice on kickoff returns, twice on punt returns and once off an interception. Junior Ozzy Corp has stepped in strongly at quarterback this season for Ishpeming after the graduation of standout Alex Briones, running for 15 touchdowns and throwing for six more through the regular season.
Pewamo-Westphalia (10-2) vs. Detroit Loyola (12-0) at Jackson High School, 11 a.m.
Loyola has fallen to Ishpeming in the last two Division 7 Finals, but appears to have taken its game to another level with no opponent getting within 28 points including previously-undefeated New Lothrop last week. Senior Marvin Campbell is the top running back again, this fall rushing for 1,639 yards and 28 touchdowns with senior Mideyin Wilson following with 925 yards and 13 scores. But P-W is not unfamiliar with this level, making its third Semifinal appearance in four seasons and with a star in the making carrying the load. Sophomore Jared Smith has run for 2,033 yards and 27 touchdowns, averaging 11 yards per carry.
 DIVISION 8
Munising (11-1) vs. Beal City (10-2) at the Superior Dome, 7 p.m. Friday
Munising passed tests against previously-undefeated St. Ignace and powerful Crystal Falls Forest Park the last two weeks, but now must defeat reigning runner-up Beal City to extend its best season since 1980. The Mustangs have the firepower with senior Garrett Blank running for 1,849 yards and 28 touchdowns and senior quarterback Austin Kelto throwing for 18 scores – with no interceptions. Beal City has advanced to the last two Division 8 Finals and is looking to return with a mostly new group, although it impressed again last week in shutting out a potent Baldwin offense.
Muskegon Catholic Central (12-0) vs. Harbor Beach (12-0) at Alma College
No one has been expected to stop reigning champion MCC this fall; a number of the biggest contributors from 2013 are leading the way again, including senior running back Tommy Scott (1,691 yards, 29 TDs rushing) and senior quarterback Nick Holt (859/15). But Harbor Beach has been considered one of the candidates to have a shot. The Pirates are back in a Semifinal for the third straight season and won the championship in 2012 before moving into Division 7 for 2013. Waterford Our Lady two weeks ago is the only opponent to score more than seven points this season, and Harbor Beach doesn’t allow many chances with seniors Austin Seltz (1,243 yards/23 TDs) and Josh Schelke (1,219/23) dominating the run game.
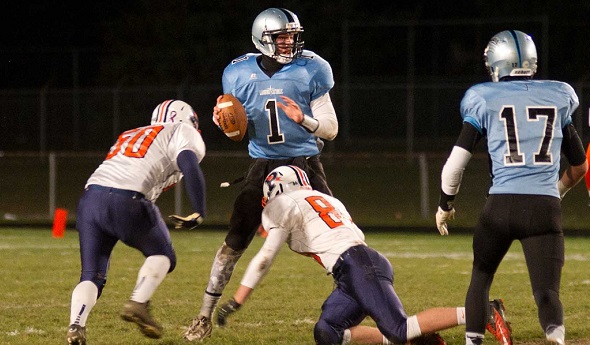
PHOTO: Lansing Catholic quarterback Tony Poljan scans the field during last week's Division 5 Regional Final win over Flint Powers Catholic. (Click to see more from HighSchoolSportsScene.com.)