

Inside Selection Sunday: Mapnalysis '19
By
Geoff Kimmerly
MHSAA.com senior editor
October 27, 2019
This will be the final MHSAA Football Playoffs under the format created in 1999, with significant changes coming beginning with the 2020 season.
But the soon-to-be old way isn’t going out without a bang.
From a record number of additional qualifiers, to a first-ever coin flip to determine the final team in the 11-player field, to a series of maps that arguably included the toughest to draw at least this decade, this year’s “Selection Sunday” was jammed with notable moments that will play out in 10 divisions over the next five weeks.
Below, we explain how we made many of the most difficult decisions – and follow with a few points of interest that immediately jump out from this season’s brackets.
This process actually begins in April, when we start collecting schedules for the upcoming season – this time for 607 teams, from which 531 ended up eligible for the 11-player playoffs and 71 were eligible in 8-player. And of course, now that the brackets are drawn the major lifting begins – assigning officials for every game, gathering potential Semifinal sites in 11-player and working with our Finals hosts to again create once-in-a-lifetime experiences (for most) when our 8-player finalists face off Nov. 23 at Northern Michigan University’s Superior Dome and our 11-player finalists play for titles Nov. 29-30 at Ford Field.
So let’s dive in. Those familiar with this “Selection Sunday” recap will recognize first a refresher on the playoff selection process, followed by “Observations & Answers: 2019.” That’s followed by thoughts after a glance at this year’s brackets, and be sure to visit MHSAA.com to see all of the pairings in full.
Ground Rules
Our past: The MHSAA 11-player playoff structure – with 256 teams in eight divisions, and six wins equaling an automatic berth (or five wins for teams playing eight or fewer games) – debuted in 1999. An 8-player tournament was added in 2011, and in 2017 a second division of 8-player football was introduced.
The first playoffs were conducted in 1975 with four champions. Four more football classes were added in 1990 for a total of eight champions each fall. Through 1998, only 128 teams made the postseason, based on their playoff point averages within regions (four for each class) that were drawn before the beginning of the season. The drawing of Districts and Regionals after the end of the regular season did not begin until the most recent 11-player playoff expansion.
In early years of the current process, lines were drawn by hand. Dots representing qualifying schools were pasted on maps, one map for each division, and those maps were then covered by plastic sheets. Districts and Regionals literally were drawn with dry-erase markers.
Our present: The last few scores of this regular season were added to MHSAA.com by 8 p.m. Saturday. Re-checking and triple-checking of enrollments, what schools played in co-ops and opted to play as a higher class start a week in advance, and more numbers are crunched Sunday morning as the fields are set.
This final season of 6-wins-and-in (or five wins playing eight games or fewer) produced 202 automatic qualifiers for the 11-player field with a record 54 additional qualifiers then selected by playoff point average – that group of additional qualifiers easily blowing past last year’s then-record total of 43. Additional qualifiers were selected from each class in order (A, B, C, D) until the field was filled. There were only two Class D additional qualifiers with 5-4 or 4-4 (playing eight games) records from which we could choose, and likewise there were 16 additional qualifiers available in Class C – so with those 18 spots filled, we added 18 teams from both Class A and B to fill out the field.
Here’s where the tie-breaker was forced into play. Among Class B teams, Durand and Imlay City tied for the 18th spot with playoff point averages of 42.667. They did not play each other during the regular season – so the first tie-breaker of head-to-head result couldn’t be used. The next tie-breaker is opponents’ winning percentage – and both teams’ opponents won 45.7 percent of their games this season. So we went to the coin flip, and Durand was awarded the final spot in the field.
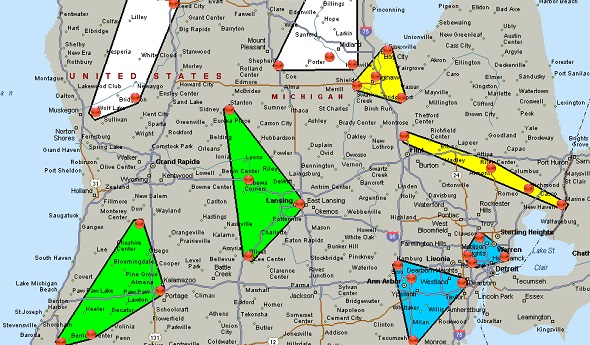
Those 256 11-player teams were then split into eight equal divisions based on enrollment, and their locations were marked on digital maps then projected on wall-size screens and discussed by nearly half of the MHSAA staff plus two representatives from the Michigan High School Football Coaches Association. Only the locations themselves were marked (by red dots) – not records, playoff point averages or names of the schools or towns. In fact, mentions of those are strictly prohibited. Records and playoff points are not part of the criteria. Matchups, rivalries, previous playoff pairings, etc. also DO NOT come into play.
The 8-player process is different for team selection and similar for designation of Regionals. We take the top 32 teams in 8-player based on playoff point average as our field, then re-sort those 32 by enrollment – the 16 biggest make up Division 1, followed by the next 16 in Division 2. There are no automatic qualifiers by record for 8-player, and those fields remain in flux right through the last Week 9 games. For example: Colon as recently as after Week 7 was slated for Division 2. But the Magi after this weekend ended up in Division 1 with the second-highest playoff-point average but the 16th-highest enrollment – meaning Colon (160 students) and Cedarville (154) were the line between Divisions 1 and 2 this year.
Our future: 11-player divisions determined in March. More bonus points awarded in losses. Read all about it: Comparison of old and new playoff formats
Geography rules: This long has been rule number one for drawing MHSAA brackets in any sport. Travel distance and ease DO come into play. Jumping on a major highway clearly is easier than driving across county-wide back roads, and that’s taken into consideration. Also, remember there’s only one Mackinac Bridge and hence only one way to cross between peninsulas – and boats are not considered a possible form of transportation. When opponents from both peninsulas will be in the same District, distance to the bridge is far more important than as the bird flies.
Tradition doesn’t reign: Every group of 32 (or in 8-player, 16) dots is a new group – these 32 teams have not been placed in a bracket together before. How maps have been drawn in the past isn’t considered – it’s hard to say a division has been drawn in a certain way traditionally when this set of 32 teams is making up a division for the first time.
Observations & Answers: 2019
We always start with CONGRATULATIONS: Detroit Leadership Academy, Detroit Communication Media Arts, and Pellston will be making their debuts in the MHSAA Playoffs this week, taking the list of teams that have never qualified for the postseason down to 11. Beal City and Crystal Falls Forest Park will make their MHSAA-best 35th playoff appearances. Five teams will be playing in at least their 17th consecutive playoffs – Rockford (25), Forest Park (23), Jackson Lumen Christi (22), Macomb Dakota (20) and Climax-Scotts (17).
Head-to-head rules: As noted above, it’s the first tie-breaker and comes into play immediately this week. In Division 3, East Lansing and DeWitt have identical playoff point averages, and East Lansing will host their first-round game thanks to a 21-2 Week 5 win. If Portland and Lansing Catholic both advance to an 11-Player Division 5 District Final, Portland will host thanks to a 21-20 Week 5 win over the Cougars. Same in 8-player Division 2, where if Powers North Central and Pickford meet in a Regional Final, the Jets will host thanks to their 20-14 win when the teams met in Week 3.
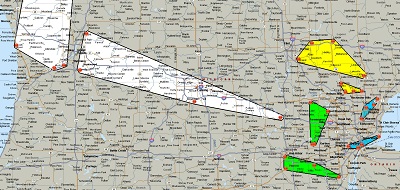 Traverse City traveling: Many years, we have to pay special consideration to ease of travel when we have one of 32 teams from a division in the Upper Peninsula. This year, we spent a lot more time discussing Traverse City schools – notably how to position Traverse City West in Division 1 and Traverse City Central in Division 2. There are three main north-south highways in the Lower Peninsula, with U.S. 131 the thoroughfare out of Traverse City. We also used it as the defining line in Division 1, with West going west with Grand Haven, Grandville and Hudsonville instead of staying with a more northern group that would’ve included Rockford and split Grandville and Hudsonville – which are six miles apart down I-196. In Division 2, we brought U.S. 127 into the mix, figuring it made more sense for travel to use that and 131 in grouping Traverse City Central with Muskegon Mona Shores, Midland and Midland Dow instead of creating a western District stretching from Traverse City to south of Kalamazoo.
Avoid the crisscross: Sometimes Districts drawn on the maps look perfect – but we run into trouble putting them together for a logical Regional. Sometimes we know eight dots should be a Regional, but there’s no reasonable way to split them into two four-team Districts. We do everything possible to keep a team from driving past a different District (or in 8-player Regional) on the way to its first or second-round game. The 8-Player Division 1 map probably looks a little odd with Deckerville possibly playing Morrice in the second round and the Orioles driving past Mayville or Kingston from another Regional to get there. However, there is a distinct northeast-to-southwest line separating those four schools – and if the Regional had been drawn to keep Deckerville with Mayville and Kingston, it would’ve meant Regional champs “jumping” over each other for their Semifinal matchup.
North/South vs. East/West: There isn’t one guiding directional when creating these Districts and Regionals. The 11-player Division 7 map has a little bit of both, with a pair of Districts along I-94 on the south side of the Lower Peninsula, but then Madison Heights Bishop Foley grouped with three Thumb-area teams for a north-south grouping. The other option was sending Bishop Foley northwest toward Flint and Lansing, but that would’ve left the Thumb schools and Beaverton maneuvering around Saginaw Bay.
At the end of the day …
Here’s my annual reminder: We draw these maps not knowing which schools are represented by the dots. The Division 5 and 6 maps were so easy to draw, I had no idea which schools were matched up until checking out the brackets hours later to put together this report.
But with all of that in front of me, here’s a glance at what jumps off the page:
• The Division 1 District made up of unbeaten Belleville and Brownstown Woodhaven, Saline (8-1) and Ann Arbor Pioneer (5-4) is obviously loaded. Belleville and Saline both made the Semifinals last season, and Saline’s only loss this fall was to reigning Division 1 champion Clinton Township Chippewa Valley. Woodhaven finished the regular season unbeaten for the second time in six years and its seeking its first District title.
• Last season’s Division 4 champion Edwardsburg has won 23 straight games and is back in the Division 3 bracket – the Eddies played in Division 4 the last two seasons and most recently in Division 3 in 2016. A possible return to Ford Field starts this week with St. Joseph and could include a trip to Zeeland West and matchup with also-unbeaten Mason.
• Hudsonville Unity Christian is another reigning champion in a new division, moving into Division 4 after winning the championship in Division 5 last fall. Unity begins with Otsego and would play either Grand Rapids Christian or South Christian with a win.
• Make way for Division 7. Unbeaten New Lothrop is the reigning champion and shares a District with undefeated Beaverton and a Regional with also-undefeated Pewamo-Westphalia. Iron Mountain, Lawton, Jackson Lumen Christi and Clinton also have yet to lose a game this season. Lumen Christi has won the last three Division 6 championships and 31 straight games.
• Math can lead to some unpredictable situations, including the occasional undefeated road team during the first round. Almont defeated Richmond 28-10 in Week 7 on the way to the Blue Water Area Conference title and a perfect regular-season record. But the Raiders will travel this week back to Richmond because the Blue Devils finished with a better playoff point average – Almont’s two nonleague opponents finished a combined 1-17, and Richmond’s both made the playoffs with a combined 13-5 record. That difference made the difference in playoff point average by about nine-tenths of a point in Richmond’s favor.
• This year’s 8-player brackets are loaded with intrigue, especially with 2018 Division 2 champion Rapid River not in the field and last year’s Division 1 runner-up Pickford in Division 2 this time. Morrice is the reigning Division 1 champion and could see undefeated Deckerville in a Regional Final. Pickford has to get through another 8-1 team in Engadine this week but could see undefeated Powers North Central in a Division 2 Regional Final.
• And it should shock no one if a team entering the playoffs 4-5 makes it to NMU. Gaylord St. Mary had to forfeit four victories but still made the playoffs with that record. Undefeated Suttons Bay is a possible Regional Final opponent, and St. Mary won their Week 6 matchup on the field 48-47 before later forfeiting that game.
That’s the start of what we’re looking forward to over the next five weeks. The steps taken today were just a few along the way as memories are made for thousands of Michigan high school football players this November.
PHOTOS: (Top) The Division 5 map, with clear-cut Districts, received quick support from the selection committee. (Middle) The Division 1 map split Grand Rapids-area teams along U.S. 131.
Week 9 Football Playoff Listing
October 22, 2013
By Geoff Kimmerly
Second Half editor
Here is a list of Michigan High School Athletic Association football playing schools, displaying their win-loss records and playoff averages through the eighth week of the season. Schools on this list are in enrollment order. An asterisk (*) beside a record indicates that a team has eight or fewer games scheduled. A caret (^) beside a school’s name indicates that a team is one win away from playoff qualification.
Those schools with 11-player teams with six or more wins playing nine-game schedules, or five or more wins playing eight games or fewer, will qualify for the MHSAA Football Playoffs beginning Nov. 1-2. Schools with 5-4, 4-3 or 4-4 records may qualify if the number of potential qualifiers by win total does not reach the 256 mark. Schools with six or more wins playing nine-game schedules or five or more wins playing eight games or fewer may be subtracted from the field based on playoff average if the number of potential qualifiers exceeds the 256 mark.
Once the 256 qualifying schools are determined, they will be divided by enrollment groups into eight equal divisions of 32 schools, and then drawn into regions of eight teams each and districts of four teams each.
Those schools with 8-player teams will be ranked by playoff average at season’s end, and the top 16 programs will be drawn into regions of eight teams each for the playoff in that division, which also begins Nov. 1-2.
To review a list of all football playoff schools, individual school playoff point details and to report errors, visit the Football page of the MHSAA Website.
The announcement of the qualifiers and first-round pairings for both the 11 and 8-player playoffs will take place on Oct. 27 on the Selection Sunday Show at 7 p.m. on FOX Sports Detroit. The playoff qualifiers and pairings will be posted to the MHSAA Website following the Selection Sunday Show.
--------------------------------------------------------------------------------------------------------------------
11-Player Playoff Listing
1. Sterling Heights Stevenson, 2781, 4-4, 51.500
2. Utica Eisenhower, 2772, 4-4, 53.750
3. Clarkston, 2737, 7-1, 95.500
4. Macomb Dakota, 2693, 8-0, 108.000
5. Howell ^, 2672, 5-3, 64.625
6. Grand Blanc, 2624, 6-2, 81.625
7. East Kentwood ^, 2612, 5-3, 66.750
8. Rockford, 2572, 7-1, 92.750
9. Clinton Township Chippewa Valley, 2506, 7-1, 95.875
10. Lake Orion, 2490, 6-2, 78.375
11. Dearborn Fordson ^, 2309, 5-3, 68.589
12. Holland West Ottawa ^, 2293, 5-3, 66.000
13. Northville, 2275, 7-1, 97.250
14. Detroit Cass Tech, 2262, 8-0, 107.000
15. Brighton ^, 2164, 5-3, 69.000
16. Monroe ^, 2145, 5-3, 62.500
17. Detroit Catholic Central, 2132, 7-1, 94.161
18. Plymouth ^, 2126, 5-3, 61.625
19. Canton, 2078, 7-1, 95.750
20. Novi, 1986, 4-4, 52.375
21. Livonia Stevenson, 1983, 4-4, 49.000
22. Macomb L'Anse Creuse North, 1965, 7-1, 89.500
23. West Bloomfield ^, 1941, 5-3, 63.750
24. New Baltimore Anchor Bay, 1899, 4-4, 48.875
25. Saline, 1897, 7-1, 94.275
26. Westland John Glenn ^, 1880, 5-3, 61.375
27. Holt, 1866, 4-4, 53.250
28. Warren Mott, 1796, 8-0, 99.000
29. Romeo, 1793, 4-4, 54.750
30. Oxford, 1782, 4-4, 51.625
31. Rochester Hills Stoney Creek, 1759, 6-2, 79.250
32. Hudsonville ^, 1736, 5-3, 70.875
33. Ann Arbor Skyline, 1715, 4-4, 49.250
34. Grand Ledge, 1715, 4-4, 51.250
35. Belleville ^, 1714, 5-3, 64.750
36. Davison, 1692, 4-4, 44.250
37. Walled Lake Northern, 1688, 6-2, 80.125
38. Traverse City West ^, 1653, 5-3, 66.500
39. Rochester, 1615, 4-4, 52.125
40. Waterford Kettering ^, 1604, 5-3, 66.125
41. Temperance Bedford, 1600, 8-0, 114.000
42. Grosse Pointe South ^, 1598, 5-3, 62.500
43. Rochester Adams ^, 1582, 5-3, 67.000
44. Saginaw Heritage ^, 1575, 5-3, 60.250
45. Warren DeLaSalle ^, 1564, 5-3, 74.500
46. Walled Lake Western, 1556, 8-0, 108.000
47. Flint Carman-Ainsworth, 1488, 7-1, 86.875
48. Detroit U-D Jesuit, 1476, 4-4, 55.500
49. Midland, 1462, 7-1, 90.750
50. Ypsilanti Lincoln, 1460, 7-1, 85.875
51. Pinckney ^, 1452, 5-3, 65.625
52. Traverse City Central ^, 1448, 5-3, 60.571
53. Oak Park ^, 1438, 5-3, 64.875
54. Detroit Martin Luther King *, 1432, 7-0, 103.571
55. Royal Oak, 1414, 4-4, 47.625
56. Southgate Anderson, 1409, 4-4, 48.500
57. Ypsilanti Community, 1399, 4-4, 45.000
58. Port Huron ^, 1398, 5-3, 63.107
59. Wyandotte Roosevelt, 1373, 8-0, 110.000
60. Portage Central, 1372, 8-0, 108.000
61. Lansing Everett ^, 1369, 5-3, 58.625
62. Portage Northern, 1364, 6-2, 74.625
63. Garden City, 1362, 4-4, 47.125
64. Southfield, 1356, 7-1, 95.875
65. North Farmington *, 1352, 5-3, 56.286
66. Caledonia ^, 1350, 5-3, 60.000
67. Battle Creek Lakeview, 1348, 8-0, 90.000
68. Birmingham Seaholm, 1337, 8-0, 103.000
69. Birmingham Brother Rice, 1326, 8-0, 111.200
70. Grosse Pointe North ^, 1323, 5-3, 65.375
71. Muskegon Mona Shores, 1314, 6-2, 79.500
72. Midland Dow, 1304, 7-1, 85.036
73. Farmington Hills Harrison, 1300, 7-1, 93.750
74. South Lyon, 1277, 6-2, 82.250
75. Swartz Creek, 1277, 4-4, 52.768
76. Birmingham Groves, 1274, 7-1, 85.875
77. Grand Rapids Ottawa Hills ^, 1231, 5-3, 52.500
78. Fenton, 1188, 8-0, 101.000
79. Grand Rapids Northview, 1182, 4-4, 49.750
80. Mattawan, 1176, 4-4, 45.625
81. Warren Woods Tower, 1170, 6-2, 62.750
82. Muskegon Reeths-Puffer, 1151, 7-1, 92.500
83. Lowell, 1146, 8-0, 118.000
84. Taylor Truman, 1131, 6-2, 74.500
85. East Lansing, 1124, 4-4, 52.750
86. Holly, 1124, 4-4, 49.375
87. Muskegon, 1118, 7-1, 97.875
88. Lapeer East, 1113, 4-4, 50.625
89. Marquette *, 1110, 5-2, 73.286
90. Detroit East English ^, 1109, 5-3, 59.750
91. Detroit Cody ^, 1106, 5-3, 57.250
92. Allen Park, 1103, 6-2, 76.625
93. Detroit Renaissance ^, 1097, 5-3, 53.268
94. Detroit Mumford, 1090, 6-2, 72.732
95. Grand Rapids Forest Hills Northern, 1079, 6-2, 71.250
96. St. Johns, 1079, 4-4, 47.625
97. Zeeland East ^, 1071, 5-3, 67.125
98. Lapeer West, 1063, 7-1, 91.375
99. Redford Thurston ^, 1063, 5-3, 65.375
100. Auburn Hills Avondale, 1055, 4-4, 42.375
101. Byron Center, 1039, 6-2, 68.750
102. Mt. Pleasant, 1033, 7-1, 92.875
103. Riverview, 993, 6-2, 66.625
104. St. Joseph, 986, 7-1, 88.875
105. Orchard Lake St. Mary's, 980, 4-4, 54.625
106. Petoskey ^, 965, 5-3, 62.000 &a