

Inside Selection Sunday: Mapnalysis 2012
October 24, 2012
By Geoff Kimmerly
Second Half editor
Between double checking data for more than a third of our 626 football teams, and creating 136 first-round games for our most popular tournament, the morning of MHSAA football "Selection Sunday" is both one of the most exciting and nerve-wracking of the school year.
So for those scratching their heads the last few days over how we picked the brackets this season, I offer one question and one warning:
How would you have done so differently?
And before you answer, remember that moving the position of one school affects at least seven more – if not all 32 in that division.
This was the second year I was involved in the football selection process, which while appearing simple on its face actually is layered with hours of discussions, calculations, checking and re-checking, and anything else we at the MHSAA can do to make sure we’ve created the best tournament possible.
Simply put, it’s more than just drawing circles and calling them good.
Below are a brief description of what we do, the history behind the process, and some challenges we face each time we draw these brackets – including some examples of our toughest this time around.
The process
Our past: The MHSAA playoff structure – with 256 teams in eight divisions, and six wins equaling an automatic berth – debuted in 1999. An 8-player tournament was added in 2011, resulting in nine champions total when November is done.
That’s a long way from our start. The first playoffs were conducted in 1975 with four champions. Four more football classes were added in 1990 for a total of eight champions each fall. Through 1998, only 128 teams made the postseason, based on their playoff point averages within regions (four for each class) that were drawn before the beginning of the season. The drawing of Districts and Regions after the end of the regular season did not begin until the most recent playoff expansion.
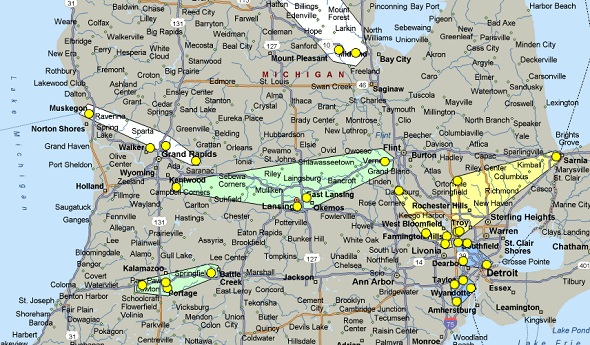
In early years of the current process (or until the middle of the last decade), lines were drawn by hand. Dots representing qualifying schools were pasted on maps, one map for each division, and those maps were then covered by plastic sheets. Districts and Regionals literally were drawn with dry-erase markers.
Our present: After a late Saturday night tracking scores, we file in as the sun rises Sunday morning for a final round of gathering results we may still need (which can include making a few early a.m. calls to athletic directors). Then comes re-checking and triple-checking of enrollments, co-ops, some records and more before the numbers are crunched and the field of 256 is set.
Those teams are then split into eight equal divisions based on enrollment, and their locations are marked on digital maps that are projected on wall-size screens and then discussed by nearly half of the MHSAA staff plus a representative from the Michigan High School Football Coaches Association. Only the locations themselves are marked (by yellow dots) – not records, playoff points averages or names of the schools or towns. In fact, mentions of those are strictly prohibited. Records and playoff points are not part of the criteria. Matchups, rivalries, previous playoff pairings, etc. also DO NOT come into play.
Geography rules: Drawing Districts and Regionals is all about location. Travel distance and ease DO come into play. Yes, ease is important. Schools near the same major highway might be further from each other in mileage than other options but have a better trip. A good example this year is in Division 6, which has seven teams in the U.P. and the northern Lower Peninsula. That meant Shelby needed to be included with those teams to make eight, and left Montague to a District that includes Hemlock – more than halfway across the Lower Peninsula. But at least, in this case, much of that trip will be on one roadway, M-46.
There is certainly conversation about every possible option. The staff splits into two groups, each handling four divisions (plus one of the groups handles 8-player too), and then the entire committee comes together to view all nine maps. There wasn’t one division where the group as a whole said, “That looks great, what’s next?”
Observations and answers
A different ballgame: I was asked whatever happened to Districts, meaning teams opening with opponents nearby. Remember that with eight divisions and 32 teams in each, the difference between maximum and minimum enrollments for each division is smaller than it used to be with just four classes, and the probability of finding two schools in the same division next door to each other is lower. This is especially true for our smaller schools, and those pairings are more spread out. Division 7 provides an excellent example. Opponents Dansville and Ottawa Lake Whiteford are 84 miles apart. But in another option considered, Dansville would’ve played Gobles – and those two are separated by 114 miles.
Points still matter: And that means strength of schedule is a big factor. After Districts are drawn, playoff point average determines the home team for those two games and Regionals as well. There are five Districts in which the team with the best or second-best record did not get home games because those teams’ playoff point averages ranked third among the four teams in those brackets. A number of other Districts have 8-1 teams playing at other 8-1 teams. It’s true: there are times a school can’t help the opponents it plays, because of league affiliation perhaps, and they have no control over how an opponent does the rest of the season. But a Class B team playing in a league with Class D schools can’t expect to compare averages well against teams in their division who face similarly-sized opponents during the regular season.
No boating: This didn’t come up last season, but did twice Sunday. We had to decide if it was a better trip for teams in the thumb to go around Saginaw Bay to play northern opponents, or instead send teams a little bit south of the thumb but with a straight shots north. As the bird flies, the thumb teams were closer in some cases. But I’ve never heard of a team hopping into a boat to get to a playoff game.
The fifth wheels: The toughest lines to draw are around areas with five schools in the same division. Remember, Districts come in fours, and one dot affects the rest. The Grand Rapids area gave us tough calls because of five teams in Divisions 2 and 4. The same was true in the southwest corner in Division 7 and the southeast corner in Division 6. No matter how we circled it, one of those teams got stuck with a longer trip. This time, that group included Caledonia, Grand Rapids South Christian, Blissfield and Gobles.
It’s easy to say certain areas of these maps should’ve been drawn differently. But again, keep in mind a statewide view.
Some of our pairings could create gigantic matchups earlier in the playoffs than those teams might like. But again, who is to decide which teams are the best and which matchups most “gigantic” before they prove it on the field? At least three teams touted during this fall as potentially the best in the state this season didn’t even win their conference titles.
And as I said in this analysis last year, determining the playoff schedule is just one step in many. Nine MHSAA champions must survive until the end, regardless of which opponents they face along the way.
Their journeys begin Friday.
2017 Week 8 Football Playoff Listing
October 10, 2017
By Geoff Kimmerly
Second Half editor
Here is a list of Michigan High School Athletic Association football playing schools, displaying their win-loss records and playoff averages through the seventh week of the season.
Schools on this list are in enrollment order for 11-player teams, with 8-player teams ordered by playoff average. An asterisk (*) beside a record indicates a team has eight or fewer games scheduled.
Those schools with 11-player teams with six or more wins playing nine-game schedules, or five or more wins playing eight games or fewer, will qualify for the MHSAA Football Playoffs beginning Oct. 27. Schools with 5-4, 4-3 or 4-4 records may qualify if the number of potential qualifiers by win total does not reach the 256 mark. Schools with six or more wins playing nine-game schedules or five or more wins playing eight games or fewer may be subtracted from the field based on playoff average if the number of potential qualifiers exceeds the 256 mark.
Once the 256 qualifying schools are determined, they will be divided by enrollment groups into eight equal divisions of 32 schools, and then drawn into regions of eight teams each and districts of four teams each. Those schools with 8-player teams will be ranked by playoff average at season’s end, and the top 32 programs will then be divided into two divisions of 16 each based on enrollment. The playoff in that division also begins Oct. 27.
To review a list of all football playoff schools, individual school playoff point details and to report errors, visit the Football page of the MHSAA Website.
The announcement of the qualifiers and first-round pairings for both the 11 and 8-player playoffs will take place at 7 p.m. Oct. 22 on the Selection Sunday Show on FOX Sports Detroit. The playoff qualifiers and pairings will be posted to the MHSAA Website following the Selection Sunday Show. The MHSAA Football Finals are presented by the Michigan Army National Guard.
11-Player Playoff Listing
1. Macomb Dakota, 3016, 5-2, 69.000
2. Dearborn Fordson, 2741, 6-1, 86.571
3. Utica Eisenhower, 2689, 7-0, 113.143
4. Grand Blanc, 2660, 6-1, 85.286
5. East Kentwood, 2639, 5-2, 66.429
6. Clarkston, 2603, 5-2, 74.429
7. Rockford, 2485, 4-3, 63.714
8. Clinton Township Chippewa Valley, 2434, 6-1, 94.571
9. Detroit Cass Tech *, 2434, 5-1, 76.143
10. Troy, 2422, 5-2, 71.000
11. Brighton, 2247, 4-3, 58.429
12. Canton, 2212, 6-1, 87.714
13. Holland West Ottawa, 2200, 6-1, 87.714
14. Salem, 2090, 4-3, 55.286
15. Detroit Catholic Central, 2080, 5-2, 73.714
16. West Bloomfield, 1990, 5-2, 74.429
17. New Baltimore Anchor Bay, 1956, 5-2, 66.857
18. Utica, 1907, 4-3, 56.571
19. Saline *, 1869, 6-1, 88.429
20. Bloomfield Hills, 1842, 5-2, 71.000
21. Lapeer, 1837, 5-2, 65.286
22. Livonia Stevenson, 1811, 4-3, 63.143
23. Walled Lake Central, 1804, 4-3, 58.143
24. White Lake Lakeland *, 1765, 5-2, 72.000
25. Romeo, 1753, 5-2, 76.619
26. Grandville, 1750, 5-2, 70.714
27. Grand Ledge, 1726, 6-1, 86.429
28. Warren Mott, 1712, 4-3, 56.714
29. Belleville, 1709, 7-0, 106.286
30. Detroit Western International, 1701, 4-3, 49.857
31. Davison, 1695, 6-1, 88.714
32. Walled Lake Northern, 1678, 5-2, 66.000
33. Grosse Pointe South, 1644, 4-3, 63.214
34. Rochester Adams, 1626, 6-1, 89.714
35. Waterford Mott, 1586, 6-1, 87.429
36. Traverse City West, 1582, 7-0, 97.143
37. Brownstown Woodhaven, 1569, 5-2, 71.429
38. Temperance Bedford, 1548, 6-1, 81.857
39. Warren DeLaSalle, 1538, 5-2, 76.943
40. Flint Carman-Ainsworth, 1502, 5-2, 68.857
41. Livonia Churchill, 1486, 6-1, 91.857
42. Livonia Franklin, 1469, 5-2, 66.286
43. Jenison, 1457, 5-2, 65.714
44. Roseville, 1412, 5-2, 68.429
45. Detroit Martin Luther King, 1404, 6-1, 77.810
46. Dearborn Edsel Ford, 1396, 5-2, 62.143
47. Oak Park, 1395, 5-2, 73.429
48. Grosse Pointe North *, 1371, 4-2, 61.048
49. Portage Central, 1353, 6-1, 87.571
50. Traverse City Central, 1345, 5-2, 71.286
51. Wyandotte Roosevelt, 1345, 7-0, 99.429
52. Royal Oak, 1332, 4-3, 49.714
53. Okemos, 1326, 4-3, 49.429
54. Walled Lake Western, 1318, 6-1, 92.143
55. Midland, 1316, 6-1, 84.286
56. Flushing, 1312, 5-2, 71.286
57. Birmingham Groves, 1300, 6-1, 89.714
58. Port Huron Northern, 1277, 6-1, 83.000
59. St Clair Shores Lake Shore, 1273, 4-3, 48.571
60. Pinckney, 1272, 6-1, 83.000
61. Detroit East English, 1270, 7-0, 86.857
62. Midland Dow, 1263, 6-1, 79.143
63. Grand Rapids Forest Hills Central, 1258, 7-0, 104.000
64. Muskegon Mona Shores, 1238, 7-0, 109.714
65. Birmingham Brother Rice, 1224, 4-3, 62.036
66. Ypsilanti Lincoln, 1222, 5-2, 72.000
67. Lowell, 1195, 4-3, 62.857
68. Muskegon Reeths-Puffer, 1186, 4-3, 50.286
69. Ferndale, 1180, 6-1, 75.857
70. Mattawan, 1171, 5-2, 68.714
71. Holly, 1166, 4-3, 52.429
72. Fenton, 1163, 7-0, 105.143
73. Greenville, 1158, 4-3, 51.000
74. Holland, 1140, 5-2, 64.286
75. Hamtramck, 1135, 5-2, 59.429
76. Detroit Renaissance, 1131, 4-3, 46.524
77. Gibraltar Carlson, 1125, 7-0, 101.714
78. East Lansing, 1108, 5-2, 67.714
79. Redford Thurston, 1102, 5-2, 61.571
80. Eastpointe, 1101, 4-3, 48.714
81. Warren Woods Tower, 1095, 6-1, 80.714
82. Byron Center, 1083, 4-3, 50.000
83. Muskegon, 1058, 7-0, 100.571
84. St. Joseph, 1043, 5-2, 70.714
85. Auburn Hills Avondale, 1033, 4-3, 61.143
86. Farmington Hills Harrison, 1030, 5-2, 77.000
87. East Grand Rapids, 1010, 7-0, 102.857
88. DeWitt, 994, 6-1, 87.571
89. Zeeland East, 994, 7-0, 93.714
90. St. Johns, 990, 4-3, 49.857
91. Gaylord, 980, 4-3, 49.571
92. Ortonville-Brandon, 969, 4-3, 54.714
93. Zeeland West, 960, 5-2, 74.714
94. Melvindale, 956, 4-3, 54.286
95. Cedar Springs, 946, 5-2, 72.143
96. Coldwater, 933, 4-3, 51.714
97. Riverview, 928, 6-1, 77.143
98. Detroit Cody, 924, 4-3, 48.810
99. Linden, 924, 6-1, 91.143
100. Warren Fitzgerald, 903, 5-2, 64.429
101. Grand Rapids Christian, 896, 6-1, 92.286
102. Stevensville Lakeshore, 891, 6-1, 91.857
103. Hazel Park, 889, 5-2, 67.571
104. Battle Creek Harper Creek, 884, 7-0, 91.429
105. Parma Western, 880, 4-3, 50.000
106. New Boston Huron, 877, 5-2, 64.000
107. Romulus, 864, 5-2, 65.429
108. Haslett, 856, 5-2, 66.286
109. Marshall, 854, 4-3, 49.429
110. Dearborn Divine Child, 852, 6-1, 85.143
111. Tecumseh, 850, 4-3, 54.286
112. Chelsea, 841, 6-1, 85.143
113. River Rouge, 836, 6-1, 84.286
114. Edwardsburg, 835, 6-1, 72.714
115. Bay City John Glenn, 831, 4-3, 52.143
116. Detroit Mumford, 829, 5-2, 60.810
117. Coopersville, 824, 5-2, 54.857
118. Sparta, 815, 4-3, 45.571
119. Bloomfield Hills Cranbrook Kingswood, 812, 6-1, 73.857
120. Plainwell, 808, 5-2, 64.286
121. Vicksburg, 801, 6-1, 71.429
122. Milan, 772, 4-3, 48.857
123. Madison Heights Lamphere, 768, 4-3, 47.286
124. Detroit Old Redford, 763, 4-3, 36.143
125. Goodrich, 759, 6-1, 68.143
126. Escanaba, 739, 6-1, 78.048
127. Harper Woods Chandler Park Academy, 727, 5-2, 59.524
128. Pontiac Notre Dame Prep, 718, 6-1, 63.714
129. Three Rivers, 707, 6-1, 78.143
130. Croswell-Lexington, 681, 4-3, 42.143
131. Wyoming Godwin Heights, 679, 5-2, 50.714
132. Wyoming Kelloggsville, 678, 7-0, 86.857
133. Romulus Summit Academy North, 674, 4-3, 44.429
134. Paw Paw, 662, 4-3, 45.571
135. Whitehall, 661, 5-2, 52.000
136. Flint Powers Catholic, 660, 4-3, 57.571
137. Lake Fenton, 660, 6-1, 75.143
138. Flat Rock, 658, 5-2, 64.571
139. Grand Rapids Catholic Central, 646, 7-0, 79.048
140. Alma, 642, 6-1, 73.857
141. Comstock Park, 636, 4-3, 51.143
142. Williamston, 628, 5-2, 59.714
143. Lansing Sexton, 620, 5-2, 76.286
144. Lake Odessa Lakewood, 608, 6-1, 74.000
145. Hudsonville Unity Christian, 606, 4-3, 54.571
146. Grand Rapids South Christian, 602, 6-1, 73.857
147. Belding, 597, 6-1, 78.429
148. Bridgeport, 594, 4-3, 44.571
149. Muskegon Oakridge, 592, 5-2, 58.571
150. Saginaw Swan Valley, 586, 6-1, 77.429
151. Hancock, 584, 6-1, 61.857
152. North Muskegon, 579, 5-2, 43.714
153. Dowagiac, 568, 4-3, 52.286
154. Freeland, 564, 5-2, 60.857
155. Ann Arbor Father Gabriel Richard, 555, 6-1, 61.476
156. Olivet, 552, 7-0, 85.714
157. Lansing Catholic, 551, 6-1, 75.000
158. Remus Chippewa Hills, 550, 5-2, 60.714
159. Kingsford *, 542, 5-1, 71.131
160. Algonac, 534, 6-1, 71.571
161. Portland, 534, 6-1, 80.571
162. Frankenmuth, 528, 7-0, 88.190
163. Carrollton, 520, 6-1, 71.571
164. Ida, 520, 6-1, 63.429
165. Marine City, 514, 6-1, 87.714
166. Grant, 512, 5-2, 50.429
167. Kalkaska, 512, 4-3, 35.000
168. Richmond, 510, 7-0, 83.429
169. Grand Rapids West Catholic, 505, 6-1, 77.286
170. Onsted, 505, 5-2, 49.000
171. Reed City, 501, 6-1, 76.286
172. Almont, 494, 5-2, 58.714
173. Gladstone, 493, 6-1, 61.286
174. Grayling, 492, 4-3, 43.571
175. Berrien Springs, 484, 6-1, 65.429
176. Coloma, 480, 5-2, 51.429
177. Menominee, 479, 5-2, 61.321
178. Kalamazoo Hackett, 474, 5-2, 58.286
179. Newaygo, 474, 5-2, 56.143
180. Detroit Denby *, 461, 5-1, 69.667
181. Ovid-Elsie, 458, 5-2, 54.143
182. Clare, 457, 6-1, 64.857
183. Detroit Voyageur, 446, 4-3, 44.429
184. Parchment, 443, 5-2, 56.143
185. Boyne City, 428, 7-0, 80.000
186. Brooklyn Columbia Central, 426, 5-2, 65.143
187. Michigan Center, 419, 6-1, 61.143
188. Ecorse, 417, 4-3, 40.714
189. Harrison, 410, 5-2, 49.571
190. Montague, 409, 7-0, 85.714
191. Millington, 407, 6-1, 71.714
192. Hemlock, 405, 5-2, 47.714
193. Morley Stanwood, 405, 6-1, 55.714
194. Negaunee, 405, 4-3, 35.143
195. Ithaca, 403, 7-0, 78.857
196. Clinton Township Clintondale, 401, 6-1, 73.571
197. Calumet, 396, 4-3, 42.929
198. Detroit Henry Ford, 385, 4-3, 33.667
199. Warren Michigan Collegiate, 382, 7-0, 90.286
200. Montrose, 381, 6-1, 65.857
201. Maple City Glen Lake *, 376, 4-2, 44.000
202. Quincy, 376, 5-2, 53.857
203. Kent City, 375, 7-0, 70.857
204. Lakeview, 374, 4-3, 36.714
205. Napoleon, 373, 5-2, 56.143
206. Schoolcraft, 372, 5-2, 55.000
207. Blissfield, 371, 4-3, 55.571
208. Detroit Central, 369, 5-2, 54.143
209. Laingsburg, 367, 5-2, 48.286
210. Grass Lake, 365, 4-3, 38.000
211. Traverse City St. Francis, 362, 7-0, 86.476
212. Jackson Lumen Christi *, 361, 6-1, 80.857
213. Houghton Lake, 357, 4-3, 42.143
214. Watervliet, 355, 7-0, 75.048
215. Beaverton, 353, 7-0, 74.286
216. Elk Rapids, 353, 6-1, 64.857
217. Burton Bendle, 352, 4-3, 35.286
218. L'Anse, 351, 4-3, 43.571
219. Vermontville Maple Valley, 346, 4-3, 37.286
220. Allen Park Cabrini, 344, 4-3, 32.143
221. Monroe St. Mary Catholic Central, 344, 4-3, 54.286
222. Hanover-Horton, 342, 4-3, 33.714
223. Ishpeming Westwood, 342, 6-1, 55.571
224. Riverview Gabriel Richard, 341, 6-1, 53.286
225. Lake City, 333, 7-0, 75.429
226. Oscoda, 332, 4-3, 34.000
227. Detroit Delta Prep, 329, 5-2, 57.714
228. St. Louis, 329, 4-3, 39.714
229. Flint Hamady, 327, 5-2, 50.714
230. Grand Rapids NorthPointe Christian, 327, 5-2, 59.857
231. Union City, 327, 5-2, 52.571
232. Madison Heights Madison, 323, 7-0, 92.800
233. Hartford, 318, 5-2, 48.571
234. McBain, 314, 6-1, 59.143
235. New Lothrop, 311, 7-0, 78.857
236. Clinton, 309, 5-2, 50.000
237. Harbor Springs, 306, 4-3, 34.000
238. Pewamo-Westphalia, 305, 6-1, 61.000
239. Homer, 299, 4-3, 44.143
240. Saugatuck, 297, 5-2, 49.143
241. Saranac, 285, 4-3, 40.714
242. Springport, 285, 5-2, 45.857
243. Cass City, 282, 6-1, 65.857
244. Rochester Hills Lutheran Northwest, 279, 7-0, 62.476
245. Cassopolis, 268, 7-0, 69.714
246. Unionville-Sebewaing, 267, 4-3, 39.857
247. Elkton-Pigeon-Bay Port Laker, 263, 6-1, 63.571
248. Hudson, 263, 6-1, 70.429
249. Reading, 263, 6-1, 64.286
250. Carson City-Crystal, 258, 4-3, 33.714
251. Breckenridge, 254, 6-1, 56.857
252. Addison, 253, 6-1, 56.714
253. Auburn Hills Oakland Christian *, 248, 4-2, 43.000
254. Beal City, 247, 4-3, 38.857
255. Iron River West Iron County, 245, 6-1, 60.000
256. Ubly, 243, 6-1, 57.857
257. Ottawa Lake Whiteford, 239, 7-0, 69.714
258. St. Joseph Lake Michigan Catholic, 238, 5-2, 41.405
259. Petersburg-Summerfield, 235, 5-2, 47.143
260. Decatur, 234, 4-3, 38.857
261. Lincoln Alcona, 233, 6-1, 57.048
262. Norway, 230, 6-1, 55.643
263. Johannesburg-Lewiston, 228, 4-3, 34.714
264. Harbor Beach, 218, 6-1, 56.857
265. New Buffalo, 209, 4-3, 34.000
266. Saginaw Nouvel, 208, 7-0, 75.657
267. Mendon, 205, 7-0, 68.571
268. Newberry *, 205, 4-2, 42.714
269. Pittsford, 204, 6-1, 60.000
270. Morenci, 200, 4-3, 42.286
271. Munising *, 200, 4-3, 34.500
272. Sterling Heights Parkway Christian, 194, 4-3, 41.833
273. Adrian Lenawee Christian, 181, 5-2, 38.000
274. Athens, 181, 5-2, 32.286
275. Gaylord St. Mary, 173, 7-0, 70.667
276. Frankfort *, 170, 5-2, 43.619
277. Muskegon Catholic Central *, 169, 6-0, 74.667
278. Fulton, 167, 5-2, 44.714
279. Climax-Scotts, 162, 6-1, 53.286
280. AuGres-Sims *, 148, 7-0, 65.143
281. Hillman, 140, 4-3, 39.000
282. Mt. Pleasant Sacred Heart, 133, 5-2, 42.286
283. Waterford Our Lady *, 124, 4-2, 38.190
284. Clarkston Everest Collegiate, 112, 6-1, 55.905
8-Player Playoff Listing
1. Onekama, 136, 7-0, 57.143
2. Deckerville, 182, 6-1, 56.714
3. Rapid River, 118, 7-0, 56.381
4. Camden-Frontier, 156, 7-0, 56.000
5. Central Lake, 191, 7-0, 54.857
6. Pickford, 151, 7-0, 50.286
7. Morrice, 175, 6-1, 49.714
8. Bellevue, 174, 6-1, 47.714
9. Portland St Patrick, 103, 6-1, 46.429
10. Stephenson, 160, 6-1, 46.381
11. Marion, 136, 6-1, 44.095
12. Rudyard, 193, 6-1, 43.000
13. Cedarville, 152, 6-1, 42.857
14. Bay City All Saints, 97, 6-1, 41.857
15. Kinde-North Huron, 148, 6-1, 41.286
16. Kingston, 191, 5-2, 41.286
17. Flint International Academy, 150, 5-2, 39.143
18. Engadine, 95, 5-2, 38.143
19. Webberville, 179, 5-2, 36.857
20. Crystal Falls Forest Park *, 146, 4-2, 36.810
21. Wyoming Tri-unity Christian, 182, 4-3, 34.143
22. Ontonagon *, 187, 4-2, 33.952
23. Battle Creek St. Philip, 135, 4-3, 31.571
24. Mayville, 197, 4-3, 30.571
25. Powers North Central *, 112, 4-2, 30.333
26. Suttons Bay, 201, 4-3, 29.571
27. Mesick, 180, 4-3, 29.381
28. Tekonsha, 145, 4-3, 29.286
29. Peck, 127, 4-3, 25.714
30. Brimley, 164, 4-3, 24.714
31. Lawrence, 181, 3-4, 24.000
32. Bellaire, 142, 3-4, 22.286
33. Brethren *, 159, 3-3, 22.238
34. Carsonville-Port Sanilac, 106, 3-4, 21.857
35. Waldron, 79, 3-4, 21.571
36. Hale, 129, 3-4, 21.238
37. St. Joseph Michigan Lutheran, 99, 4-3, 20.286
38. North Adams-Jerome, 150, 3-4, 19.714
39. Atlanta, 74, 3-4, 18.571
40. New Haven Merritt Academy, 164, 3-4, 18.143
41. Onaway, 195, 3-4, 17.429
42. Manistee Catholic Central *, 178, 2-4, 17.000
43. Carney-Nadeau, 133, 2-5, 15.943
44. Fife Lake Forest Area, 165, 2-5, 15.857
45. Eben Junction Superior Central, 131, 2-5, 15.643
46. Bear Lake, 93, 2-5, 13.571
47. Baldwin, 105, 2-5, 11.095
48. Felch North Dickinson, 101, 1-6, 10.429
49. Burton Madison Academy, 171, 1-6, 8.429
50. Posen, 87, 1-6, 7.857
51. Caseville, 93, 1-6, 7.714
52. Owendale-Gagetown, 57, 1-6, 7.000
53. Burr Oak, 74, 0-7, 3.857
54. Pellston, 167, 0-7, 3.857
55. Litchfield, 81, 0-7, 3.571
56. St. Helen Charlton Heston Academy, 140, 0-7, 3.571
57. Big Rapids Crossroads Academy, 187, 0-7, 2.905
58. Akron-Fairgrove, 76, 0-7, 2.714
59. Flint Michigan School for the Deaf *, 47, 0-5, 1.686