
Inside Selection Sunday: Mapping the Football Playoffs
October 24, 2011
Sitting on the other side of this process for a number of years, I can admit to occasionally scratching my cynical head over some of the matchups that have come out of Selection Sunday.
How could teams so far from each other play in the same district? Why would two schools in the same town play in different regionals? Are they picking out of a hat at 1661 Ramblewood Drive?
Now, I have answers.
Sunday morning, we filed into headquarters for what might be the most important non-game day on the MHSAA calendar. “We” were made up of half of the MHSAA staff, plus a representative from the Michigan High School Football Coaches Association.
Here’s some of what I learned from being a part of the process:
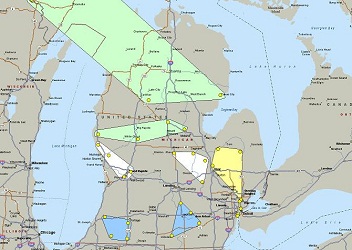
? First, a brief history lesson. In early years (or until the middle of the last decade), lines were drawn by hand. Dots representing qualifying schools were pasted on maps, one map for each division, and those maps were then covered by plastic sheets. Districts and regionals literally were drawn with dry-erase markers. No longer. Using a variety of spreadsheets and mapping software, we’ve gone digital. Staff is split into two teams, each considering four divisions (and the 8-player map) before we reconvene and look at all nine divisions together.
? We are presented digital maps of the state covered in dots. That’s about it. The rule of the day, simply, is “geography rules.” Which teams are represented by the dots is not considered, much less discussed, until lines are drawn. While considering my group’s first map, I began to bring up teams – and immediately was shot down (with good reason). Teams, matchups, rivalries, previous playoff pairings, etc. DO NOT come into play. We draw boxes in what we figure are the most logical ways of making districts and regions work.
? Travel distance and ease DO come into play. This especially is true when considering which districts will include teams from the Upper Peninsula. An example: Marquette is closer to the schools we placed in its district – Fenton, Bay City Western and Okemos – than some other options because those schools are closer to I-75. Schools further north on the map but farther from a main highway would’ve created longer trips.
? Sometimes, maps get ugly. And sometimes, it was a matter of choosing the least ugly situation. Of course, a D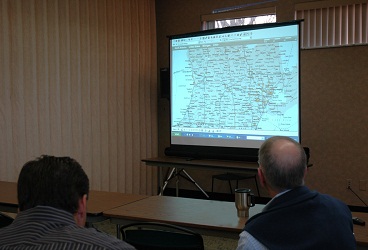 ivision 4 District of Lansing Sexton, Dearborn Heights Robichaud, Battle Creek Pennfield and Vicksburg isn’t ideal. But with no other Division 4 schools within 35 miles of Lansing, we were put in a tough spot. Add in that there were 13 teams in the Detroit area, leaving one as the odd team out of three districts based there. Something had to give, and drawing things up as we did caused the fewest messes.
? Considering how to set up the entire state is different than figuring out what teams make the most sense for just one school or area. And shifting just one dot on a map can change things for all 32.
? Back to “geography rules.” The Division 8 district including Saugatuck, Muskegon Catholic, Mendon and St. Joseph Lake Michigan Catholic might be the most competitive, on paper, in the state. Saugatuck is the reigning MHSAA runner-up in the division, and Muskegon Catholic and Mendon were ranked Nos. 1 and 2, respectively, in the most recent Association Press poll. Seeing that after we’d drawn the line caused a collective “ouch.” But again, the line was drawn based on dots on a map.
I thought back on some of the matchups I’d questioned in the past, and came back to what I’d ask people now: How would you do things differently?
I imagine there would be some creative answers, but I also would guess we considered those scenarios too.
And remember, determining the playoff schedule is just one step in many. Eight state champions must survive it, regardless of which opponents they face along the way.

Muskegon's Quest: 800 Wins & Counting
By
Ron Pesch
MHSAA historian
September 24, 2015
Editor's note: The Muskegon High School football program became the first in Michigan high school history to win 800 games when it defeated Grandville 39-12 on Sept. 11.
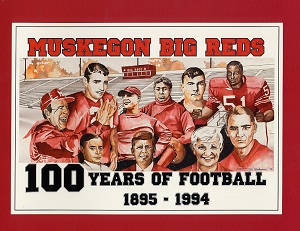
Longtime MHSAA historian Ron Pesch is the foremost expert on Muskegon Big Reds football; he even wrote the book celebrating the program's first 100 years in 1994. Below, he recounts his start in uncovering Muskegon's rich past and notes many of the highlights on the way to this season's milestone victory – as well as his "journey" starting with instructor's criticisms and finishing with the publishing of "Muskegon Big Reds: 100 Years of Football."
“This is all very interesting, but what good is it? What can you tell from all this data? Are there any patterns you can ascertain? Changes in size of the schools played?”
So began the journey to 800.
The newest version of a high school in Muskegon opened in the fall of 1893. Two years later, in the fall of 1895, the Muskegon High Athletic Association was organized with the goal of assembling a football team “fully capable of sustaining Muskegon’s reputation in athletics.”
Under the guidance of Mr. Edward Taylor, a teacher at the high school, whose influence led to the creation of the organization, the club was formed, with Louis Udell named to serve as president, while John Miller acted as vice-president, Louis Brock as secretary and Vernor Page as treasurer. “A committee of three … was appointed to select from pupils of the High School a sufficient number to form a Foot Ball Team.”
Practices were scheduled and challenges quickly came from teams in Grand Rapids, Ann Arbor, Big Rapids, Ionia, and the Ferris Business College in Muskegon. The first game was scheduled against the Business College for Saturday, November 2 at the baseball grounds, at the terminus of the Pine Street railway line.
A stiff breeze had to be contended with, but good straight play was a feature of the game. The high school was defeated by the heavier squad assembled by Business College, 12-8. It was a start.
 The next two contests were cancelled due to weather. On November 23, 1895 at 12:35 p.m., Muskegon boarded a train for Grand Haven. At 3 p.m., the contest, featuring two halves of 30 minutes each, was played. When the final whistle blew, MHS had its first-ever victory.
The details of what occurred over the next 80 or so years were then buried in yearbooks, newspaper accounts and in the memories of hundreds of Muskegon athletes.
As it turned out, no one was compiling the wins. No one had tried to see the forest through the trees.
“A disappointing paper. Very little narrative and practically no analysis or insight. I realize it must have been difficult to put together the team records, but what use are they?”
Like most schools, Muskegon did produce a yearbook, and, in the early days, a monthly magazine that detailed the success and failures of individual games and seasons. Unfortunately, there were years where magazines or annuals simply didn’t exist, or results weren’t listed.
For 11 seasons, I couldn’t find the scores. Scanning the forest of newsprint on microfilm from those early years, when the results of sporting events were mixed in with the news of the day, often proved of little help.
“You do not even total them up for an overall record. Services are not understood.”
Larry Harp inherited a talented squad from his predecessor, after head coach Roger Chiaverini opted to jump across town to lead the Crusaders of Muskegon Catholic in the fall of 1971. In Harp’s first year as head varsity coach, the Big Reds won a huge victory over previously unbeaten Traverse City before 10,000 fans at Hackley Stadium, ended the year undefeated, and were proclaimed Michigan’s Class A football state champions by the statewide media at season’s end. I was as proud as a 10-year-old could be that the high school that would be mine had won the crown.
But while I loved the game, I never played a down of football at Muskegon High School. Coach Harp was my gym teacher, but he understood, as a 4-foot-11 senior, I was as far as one could be from being all-state material.
Instead, fate had a different role for me. As a college student, I enrolled in a local history class. There I was assigned a term paper that would alter my path in life.
My paper would focus on football at Muskegon. By all accounts, the delivered product was limited in scope, comprised of hundreds of scores and some details on important people, games and interesting notes I found along the way.
I had 15 weeks, start to finish, molding a paper that was enlightening to me, but a major disappointment to my professors.
"What about comparing trends in Muskegon sports to trends elsewhere? Distance traveled to play opponents as roads improved, etc. Changes in Strategy? Use of specialized teams? What about even a listing of all-staters from Muskegon? Anything to make it worth your trouble."
I learned that in 1901, Dr. J.L. Williams was hired as the school’s first coach. Prior to that time, the team’s captain, fullback, or a volunteer served in the role. A parade of others followed Williams, including Robert Walker, a player on that first team who led Muskegon to its first undefeated season in 1904, and Mortimer Jones, a star in Muskegon’s backfield before the turn of the century, who in all likelihood was the first African-American to coach a high school team in Michigan, and perhaps beyond.
Within the collection of coaches was Robert Zuppke, who had accepted his first coaching job at Muskegon. His success led to a move to Oak Park High School in the suburbs of Chicago, where he won a pair of mythical national gridiron crowns before moving to the University of Illinois where his football squads totaled 131 victories, seven Big Ten titles and four mythical national championships over 29 seasons. With players like Harold "Red" Grange, George Halas and Potsy Clark, his innovative mind is credited with creating the screen pass and the “flea flicker” that advanced the game.
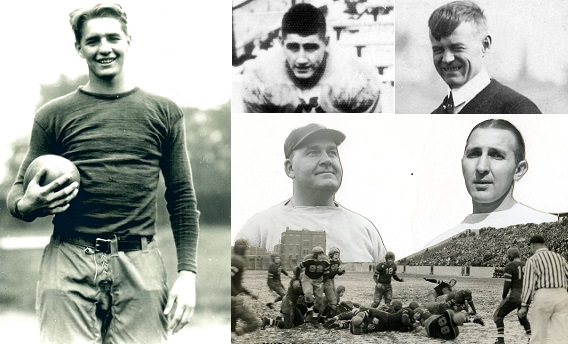 As a sophomore at Muskegon, I had led tours through the school’s newly opened gymnasium building. Thanks to the research, I now better understood why the district had named the complex the Redmond/Potter gymnasium. Coach C. Leo Redmond guided Muskegon to seven mythical state football titles and a basketball crown, while his longtime assistant and successor, Harry Potter, led Muskegon to a gridiron championship in 1951. The quarterback of that team was Earl Morrall, later an All-American at Michigan State University and a 21-year veteran in the NFL.
The 1920s were Muskegon’s most successful decade, as the team won more than 85 percent of its games thanks to the leadership of J. Francis Jacks, who guided Muskegon to its first mythical state football title in 1920, then additional titles in 1921 and 1923. Like Potter years later, Jacks’ team in 1923 featured the skill of a future University of Michigan All-American, Bennie Oosterbaan, who is considered the greatest all-around athlete in the long rich history of the university. Following the sudden passing of Coach Jacks in the spring of 1924, the school hired Redmond, who would compile a 156-29-13 record as head coach over 22 seasons before retiring in 1946. Muskegon posted 28 straight winning seasons between 1919 and 1946.
The first instructor completed his assessment and graded the paper with a "C” ... The second added his note, tacked on a minus sign to the “C” and altered the score. Final grade – 70. Unlike most assignments from high school and college, when the semester ended, I did not toss this one out.
The final entry in the paper noted that Muskegon had finished the 1979 season with a 7-2-0 record and a Lake Michigan Athletic Conference championship. It was Coach Harp’s final year. He stepped down to become the school’s athletic director.
On the gridiron, Muskegon’s fortunes had begun to slip. Over the next three years, the team set school passing records galore, but posted a disappointing 8-19 record. A lone highlight was a 19-15 regular-season win over cross-town rival Muskegon Catholic Central in 1980. The Crusaders would go on to win the MHSAA Class B championship that year. It was Muskegon Catholic’s single loss during an otherwise flawless season, and Muskegon’s single victory that year.
 I continued digging into microfilm, and researching the history of football at Muskegon. Coach Harp cheered me on during my research, assisting where possible. Staff at our local library knew me by name.
As I neared completion of the list of scores, a pair of phone calls would lead to a startling discovery.
A call to Kalamazoo Central High School designed to cross-check scores of games played against the Maroon Giants guided me to a resident of the Kalamazoo area. My second call was to Dick Kishpaugh. Unknown to me, I had reached the state authority on high school sports.
Kishpaugh quickly recognized that Muskegon’s win total topped Michigan in all-time football wins and ranked among the top teams in the nation.
In the fall of 1983, Dave Taylor was named head coach at Muskegon, and quickly righted the ship. In 1985, I was presented with a chance to write a series of articles, based on my research, covering the history of high school football at Muskegon for the local newspaper.
The timing was remarkable, as the Big Reds scored their first appearance in the MHSAA football playoffs that same season. A year later, Taylor’s team won the school’s first playoff title. Led by an undersized defense, Muskegon upset Sterling Heights Stevenson 10-0 for the Class A title – its first since the MHSAA began a playoff system in 1975.
Taylor’s Big Reds won a second title in 1989. He spent 17 years at the helm, second in longevity to only Redmond, and compiled a 112-51-1 mark over the span.
In the fall of 1994, the project that began as a term paper hit the press. A fundraiser for the school’s Athletic Association, 100 Years of Muskegon Big Red Football, told the story of Muskegon’s gridiron past. Still offering little analysis, it did contain much more narrative, and a comprehensive look at the names and faces that guided the teams to success.
Taylor retired from teaching, but at the request of school administrators, remained in charge as the district sought a replacement. In 2000, Tony Annese, took the reins and, to the astonishment of many across the state, pushed the program to an even higher level. In nine seasons, his squads won three MHSAA Division 2 titles and totaled 92 victories in 107 games.
Perhaps the most surprising aspect of the road to 800 is the fact that a single school district has been able to sustain success on the football field for so long. In an environment of constant economic, demographic and personnel change, where the number of school districts serving students in the Muskegon area has ballooned in size beginning in the 1950s, the Big Reds continue to rack up victories against strong opponents.
 Matt Koziak took charge of the Muskegon program for a year before moving over to Mona Shores, where he has put together a squad that has emerged as a playoff contender after years of silence. Shane Fairfield was named head coach of the Big Reds beginning in 2010, and hasn’t missed a beat. His teams have earned three straight trips to Detroit’s Ford Field, where all three finished as runners-up to the MHSAA crown. Entering the season, Fairfield’s Big Reds have scored 52 victories against 13 defeats.
In the state of Michigan, Muskegon entered the 2015 season with a 798-273-43 record over 120 seasons of football. Ann Arbor Pioneer first started playing in 1891 and ranked second in wins, with a 714-422-38 record, while Menominee began the current season tops in the Upper Peninsula and third in the state with a 634-283-40 mark dating back to its start in 1894.
Muskegon picked up win number 800 on Friday, Sept. 11, with a 39-12 victory over Grandville, making the school only the 10th in the nation to reach the landmark. Victory 700 came in 2005, with Annese in charge, while victory 600 was earned by Taylor’s 1991 squad versus cross-town rival Mona Shores. Unbeknown at the time, Harp’s 1975 team scored the school’s 500th win. Redmond’s 1935 team tallied the school’s 250th, while Louis Gudelsky’s 1912 team was the one that grabbed win number 100. In total, the school has won 17 state titles, 12 mythical when a team with an unblemished season-ending record could lay claim, and five MHSAA crowns.
In the end, they are only games, but the educational value and impact on lives can be far reaching. Certainly for those who play and coach the game, and sometimes, even for those who simply play witness.
 Ron Pesch has taken an active role in researching the history of MHSAA events since 1985 and began writing for MHSAA Finals programs in 1986, adding additional features and "flashbacks" in 1992. He inherited the title of MHSAA historian from the late Dick Kishpaugh following the 1993-94 school year, and resides in Muskegon. Contact him at [email protected] with ideas for historical articles.
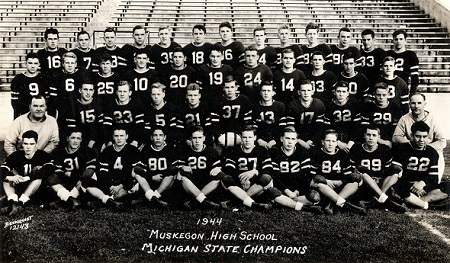
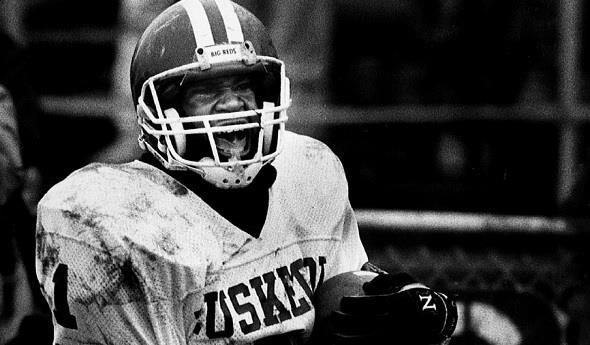
PHOTOS: (Top) The Muskegon football team readies for its entrance at Ford Field before last season's MHSAA Division 3 Final. (Middle top) The 1944 team was among those considered a "mythical state champion" before the introduction of MHSAA playoffs in 1975. (Middle) A number of Big Reds legends, clockwise from left: Bennie Oosterbaan, Earl Morrall, coach Robert Zuppke, coaches C. Leo Redmond and his rival, to the right, Muskegon Heights' Oscar E. "Okie" Johnson, over an action shot from their 1943 game. (Middle below) Marcus Longmire celebrates a touchdown during the 1989 playoff against Escanaba. (Below) Pesch's book, co-authored with Marc Okkonen, detailed the first 100 years of Muskegon football.