
Scoring Record Falls, North Central Soars
January 16, 2021
By Tim Robinson
Special for Second Half
BRIGHTON – It's not often when a pair of defensive plays are key in a 70-48 decision.
But that's the way it went for Powers North Central, which beat Portland St. Patrick by that score in the 8-Player Division 2 championship game at the Legacy Center.
The North Central Jets (11-0), who won their third MHSAA Finals championship, sacked St. Patrick quarterback Connor Cross seven times. But he completed 25 of 38 passes for 374 yards and six touchdowns.
"My hat's off to Portland St. Patrick," North Central coach Leo Gorzinski said. "They tested our kids like no one has this season."
The Jets were led by Luke Gorzinski, who rushed for 299 yards and four touchdowns and threw for 156 yards and three more scores.
"I was on the team last year, when we lost in the Final," he said. "It was a heartbreaking loss, but this is the top of the world."
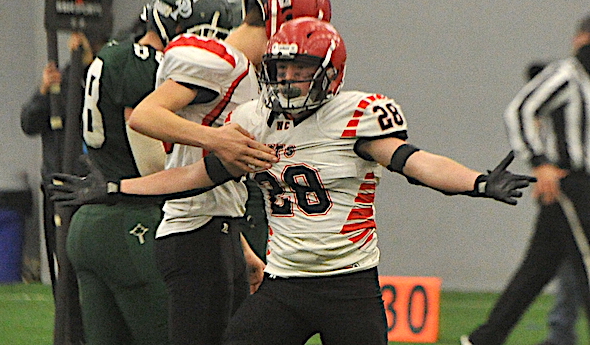
Wyatt Raab rushed for a pair of touchdowns and caught two passes for scores. He also sacked Cross in the end zone for a safety that gave the Jets a 10-0 lead after the first quarter.
But the Shamrocks (10-1) then got going, scoring 22 points in the second quarter, only to see the Jets add 24 to take a 34-22 halftime lead.
While the game would go on to set multiple 8-Player Finals scoring records, including for most points scored by both teams combined, the aforementioned pair of defensive plays helped North Central pull away during the third quarter.
 The Jets thwarted the Shamrocks on the first drive of the second half, when Luke Klieman intercepted a pass at the Jets’ 40. After the teams exchanged touchdowns, North Central forced St. Patrick to turn the ball over on downs. Raab then scored two plays later from 28 yards out to effectively put the game out of reach.
The Jets’ defense, which allowed St. Patrick 404 yards in total offense, allowed only 31 on the ground, most of them after the game was out of reach, and stopped the Shamrocks on four attempted two-point conversions.
Both teams were without starters due to the coronavirus or contact tracing.
"We were missing some key players," Luke Gorzinski said. "But their replacements stepped up. We had freshmen and sophomores out there, and they were awesome."
North Central racked up 579 yards in scoring 70 or more points for the fifth time this season.
The Shamrocks, to their credit, kept after the Jets to the end.
"That's the way we've played all year, through the shutdown and everything" St. Patrick coach Patrick Russman said. "They want to play and have fun, and that's what they wanted people to see. That's their character."
Shane Cook had 13 catches for 179 yards and three touchdowns for the Shamrocks.
But a North Central team that had several starters and their defensive coordinator at home had enough to take the championship trophy home to the Upper Peninsula, thrilling the 100 or so fans who made the long drive.
"It was fun to play in the (Superior) Dome last week," Raab said, referring to the Jets' Semifinal win over Cedarville, "but it felt weird with no fans. To have our families here to watch meant a lot."
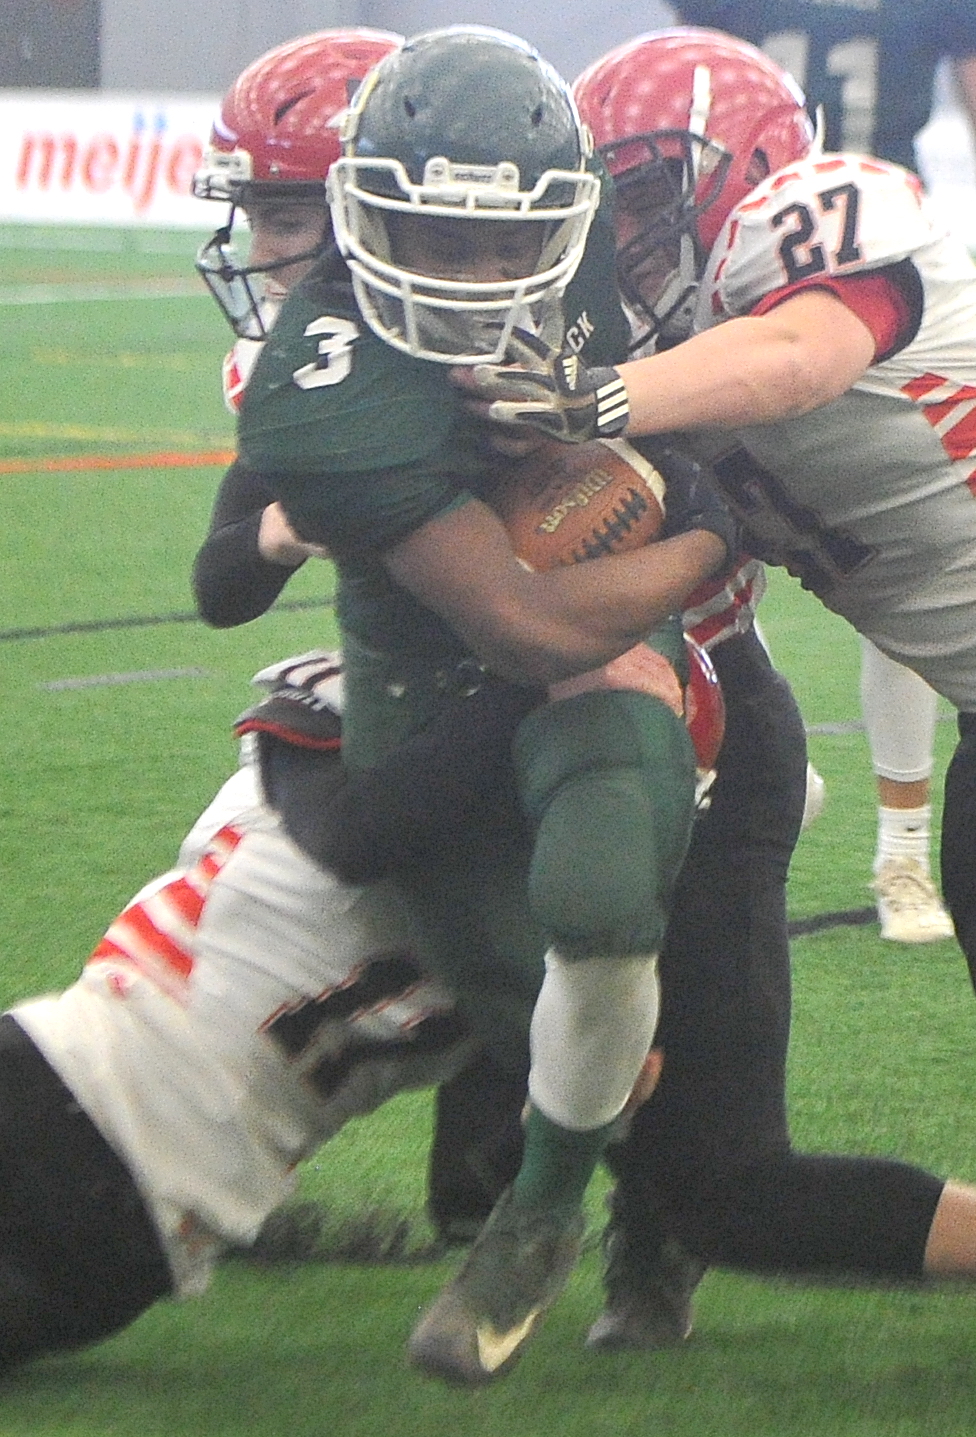
PHOTOS: (Top) North Central’s Wyatt Raab celebrates a defensive stop during Saturday’s Division 2 Final. (Middle) Portland St. Patrick’s Jacobe Hayes-Dunning works to get out of the grasp of a pair of Jets defenders. (Click for more from Hockey Weekly Action Photos.
Drive to Detroit: District Semis in Review
October 29, 2012
By Geoff Kimmerly
Second Half editor
Hopes are high for most of 242 teams heading into the first weekend of the MHSAA football playoffs.
But we see it every October – the unexpected and plain unbelievable take over in the postseason as teams raise their games to meet the urgency of do-or-be-done.
Seven of 34 undefeated teams lost for the first time this weekend and are now eliminated. All eight of last season's 11-player champions are still alive – but 8-player champion Carsonville-Port Sanilac is no longer.
Of course, at this time of year every game takes on critical meaning. So instead of saying the results below were the most signficant, rather, let's say they're the ones that jumped out most from the District Semifinals.
Division 1
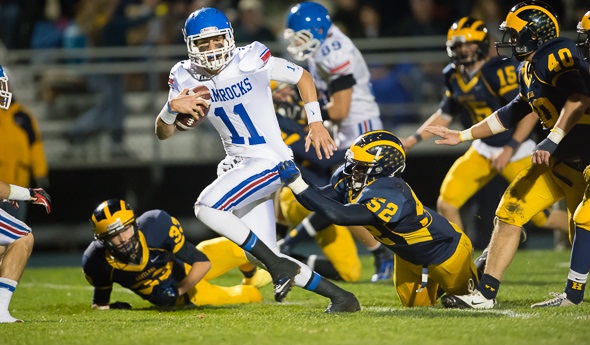
Detroit Catholic Central 21, Hartland 15
The playoffs are when we find out just how strong the Detroit Catholic League Central was compared to the rest of the state each fall, and this provided a start on that comparison for 2012. The Shamrocks (6-4) opened with a close win over of the Kensington Lakes Activities Association West champion Eagles (8-2).
Click to read more from Novi Patch.
Also noted:
Holland West Ottawa 21, Grand Ledge 14 – The Panthers (8-2) avenged a 31-10 loss to the Comets (7-3) on Aug. 31.
Livonia Churchill 49, Livonia Stevenson 35 – These two met for the second week in a row; both times Churchill (10-0) scored 49 points, although Stevenson (6-4) cut the deficit to 14 this game after losing the first by 39.
Walled Lake Northern 41, Howell 27 – On top of playing in its first playoff game ever, Northern (8-2) also earned another by downing the Highlanders (6-4).
Dearborn 24, Dearborn Fordson 14 – The Pioneers (7-3) won a stunner after falling 35-0 to the Tractors (7-3) just five weeks ago.
Division 2
East Lansing 10, Lansing Everett 6
Life was good for the Vikings (9-1) after they completed their first 9-0 regular season ever – a run that included a 6-0 victory against East Lansing. But the Trojans (7-3), who struggled some and had to win in Week 9 just to make the playoffs, earned perhaps the biggest upset of District opener weekend. Click to read more from the Lansing State Journal.
Also noted:
Traverse City Central 48, Bay City Western 47 (2 OT) – Adding to its league title season, Central (9-1) won a playoff game for the first time since 1991. Western finished 8-2.
Lowell 21, Grand Rapids Northview 0 – The playoff-seasoned Red Arrows (8-2) made the first appearance for Northview (7-3) a quick one.
Fenton 22, Farmington Hills Harrison 19 – The Tigers (9-1) have now won a playoff games each of the last three seasons, and delivered Harrison (6-4) its only first-game postseason departure in its last 14 appearances.
Southfield 22, Detroit Martin Luther King 19 – The Bluejays (7-3) were a bit forgotten needing three straight wins just to make the playoffs, but got everyone's attention again by beating the Detroit Public School League champion Crusaders (6-4).
Division 3
Zeeland West 46, Zeeland East 0
That West won this game isn’t the stunning part – their first meeting this season was a 60-52 win by East, and West (6-4) is the reigning Division 4 champion. But consider the score this time, and also that East (9-1) had beaten Division 2 contender Muskegon by a point just a week ago and hadn’t lost this fall. Click to read more from the Holland Sentinel.
Also noted:
Hamilton 42, Edwardsburg 14 – The Hawkeyes (6-4) were among the last to make the playoffs, but got off to a good start against the Eddies (6-4).
Grand Rapids Christian 45, Fruitport 6 – The Eagles (9-1) continued to roll while handing Fruitport (8-2) its second loss of the season and second in a row.
DeWitt 34, Lapeer West 28 (OT) – The Panthers (8-2) extended their streak of winning at least one playoff game to seven seasons, while West finished 6-4 for the second straight fall.
Tecumseh 27, Chelsea 20 – Only three weeks prior, Chelsea (6-4) had beaten Tecumseh (8-2) in a game that decided the Southeastern Conference White championship.
Division 4
Grand Rapids South Christian 48, Paw Paw 0
South Christian’s losses this season came against three playoff teams, including two in Grand Rapids Christian and Grand Rapids Catholic Central that are expected to contend for MHSAA titles. So to figure this game might be close wasn’t too far off. But the Sailors (7-3) did more than that in handing Paw Paw (9-1) its only loss. Click for more from the Kalamazoo Gazette.
Also noted:
Richmond 24, Marine City 21 – Richmond (7-3) hung on again after also handing the Mariners (8-2) a 25-24 loss on opening night of the regular season.
Williamston 29, Marshall 8 – The Hornets (7-3) had to win three straight just to make the playoffs, and are rolling on four in a row with this defeat of the Redhawks (6-4).
Three Rivers 20, Battle Creek Pennfield 14 – This would qualify as an upset win by Three Rivers (7-3), as Pennfield (8-2) had been considered a contender all season.
Detroit Country Day 35, Clinton Township Clintondale 0 – The Yellow Jackets (8-2) handed Clintondale (9-1) its first and only loss of the season.
Division 5
Kingsford 36, Grayling 14
In the first season after the retirement of his legendary coach father Ken Hofer from Menominee, Kingsford coach Chris Hofer led his Kingsford team to one of the best opening wins of the playoffs. The Flivvers (9-1) intercepted four passes in handing Grayling (9-1) its first and only loss. Click to read more from the Iron Mountain Daily News.
Also noted:
Olivet 28, Lansing Catholic 14 – This one was equally stunning, as the Eagles (7-3) knocked out the reigning MHSAA runner-up Cougars (8-2).
Lake Fenton 41, Jackson Lumen Christi 20 – Maybe less of a shocker but still an intriguing result: Lake Fenton (8-2) handed the Titans (8-2) one of their earliest exits of the last two decades.
Grand Rapids West Catholic 19, Hopkins 13 (OT) – The Falcons improved to 7-3 while handing Hopkins (9-1) its lone loss of the season.
Muskegon Oakridge 16, Buchanan 8 – Oakridge moved to 10-0 by winning this clash of league champions; Buchanan finished 7-3.
Division 6
Manchester 37, Clinton 36
The Flying Dutchmen (7-3) fell to Clinton by 18 all the way back on Aug. 24. But they handed Clinton (9-1) its first – and now only – loss this season by scoring with less than a minute remaining in this District opener. Click to read more from The Oakland Press.
Also noted:
Maple City Glen Lake 28, Boyne City 16 – Glen Lake (8-2) rebounded from a Week 9 loss, while Boyne City (8-2) finished with a second straight defeat.
Hemlock 45, Montague 20 – The Huskies (9-1) made it two straight seasons with at least nine wins, while dropping Montague just shy at 8-2.
Montrose 7, Vassar 6 – The Rams (9-1) won by a point for the second straight week while dropping the Vulcans to 7-3.
Detroit Consortium 8, Madison Heights Madison 3 – Consortium (7-3) also won its first-ever playoff game; Madison finished 8-2.
Division 7
Flint Hamady 39, Burton Bendle 33
Hamady (7-3) is better known for its basketball prowess. But after four seasons of one, zero, three and four wins, respectively, Hamady made the playoffs this fall – and earned its first postseason victory ever by avenging a Week 3 loss to Bendle (7-3). Click to read more from the Flint Journal.
Also noted:
Decatur 27, Hartford 15 – It was closer this time, but Decatur (8-2) beat league foe Hartford (7-3) for the second time in a month.
Britton Deerfield 14, Reading 7 – From the maybe-didn’t-see-that-coming file, the Patriots (7-3) knocked out the Big Eight Conference champ Rangers (8-2).
Dansville 21, Ottawa Lake Whiteford 18 – Another testament to the strength of the Central Michigan Athletic Conference, the Aggies (8-2) went on the road and came back with a win over the Bobcats (8-2) – Dansville’s first in the postseason since 1992.
Flint Beecher 35, Rochester Hills Lutheran Northwest 21 – Beecher (6-4) got into the playoffs with two straight wins at the end of the regular season, but pushed the streak to three by downing Lutheran Northwest (5-4).
Division 8
L’Anse 34, Crystal Falls Forest Park 28
The Purple Hornets (8-2) might have fallen just short of a league title, but they did earn their first playoff win since 2007 by downing the perennially-powerful Trojans (7-3). L’Anse scored the go-ahead touchdown with 41 seconds to play. Click to read more from the Iron Mountain Daily News.
Also noted:
Stephenson 14, Pickford 12 – Only three Division 8 games this weekend were decided by eight points or fewer, and this win by Stephenson (8-2) over Pickford (7-3) was the closest.
Climax-Scotts 34, St. Joseph Lake Michigan Catholic 7 – Climax-Scotts (10-0) earned a shot against reigning champion and also 10-0 Mendon by defeating Lake Michigan Catholic (7-2).
Waterford Our Lady 15, Pittsford 7 – This was the third of only three close games in Division 8, with Our Lady (8-2) moving on. Pittsford (7-3) lost in the first round last season by the same score.
Felch North Dickinson 50, Bessemer 20 – North Dickinson (9-0), the smallest school in the 11-player playoffs, needs one more win for its second season in three with at least 10 victories. Bessemer ended its first playoff season since 2006 at 6-3.
8-Player
Owendale-Gagetown 52, Akron-Fairgrove 48
This was a sweet victory for Owendale-Gagetown (8-2) and not just because the Bulldogs live on. These two split during the regular season, but Akron-Fairgrove’s win in the second game of the series counted toward the league standings and earned the Vikings that championship. Click to read more from the Saginaw News.
Also noted:
Deckerville 42, Carsonville-Port Sanilac 39 – The Eagles (9-1) eliminated the reigning MHSAA champion Tigers (4-6) in their third game against them this fall; Deckerville won all three.
Kinde-North Huron 14, Peck 8 (OT) – After falling to Peck (7-3) by 16 three weeks prior, the Warriors (6-4) won the rematch.
PHOTO: Detroit Catholic Central senior quarterback Garrett Moores (11) tries to break the grasp of Hartland senior lineman Markus Inman (52) during Friday's Division 1 District victory. (Click to see more at Terry McNamara Photography.)