

Week 5 Football Playoff Listing
September 18, 2012
Here is a list of Michigan High School Athletic Association football playing schools, displaying their win-loss records and playoff averages through the fourth week of the season.
Schools on this list are in enrollment order. An asterisk (*) beside a record indicates that a team has eight or fewer games scheduled. A carrot (^) beside a school’s name indicates that a team is one win away from playoff qualification.
Those schools with 11-player teams with six or more wins playing nine-game schedules, or five or more wins playing eight games or fewer, will qualify for the MHSAA Football Playoffs beginning Oct. 26-27. Schools with 5-4, 4-3 or 4-4 records may qualify if the number of potential qualifiers by win total does not reach the 256 mark. Schools with six or more wins playing nine-game schedules or five or more wins playing eight games or fewer may be subtracted from the field based on playoff average if the number of potential qualifiers exceeds the 256 mark.
Once the 256 qualifying schools are determined, they will be divided by enrollment groups into eight equal divisions of 32 schools, and then drawn into regions of eight teams each and districts of four teams each.
Those schools with 8-player teams will be ranked by playoff average at season’s end, and the top 16 programs will be drawn into regions of eight teams each for the playoff in that division, which also begins Oct. 26-27.
To review a list of all football playoff schools, individual school playoff point details and to report errors, visit the Football page of the MHSAA Website.
The announcement of the qualifiers and first round pairings for both the 11 and 8-player playoffs will take place on Oct. 21 on the Selection Sunday Show on FOX Sports Detroit at 7 p.m. The playoff qualifiers and pairings will be posted to the MHSAA Website following the Selection Sunday Show.
----------------------------------------------------------------------------------------------------------------------------
11-Player Playoff Listing
1. Utica Eisenhower, 2772, 3-1, 72.500
2. Sterling Heights Stevenson, 2766, 3-1, 68.500
3. Clarkston, 2721, 4-0, 90.000
4. Macomb Dakota, 2608, 3-1, 72.500
5. Lake Orion, 2565, 4-0, 90.000
6. Troy, 2502, 3-1, 70.500
7. Clinton Township Chippewa Valley, 2462, 3-1, 74.250
8. Dearborn Fordson, 2442, 3-1, 76.250
9. Holland West Ottawa, 2262, 3-1, 66.500
10. Detroit Cass Tech, 2200, 4-0, 92.000
11. Canton, 2166, 3-1, 62.750
12. Monroe, 2154, 4-0, 82.000
13. Plymouth, 2050, 3-1, 62.750
14. Salem, 2039, 4-0, 88.000
15. Livonia Stevenson, 2005, 4-0, 92.000
16. Hartland, 1932, 4-0, 88.000
17. Warren Mott, 1879, 4-0, 84.000
18. Livonia Churchill, 1877, 4-0, 94.000
19. Walled Lake Central, 1857, 3-1, 64.750
20. Saline, 1849, 3-1, 62.250
21. Grandville, 1846, 3-1, 64.750
22. Flint Carman-Ainsworth, 1772, 4-0, 82.000
23. Grand Ledge, 1743, 3-1, 64.250
24. Rochester, 1725, 3-1, 68.750
25. Traverse City West, 1720, 3-1, 62.250
26. White Lake Lakeland, 1700, 3-1, 64.250
27. Davison, 1664, 3-1, 64.750
28. Grosse Pointe South, 1648, 3-1, 70.500
29. Temperance Bedford, 1581, 3-1, 58.750
30. Brownstown Woodhaven, 1520, 3-1, 64.750
31. Ypsilanti Lincoln, 1520, 3-1, 66.750
32. Midland, 1485, 4-0, 94.000
33. Port Huron, 1473, 3-1, 66.500
34. Traverse City Central, 1429, 3-1, 64.000
35. Oak Park, 1391, 4-0, 94.000
36. Lansing Everett, 1359, 4-0, 96.000
37. Birmingham Seaholm, 1349, 3-1, 62.500
38. Garden City, 1344, 3-1, 64.250
39. Portage Central, 1340, 3-1, 66.750
40. Muskegon Mona Shores, 1337, 3-1, 52.750
41. Birmingham Brother Rice, 1336, 3-1, 70.750
42. Portage Northern, 1328, 3-1, 70.750
43. Caledonia, 1308, 4-0, 90.000
44. Wyandotte Roosevelt, 1304, 4-0, 78.000
45. Farmington Hills Harrison, 1302, 3-1, 68.250
46. Farmington, 1278, 4-0, 90.000
47. Grand Rapids Forest Hills Central, 1278, 3-1, 64.750
48. Taylor Truman, 1253, 4-0, 88.000
49. Swartz Creek, 1223, 4-0, 90.000
50. Fenton, 1202, 3-1, 60.750
51. Grand Rapids Northview, 1180, 3-1, 62.000
52. Lowell, 1177, 3-1, 66.750
53. Bay City Western, 1171, 4-0, 72.000
54. Gibraltar Carlson, 1160, 4-0, 78.000
55. Muskegon, 1144, 4-0, 98.000
56. East Lansing, 1142, 4-0, 76.000
57. Mattawan, 1124, 4-0, 82.000
58. Marquette*, 1112, 3-1, 68.250
59. Redford Thurston, 1088, 3-1, 52.500
60. Auburn Hills Avondale, 1080, 4-0, 82.000
61. St. Johns, 1068, 4-0, 82.000
62. Zeeland East, 1067, 4-0, 88.000
63. Detroit East English, 1030, 3-1, 60.750
64. Lansing Waverly, 1011, 3-1, 54.750
65. St. Joseph, 974, 3-1, 58.500
66. Mason, 969, 4-0, 76.000
67. Milan, 959, 4-0, 78.000
68. Grand Rapids Christian, 954, 3-1, 68.750
69. Cedar Springs, 950, 3-1, 50.250
70. DeWitt, 931, 3-1, 62.750
71. Fruitport, 929, 4-0, 76.000
72. Orchard Lake St. Mary's, 926, 3-1, 66.750
73. Bloomfield Hills Lahser, 925, 4-0, 78.000
74. Linden, 923, 4-0, 92.000
75. Niles, 920, 3-1, 66.750
76. Hazel Park, 909, 3-1, 58.750
77. Stevensville Lakeshore, 906, 4-0, 94.000
78. St. Clair, 901, 4-0, 74.000
79. Tecumseh, 887, 4-0, 82.000
80. Carleton Airport, 868, 3-1, 60.500
81. Detroit Central Collegiate, 868, 3-1, 60.250
82. Hastings, 850, 3-1, 54.750
83. Plainwell, 832, 3-1, 62.750
84. Cadillac, 820, 4-0, 80.000
85. Madison Heights Lamphere, 814, 3-1, 60.750
86. Edwardsburg, 805, 3-1, 52.500
87. North Branch, 803, 3-1, 56.500
88. Hamilton, 801, 4-0, 80.000
89. Marysville, 794, 4-0, 84.000
90. Three Rivers, 760, 3-1, 52.500
91. Goodrich, 748, 3-1, 56.500
92. Dearborn Heights Robichaud, 720, 4-0, 82.000
93. Big Rapids, 706, 3-1, 48.750
94. Croswell-Lexington, 704, 4-0, 82.000
95. St. Clair Shores South Lake, 704, 3-1, 62.500
96. Pontiac Notre Dame Prep, 701, 4-0, 78.000
97. Otsego, 698, 3-1, 54.500
98. Detroit Country Day, 685, 3-1, 66.250
99. Comstock Park, 678, 3-1, 60.000
100. Grand Rapids Catholic Central, 674, 4-0, 76.000
101. Grand Rapids South Christian, 660, 3-1, 56.500
102. Battle Creek Pennfield, 656, 4-0, 56.000
103. Grosse Ile, 649, 3-1, 52.750
104. Saginaw Swan Valley, 642, 4-0, 72.000
105. Paw Paw, 639, 4-0, 68.000
106. Allendale, 636, 3-1, 66.500
107. Williamston, 636, 3-1, 56.750
108. Cheboygan, 631, 3-1, 58.500
109. Marine City, 629, 3-1, 66.250
110. Alma, 614, 3-1, 60.750
111. Saginaw Valley Lutheran, 608, 3-1, 36.750
112. Dowagiac, 605, 4-0, 74.000
113. Livonia Clarenceville, 597, 3-1, 57.417
114. Clawson, 582, 3-1, 46.500
115. Remus Chippewa Hills, 581, 3-1, 50.500
116. Essexville Garber, 572, 3-1, 54.500
117. Clinton Township Clintondale, 570, 4-0, 78.000
118. Lake Fenton, 564, 3-1, 54.500
119. Freeland, 561, 3-1, 54.500
120. Kingsford, 559, 3-1, 50.750
121. Portland, 555, 4-0, 72.000
122. Flint Powers Catholic, 542, 4-0, 78.000
123. Menominee, 539, 4-0, 82.000
124. Macomb Lutheran North, 537, 4-0, 74.000
125. Hopkins, 531, 4-0, 64.000
126. Detroit University Prep, 528, 4-0, 72.667
127. Grayling, 516, 4-0, 66.000
128. Ann Arbor Gabriel Richard, 515, 3-1, 48.750
129. Allen Park Cabrini, 512, 3-1, 42.750
130. Olivet, 509, 3-1, 48.750
131. Frankenmuth, 507, 4-0, 72.000
132. Newaygo, 507, 3-1, 54.750
133. Ida, 503, 4-0, 64.000
134. River Rouge, 495, 4-0, 66.667
135. Carrollton, 492, 4-0, 56.000
136. Lansing Catholic, 487, 3-1, 52.500
137. Reed City, 480, 4-0, 70.000
138. Muskegon Oakridge, 474, 4-0, 68.000
139. Kingsley, 473, 3-1, 40.250
140. Jackson Lumen Christi, 472, 4-0, 74.000
141. Buchanan, 467, 3-1, 50.500
142. Leslie, 467, 4-0, 66.000
143. Roscommon, 461, 3-1, 46.750
144. Kalkaska, 459, 3-1, 38.750
145. Millington*, 459, 3-1, 58.750
146. Warren Michigan Collegiate, 446, 4-0, 66.000
147. Boyne City, 437, 4-0, 66.000
148. Monroe St. Mary Catholic Central, 437, 3-1, 52.500
149. Negaunee, 433, 4-0, 66.000
150. Beaverton, 422, 3-1, 40.250
151. Hemlock, 421, 3-1, 56.750
152. Shelby, 417, 4-0, 78.000
153. Vassar, 416, 4-0, 50.000
154. Clinton, 413, 4-0, 68.000
155. Maple City Glen Lake, 409, 4-0, 54.000
156. Michigan Center, 406, 4-0, 64.000
157. Manchester, 404, 3-1, 44.750
158. Ithaca, 402, 4-0, 76.000
159. Montrose Hill-McCloy, 400, 3-1, 58.750
160. Niles Brandywine, 396, 3-1, 38.917
161. Grass Lake, 395, 3-1, 48.750
162. Hillsdale, 391, 4-0, 70.000
163. Madison Heights Madison, 391, 3-1, 58.000
164. Ecorse, 390, 3-1, 42.500
165. Montague, 390, 3-1, 50.750
166. Sanford Meridian, 388, 3-1, 48.250
167. Saranac, 383, 3-1, 50.250
168. Constantine, 371, 3-1, 44.750
169. Grandville Calvin Christian, 371, 3-1, 46.750
170. Watervliet, 369, 4-0, 48.000
171. Schoolcraft, 366, 4-0, 68.000
172. Byron Area, 364, 3-1, 40.750
173. Reese, 350, 4-0, 54.000
174. Union City, 350, 4-0, 54.000
175. Burton Bendle, 348, 3-1, 40.750
176. Pellston, 347, 4-0, 32.000
177. Saginaw Nouvel, 344, 3-1, 64.750
178. Carson City-Crystal, 337, 3-1, 34.250
179. Hartford, 337, 4-0, 62.667
180. Marlette, 336, 4-0, 56.000
181. Whittemore-Prescott, 328, 3-1, 40.750
182. Lawton, 317, 4-0, 60.000
183. Lake City, 316, 4-0, 48.000
184. Pewamo-Westphalia, 316, 3-1, 46.500
185. Hesperia, 309, 3-1, 38.500
186. Ishpeming, 307, 4-0, 62.000
187. Unionville-Sebewaing, 303, 3-1, 38.500
188. Evart, 302, 3-1, 34.750
189. Homer, 302, 3-1, 36.750
190. Detroit Loyola, 298, 4-0, 76.000
191. Lincoln Alcona, 292, 3-1, 30.500
192. Genesee, 288, 3-1, 34.000
193. Mancelona, 288, 4-0, 50.000
194. Royal Oak Shrine Catholic, 284, 3-1, 56.750
195. Grosse Pointe Woods University Liggett, 283, 3-1, 36.500
196. Reading, 283, 3-1, 38.500
197. Decatur, 277, 4-0, 50.000
198. Gobles, 271, 3-1, 38.750
199. Ottawa Lake Whiteford, 268, 3-1, 40.750
200. Waterford Our Lady, 263, 4-0, 64.000
201. Newberry, 260, 3-1, 26.750
202. Mayville, 258, 3-1, 50.500
203. Melvindale Academy for Business & Tech, 254, 3-1, 52.500
204. Marcellus, 249, 4-0, 44.000
205. Harbor Beach, 245, 3-1, 38.750
206. Vestaburg, 242, 3-1, 36.500
207. Coleman, 239, 3-1, 38.250
208. New Lothrop, 237, 4-0, 64.000
209. Bessemer*, 233, 3-1, 38.750
210. L'Anse, 233, 4-0, 54.000
211. Petersburg-Summerfield, 232, 3-1, 40.750
212. Atlanta, 224, 3-1, 30.917
213. Mendon, 216, 4-0, 50.000
214. Beal City, 213, 4-0, 68.000
215. Pittsford, 213, 3-1, 36.250
216. Morenci, 207, 3-1, 40.000
217. St. Ignace La Salle, 207, 4-0, 46.000
218. Pickford, 197, 4-0, 48.000
219. Onaway, 194, 4-0, 38.000
220. Powers North Central, 194, 3-1, 26.250
221. Fowler, 186, 3-1, 48.750
222. Climax-Scotts, 183, 4-0, 44.000
223. Morrice, 171, 4-0, 48.000
224. St. Joseph Lake Michigan Catholic*, 171, 3-0, 46.667
225. Colon, 164, 3-1, 30.750
226. Crystal Falls Forest Park, 164, 4-0, 48.000
227. Mt. Pleasant Sacred Heart, 121, 3-1, 42.750
228. Iron Mountain North Dickinson*^, 112, 4-0, 54.000
229. Ashley, 99, 3-1, 28.500
---------------------------------------------------------------------------------
8-Player Playoff Listing
1. Deckerville, 194, 3-1, 36.750
2. Battle Creek St. Philip, 182, 3-1, 34.750
3. Kingston, 175, 3-1, 30.500
4. Cedarville, 169, 4-0, 45.333
5. Peck, 156, 4-0, 40.000
6. Eben Junction Superior Central, 132, 4-0, 42.000
7. Rapid River, 115, 4-0, 34.000
8. Portland St. Patrick, 104, 4-0, 46.000
9. Owendale-Gagetown, 60, 3-1, 32.250
Wooer Leads Kingsley's Return to Power
November 1, 2018
By Chris Dobrowolski
Special for Second Half
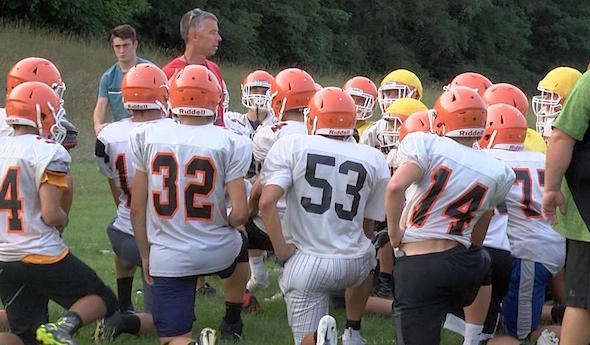
KINGSLEY — Tim Wooer does not have the ability to wave a wand and make victories on the football field appear out of thin air.
 The Kingsley football program is certainly grateful for the magic Wooer has brought back to the gridiron in no time at all, however.
After going 1-8 at year ago, Kingsley has had a remarkable turnaround in the first year of Wooer’s second tenure as Stags varsity head coach, going 9-1, including last week’s 62-22 Division 6 District playoff win over Tawas.
“The bottom line is — people have asked me how did this happen? I can only give you one answer, and it is the kids,” said Wooer.
It’s a group of players who have endured a lot the past few seasons. The once-proud program had fallen on hard times, seeing a decline in wins after a 6-4 playoff season in 2014. The Stags went 5-4, 5-4, 3-6 and bottomed out with one win during a tumultuous 2017 campaign that saw the previous head coach placed on administrative leave in the middle of the season before he later resigned. Interim coach Jamie Mullen finished out the fall. Needless to say, Kingsley’s players didn’t find many good, positive memories from the season.
“I didn’t even want to play anymore. I was just happy for (the season) to be over,” said Kingsley senior captain Dylan Case.
Wooer noticed the apathy, lack of energy and complacency that seemed to be common among many of the male athletes at his alma mater not long after he came on as a long-term substitute teacher at Kingsley just months after retiring from education. He also was in his 10th year as the head coach at Traverse City West and was enjoying his best year yet with the Titans, who finished 9-2 and won their first playoff game since Wooer arrived in 2008.
But while he was subbing, Wooer was able to drive his two daughters, Lauren and Sarah, to school every morning. He realized then how precious the moments with them and his son, Tyler, had become. So, when Wooer was approached about taking over the Stags in January, he didn’t need much time to make a decision.
“From a football standpoint it was a very poor decision at the time,” said Wooer. “We thought we had things going at West. We were 8-1, had a good nucleus coming back. Our numbers at the middle school were great. It was really kind of self-sustaining at that point. We had a really good thing going. But all the other factors made it a quite simple decision. It was family and obviously my love for Kingsley and the community of Kingsley.”
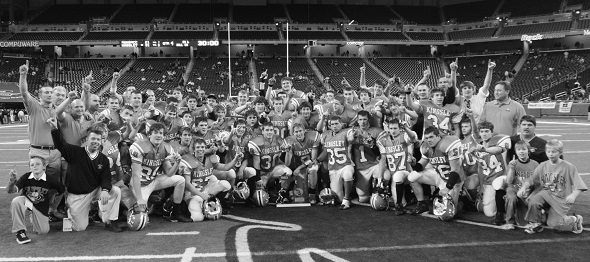
There was good reason for people in Kingsley to yearn for Wooer to come back. When he left after nine years, he had compiled a record of 68-29 and, most notably, guided the Stags to the 2005 Division 6 championship. A few of the oldest players on Kingsley’s current team were in kindergarten during that season. Many others had not started school. But many knew of Wooer. Parents, older siblings, cousins and community members alike had talked fondly of the 2005 title team, and a picture documenting the championship hangs prominently in the school. It gave Wooer instant credibility.
“He led Kingsley to a state championship,” said Case. “We knew he knew what he was talking about and that he wanted what was best for us.”
Coming off a 1-8 season, the players were more than willing to buy in to what Wooer was selling — winning football.
“You don’t really question it because we went 1-8,” said senior Jake Radtke, another senior captain. “We were like, ‘OK, this doesn’t work.’ Just trust the process and believe what he’s saying and buy in. He bleeds Black and Orange, and I love it. He knows we bleed Black and Orange, and he’s part of our family.”
Wooer surrounded himself with a staff of coaches who are mostly Kingsley alums and former players. Dan Goethels played on the team in 1997. Al Olds, Ryan Zenner and Dave Zenner all played for Wooer on the 2002 Kingsley squad. Mullin and Ron Hessem were three years behind Wooer in school in the late ‘80s. Ray Fisher, whose son Jake plays for the Cincinnati Bengals after starring for Wooer at West, has followed Wooer from Kingsley, to West, and now is back with the Stags.
 “We’ve surrounded ourselves with some really good people who have a love for Kingsley and understand the system and what we want to do,” Wooer said of his assistants.
Wooer laid down the law at his first meeting with the team last winter. He talked about bringing discipline to the program and set his expectations for players in preparation for the season, particularly getting better participation in the weight room. More than 40 players in the high school took that to heart and had perfect attendance in lifting over the summer.
“There were lots of expectations,” said senior lineman Nathan Ames. “You could tell from his speech that it was going to be a lot of work. From the first second of team camp everybody bought in. After team camp, I definitely knew what was going to happen.”
Wooer still might not have been so sure how much success he would have with the Stags right away. He thought his team played poorly in its first preseason scrimmage at Manton. Even after an improved showing against the likes of Harrison, North Muskegon and Mason County Central in a second scrimmage, Wooer still wasn’t convinced his team was ready to compete when it met McBain in the first week of the regular season.
“I can still remember driving down to McBain — I was terrified,” said Wooer. “I’m on the bus thinking we are so unprepared. We couldn’t make an adjustment outside of a timeout. It was timeouts and quarters where you had to throw as much information at them as you could, hoping they could make those adjustments. It took two or three weeks before we could. We were making adjustments on the fly. I was yelling stuff out on the field.”
The Stags ended up pulling out a 24-20 victory over a good McBain squad. People were already half-joking that the team had equaled its win total from the previous season.
“That was a huge turnaround,” said Ames. “We all just kind of looked at each other after that win and said this is it.”
Wins over Ogemaw Heights and Grayling followed. Though the Stags fell to Traverse City St. Francis in the fourth week, they rebounded with five straight victories to finish the regular season.
With the wins have also come some individual accolades. Six players were named to the all-Northern Michigan Football League Legends division first team — running back Ayden Mullin, who was the league’s Offensive Player of the Year, along with Ames at defensive tackle, Radtke at guard, tight end Ian Sousa, outside linebacker Devon Hager and defensive back Owen Graves.
“It was very refreshing to have kids who want to be coached and want to be pushed,” said Wooer. “That’s not common in today’s world.
“It has not been an easy process. There were some chewings and some tough times, but they didn’t flinch once. Once they saw the success they received for their efforts, and everything did work as it was planned, it kind of fell into place. I just can’t say enough about the kids. It’s all about every one of the kids in our program.”
 Chris Dobrowolski has covered northern Lower Peninsula sports since 1999 at the Ogemaw County Herald, Alpena News, Traverse City Record-Eagle and currently as sports editor at the Antrim Kalkaska Review since 2016. He can be reached at [email protected] with story ideas for Manistee, Wexford, Missaukee, Roscommon, Ogemaw, Iosco, Alcona, Oscoda, Crawford, Kalkaska, Grand Traverse, Benzie, Leelanau, Antrim, Otsego, Montmorency, Alpena, Presque Isle, Cheboygan, Charlevoix and Emmet counties.
PHOTOS: (Top) Kingsley football coach Tim Wooer addresses his team during practice this fall. (Middle) Wooer, bottom left, celebrates with his team after the Stags won the 2005 Division 6 title at Pontiac Silverdome. (Top photo courtesy of WPBN.)