
McCullen Reaches Milestone: 300 wins
March 7, 2012
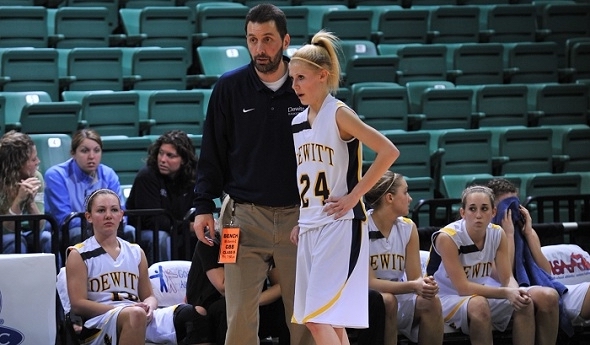
Bill McCullen truly earned his 300th coaching victory — the program’s first-ever tournament win as a Class A school — in the first round of MHSAA District action by defeating No. 4-ranked St. Johns on Feb. 27.
After the Redwings hit two free throws, McCullen called a timeout with 9.9 seconds left, down one, and the length of the floor to go. He drew up a play that was introduced to his team only the day before — senior Kalya Hanses to inbound the ball to senior Erica Goodenough, who was to get the ball to sophomore Lexi Banaszak at the division line. Banaszak was instructed to get the ball to left-handed freshmen Claudia Reid on the left wing, giving her a 2-on-1 break with junior Kaylee Schmit.
McCullen finished drawing up the play in the team huddle by saying, “We are going to score, and this place is going to go crazy!”
The play worked as it was drawn up. Reid received the ball and saw an opening to the basket, hitting the layup with 3.3 seconds left. McCullen was exactly right; the score went in, DeWitt won 36-35, and the home crowd did go crazy.
McCullen just completed his 16th season coaching the Panthers, taking the helm of a girls basketball program in 1996 that had struggled with a 28-37 record (14-22 in league play) over its three previous seasons.
The 300-win milestone is an achievement in itself — but more amazing with a closer look.
Under McCullen’s leadership, the program has posted a 150-20 league record (.882 winning percentage) while winning 13 league championships (including seven straight through this season), seven District championships, three Regional championships, and three MHSAA Semifinals appearances.
In a sport with a 20-game regular season, he has averaged 18.75 wins per (to just 4.25 losses). McCullen reached his 100th win in just five seasons, averaging an incredible 20 wins over that span. DeWitt has posted six 20-win seasons in the program’s history; McCullen is responsible for five of them.
In the history of MHSAA girls basketball, McCullen is the 44th coach to reach the 300-win plateau and only the sixth from the Lansing area. His win total and .815 winning percentage places him eighth and second, respectively, among active coaches.
Expectations are just as high in the classroom. McCullen’s squads have averaged a team grade-point average of 3.59 (with a 3.84 team GPA this season), earning top honors in Class B twice during the 2000 and 2010-2011 seasons. Nine players have earned academic all-state honors.
Above all the wins, McCullen is an exemplary role model for coaches, players, and parents. His behavior on the sidelines and how he talks to officials and players exemplifies what is expected of coaches. He has taken teaching and coaching beyond the classroom and hardwood and has created a “basketball family” within his program, building an uncanny rapport with what he calls “my girls.”
McCullen would likely recognize his wife (Denise) and two sons (Carter and Jerod) for their support and countless sacrifices, and he would also quickly shift credit for his success to the many assistant coaches throughout his tenure. His mentor, Jim Lutzke (who coached at DeWitt for six seasons before succumbing to cancer in 1999), had a lasting and profound impact on McCullen; Luztke undoubtedly would be proud.
Click to see the MHSAA record book listing for girls basketball coaches, and e-mail updates to [email protected].
McCullen, by the numbers
(League record in parentheses)
1996: 14-7 (7-5)
1997: 22-3 (10-2)
1998: 17-4 (11-1)
1999: 25-1 (12-0)
2000: 22-5 (11-1)
2001: 20-3 (10-0)
2002: 19-5 (10-0)
2003: 17-7 (7-3)
2004: 13-8 (7-3)
2005: 18-3 (9-1)
2006: 19-3 (10-0)
2007-08: 16-5 (8-2)
2008-09: 25-2 (10-0)
2009-10: 17-4 (9-1)
2010-11: 19-3 (10-0)
2011-12: 17-5 (9-1)
Totals 300-68 (150-20)
Breslin Bound: Girls Report Post-Break
January 6, 2020
By Geoff Kimmerly
Second Half editor
Welcome to 2020 as we charge full steam ahead into the post-holiday portion of a girls basketball season that has begun with the usual mix of predictability and surprises – and will end with a bit of a twist.
 Remembering that this season will see the top two teams in each District seeded for the first time, we’d like to take this week to introduce the Michigan Power Ratings (MPR) on MHSAA.com. Teams are searchable and comparable both by division and District number, and every Monday during the regular season we’ll also pull a top 20 in each division and post them on our Second Half rankings page.
There’s a full explanation of how MPR is calculated, and for the rankings teams were considered this week that had played at least four games against opponents that also are eligible for the MHSAA Tournament, since MPR includes only those opponents in its calculation. So you won’t see undefeated Detroit Edison or Menominee in this week’s Second Half rankings – but those teams are sure to join the list over the next week or two as they play more MHSAA opponents.
Below is a look at some of what you may have missed in holiday hoops during the break. “Breslin Bound” is powered by MI Student Aid and based on results and schedules posted for each school at MHSAA.com. Send corrections or missing scores to [email protected].
Week in Review
The countdown of last week’s five most intriguing results:
1. Grass Lake 43, Pewamo-Westphalia 40 – The Warriors continued building what’s shaping up as a special season by edging the reigning Division 3 champion at the Grand Valley State Holiday Classic.
2. East Grand Rapids 42, Southfield Arts & Technology 41 – The Pioneers should be dangerous contenders in league play and more after finishing their 2019 part of the schedule with a win over last season’s Division 1 runner-up.
3. Detroit Edison 68, Columbus Africentric Early College 59 – The reigning Division 2 champion avenged its lone loss of 2018-19 to move to 6-0 this winter.
4. St. Ignace 65, Ann Arbor Huron 52 – Even with a loss two days later to Ann Arbor Pioneer, Division 4 St. Ignace had to be happy heading home having dealt Division 1 Huron its only defeat.
5. Ypsilanti Arbor Prep 53, Southfield Arts & Technology 50 (2 OT) –Arbor Prep finished a tough couple of days for A&T. But although the Gators also lost two days later by two to Division 1 Brighton, in both games they showed they’ll again be tough against the teams in their Division 3.
Watch List
With an eye toward March, here are two teams in each division making sparks:
DIVISION 1
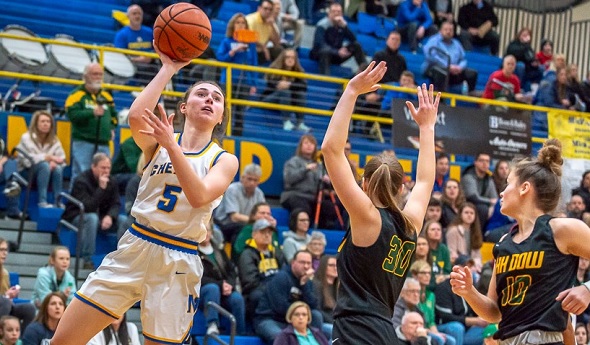
Midland (6-0) Dow has most recently ruled the Midland area in girls basketball. In fact, Midland High went only 5-16 last season. But the Chemics have bounced all the way back, with double-digit wins in all but one game – their 38-31 victory over Dow on Dec. 19. Also impressive was a 15-point win over another Division 1 team on the rise, Macomb L’Anse Creuse North, at the Motor City Roundball Classic.
Temperance Bedford (6-0) The Kicking Mules’ Southeastern Conference Red is loaded, with Saline also unbeaten and Ann Arbor Huron and Pioneer with just one loss apiece. But after opening with a seven-point win over Flat Rock, Bedford has won its next five by an average of 29.4 ppg – a big return after last season’s Quarterfinal run.
DIVISION 2
Grand Rapids Christian (7-0) After 13-9 and 11-11 finishes the last two seasons, respectively, this one could see the Eagles take a step back into the elite. They earned a Cornerstone Holiday Tournament title with wins over Forest Hills Central and Zeeland East and have only one other single-digit win among their first five – a 54-46 overtime avenging of last season’s loss to Holland Christian.
Menominee (7-0) The Maroons followed up two straight .500 finishes by going 15-9 with a District title last winter, and the surge has continued. A 52-47 win over otherwise-unbeaten Ishpeming Westwood on Dec. 18 was impressive, and Menominee spent part of its holiday break winning a tournament in Gillett, Wis., with a pair of double-digit victories.
DIVISION 3
Manton (6-0) Manton is one of two Highland Conference teams entering 2020 unbeaten – rival Lake City being the other – and the reigning league champion Rangers have won six straight by double digits after opening with a 52-49 win over Charlevoix. Along the way, they also handed the lone losses to Kingsley and McBain Northern Michigan Christian – and get another major test Wednesday against Maple City Glen Lake.
Niles Brandywine (6-0) Solid wins over Berrien Springs and Kalamazoo Christian highlight Brandywine’s perfect start as it looks to build on last season’s Quarterfinal run. The Bobcats headed into the break with a 71-23 win over last season’s Berrien-Cass-St. Joseph Conference Red champion Comstock, and they’ll see co-leader Buchanan for the first time Jan. 16.
DIVISION 4
Fruitport Calvary Christian (5-2) The Eagles’ season has been book-ended so far by a pair of losses to Division 3 teams, the most recent to one-loss Hart on Saturday. But a 50-46 win over Division 2 Central Montcalm the day before can’t be overlooked – the Hornets are 4-2 but hadn’t lost a regular-season game for two straight heading into this winter. Senior Kelsey Richards’ scoring gives Calvary a shot to make a run at any time.
Pickford (7-0) The Panthers closed the 2018-19 regular season with seven straight wins and 13 over their final 14 games to claim the Eastern Upper Peninsula Athletic Conference title by a victory ahead of Cedarville and Rudyard. They don’t see either of those teams until later this month, but they’ve set the standard so far with all double-digit wins and four by 30 points or more. A 62-46 win over Gaylord St. Mary on Dec. 4 remains the Snowbirds’ only defeat.
Can't-Miss Contests
Be on the lookout for results of these games coming up:
Monday – Southfield Arts & Technology (4-3) at West Bloomfield (5-1) – This will surely affect the Oakland Activities Association Red race; both are perfect in league play, and both teams’ losses have come against some of the state’s best.
Tuesday – Detroit Edison (6-0) at East Lansing (5-0) – Contenders in Divisions 2 and 1, respectively, face off with one accepting its first defeat of this season.
Tuesday – Bloomfield Hills Marian (5-0) at Farmington Hills Mercy (6-0) – These Detroit Catholic League Central rivals could set the conference pace again after Marian finished first and Mercy second last season.
Wednesday – Manton (6-0) at Maple City Glen Lake (4-1) – These two sit No. 5 and No. 4, respectively, in Division 3 MPR as of Monday afternoon.
Thursday – Calumet (5-1) at Ishpeming Westwood (4-1) – These two are looking early like two of the Upper Peninsula’s best in any division, and that means they could see each other in the Division 3 postseason as well.
Second Half’s weekly “Breslin Bound” reports are powered by MI Student Aid, a part of the Office of Postsecondary Financial Planning located within the Michigan Department of Treasury. MI Student Aid encourages students to pursue postsecondary education by providing access to student financial resources and information. MI Student Aid administers the state’s 529 college savings programs (MET/MESP), as well as scholarship and grant programs that help make college Accessible, Affordable and Attainable for you. Connect with MI Student Aid at www.michigan.gov/mistudentaid and find more information on Facebook and Twitter @mistudentaid.
PHOTO: Midland earned a 38-31 win over rival Midland Dow on Dec. 19 to help spark a perfect start this season. (Photo courtesy of the Midland girls basketball program.)