

Beginning Another Tourney Journey
August 8, 2016
Below is the introductory commentary to the MHSAA's spring issue of benchmarks. Histories of MHSAA tournaments published in that issue have been appearing on Second Half every Tuesday and Friday.
By Jack Roberts
MHSAA Executive Director
Concussions and cutbacks. Participation fees and part-time employment. Student safety and specialization. International students and interstate travel. Transfers and trials.
Through a myriad of issues which periodically cloud our mission, the foundation on which the MHSAA was built still shines brightest three times each year: Tournament Time!
It can be daunting and overwhelming to make a living at this business of interscholastic athletics these days, not to mention a tad confusing. Do we need legal degrees? Medical degrees? Business degrees? Marketing degrees? There seems to be no escape from threat of legislative mandates which continually change the landscape of our product and how it’s delivered. Demands pile up, resources dwindle.
Add the daily challenges of scheduling issues, inclement weather and pleasing teenagers and their parents on a daily basis, and it’s easy to lose focus of the primary missions for the MHSAA and its member schools.
And then, scenes like this happen:
• Holly Bullough, a senior cross country runner from Traverse City St. Francis takes her second straight Division 3 championship, winning by 36.4 seconds ... with a stress fracture in her left foot.
• Detroit Martin Luther King QB Armani Posey directs a game-winning drive to give his school the Division 2 football championship ... a drive which started on his own 3-yard line with 37 seconds left and ended with a 40-yard heave to receiver Donnie Corley on the final play of the game.
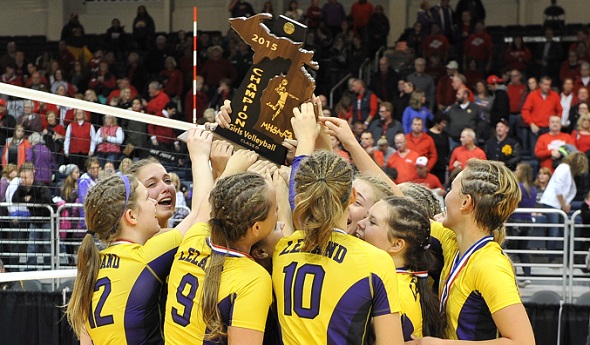
• Leland sweeps the Class D volleyball title match 3-0 over Battle Creek St. Philip ... ending a string of nine straight titles for St. Phil, the 10th longest national streak in history.
• Davison’s Taylor Davis becomes only the fourth person in MHSAA Girls Bowling history to roll a 300 game in the Singles portion of the tournament ... and the first ever in the championship match.
• The Upper Peninsula’s Hancock HS wins the Division 3 ice hockey title in its first trip to the Final since 2000 ... a trip funded in part from a “Go Fund Me” web page that raised $6,620 from 99 donors in two days.
• Junior Kierra Fletcher of Warren Cousino carries her team to the Class A girls basketball championship with 27 points in the Final ... after scoring 37 of her team’s 60 points in the Semifinals and totaling 198 during eight tournament games.
That’s just a sampling of the magic from last fall and winter.
These moments shine through the current challenges and the unseen future that awaits us as they always have. The uniforms and faces are different, but the tournaments have always yielded the fruits of our labors, and the memories for our mental scrapbooks.
PHOTO: Leland's volleyball team hoists its Class D championship trophy last fall at Kellogg Arena.

MHSAA Sports Participation Continues Upward Trend for 3rd-Straight Year
By
Geoff Kimmerly
MHSAA.com senior editor
August 6, 2024
Participation in Michigan High School Athletic Association-sponsored sports rose for the third-straight school year in 2023-24 – this time by nearly one percent – and continued to do so despite another 2-percent decrease in school enrollment among the MHSAA’s 754 member high schools.
A total of 270,664 participants were counted across the 28 sports for which the MHSAA sponsors postseason tournaments – a 0.97-percent increase from 2022-23 and despite a 1.8-percent decrease in MHSAA member school enrollment. Boys participation rose 1.1 percent to 158,260, despite a 1.8 percent decrease in boys enrollment. Girls participation rose 0.7 percent to 112,377, while girls enrollment dipped 1.9 percent from the previous school year.
MHSAA participation totals count students once for each sport in which they participate, meaning students who are multiple-sport athletes are counted more than once. The boys participation total for 2023-24 was its highest since 2018-19, predating the sharp decrease brought on by the COVID-19 pandemic during the 2020-21 school year.
Only 11 sports saw increases in participation during 2023-24 – compared to 18 sports that reported increases between 2021-22 and 2022-23. However, two sports set participation records this past school year. Girls golf reported 3,936 athletes, an increase of 6.2 percent from the previous year and that sport’s most since 2002-03. Girls lacrosse broke its record set in 2019-20 with 3,245 athletes, up nine-tenths of a percent from the previous year.
Wrestling reported the largest increase in participation for the second-straight school year, this time by 12.8 percent with 11,814 athletes – and the rise again mostly attributable to the rapid growth in girls participation in the sport, which jumped another 39 percent with 1,216 wrestlers this past season. Girls tennis enjoyed the next largest participation jump, increasing 9.1 percent with 8,911 athletes, that sport’s most since 2018-19.
Both girls and boys track & field increased for the third-straight year, girls by 5.2 percent to 17,325 competitors and boys 2.9 percent to 23,888. Boys lacrosse (up 3.9 percent to 5,236 athletes) and boys golf (up 3.3 percent to 7,222) also joined their girls counterparts in those sports in trending upward.
Boys soccer (up 5.1 percent to 13,953 athletes), girls competitive cheer (3.9 percent to 6,172) and football (11 and 8-player combined – 0.5 percent to 35,174) also showed increases. Football remains the most-played sport statewide with more than 11,000 more athletes than the next highest, boys track & field, and the 2023-24 football participation total was that sport’s highest since 2018-19. Boys basketball (20,199 participants), girls volleyball (19,119) and girls track & field ranked third through fifth, respectively, among the state’s most-played sports this past school year.
Although 17 sports saw lower participation in 2023-24 than the previous year, five experienced decreases smaller than the overall 1.8-percent loss in enrollment at member schools – boys ice hockey (-0.03 percent with just one fewer participant than in 2022-23), girls soccer (-0.3 percent), girls volleyball (-0.8 percent), boys tennis (-1.2 percent), boys cross country (-1.3 percent) and girls softball (-1.5 percent). Girls cross country just missed that line with only a 1.9-percent decrease from the previous year.
The participation figures are gathered annually from MHSAA member schools to submit to the National Federation of State High School Associations (NFHS) for compiling of its national participation survey. Results of Michigan surveys from the 2000-01 school year to present may be viewed on the Sports Participation Listing page of MHSAA.com.
The following chart shows participation figures for the 2023-24 school year from MHSAA member schools for sports in which the Association sponsors a postseason tournament:
|
BOYS |
|
GIRLS |
||
|
Sport |
Schools (A) |
Participants |
Schools (A) |
Participants (B) |
|
Baseball |
664/11 |
16,294 |
- |
-/15 |
|
Basketball |
730/3 |
20,193 |
722 |
13,113/6 |
|
Bowling |
431/0 |
4,292 |
425 |
2,767 |
|
Competitive Cheer |
- |
- |
348 |
6,172 |
|
Cross Country |
676/0 |
7,886 |
672 |
6,729 |
|
Football - 11 player |
509/78 |
32,431 |
- |
-/143 |
|
8-player |
120/16 |
2,583 |
- |
-/17 |
|
Golf |
549/41 |
7,135 |
389 |
3,936/87 |
|
Gymnastics |
- |
- |
104 |
529 |
|
Ice Hockey |
326/10 |
3,117 |
- |
-/11 |
|
Lacrosse |
187/13 |
5,210 |
132 |
3,245/26 |
|
Skiing |
135/0 |
822 |
133 |
786 |
|
Soccer |
495/15 |
13,903 |
490 |
11,829/50 |
|
Softball |
- |
- |
645 |
11,544 |
|
Swimming & Diving |
282/17 |
3,990 |
287 |
4,726/48 |
|
Tennis |
305/15 |
5,918 |
335 |
8,911/27 |
|
Track & Field |
692/0 |
23,888 |
694 |
17,325 |
|
Volleyball |
- |
- |
719 |
19,119 |
|
Wrestling |
511/288 |
10,598 |
-/1,216 |
(A) The first number is the number of schools reporting sponsorship on the Sports Participation Survey, including primary and secondary schools in cooperative programs as of May 15, 2024. The second number indicates the number of schools that had girls playing on teams consisting primarily of boys.
(B) The second number indicates the number of additional girls playing on teams consisting primarily of boys and entered in boys competition.