


Classes Still Create Hoosier Hysteria
July 27, 2017
By Rob Kaminski
MHSAA benchmarks editor
This is the fourth part in a series on MHSAA tournament classification, past and present, that will be published over the next two weeks. This series originally ran in this spring's edition of MHSAA benchmarks.
Twenty years ago, Bloomington North High School won the Indiana High School Athletic Association boys basketball championship, defeating Delta 75-54 at the RCA Dome in Indianapolis.
The date, March 22, 1997, is at the same time revered and disdained by traditionalists in the state who saw it as the last schoolboy championship game the state would ever host.
That’s how devout the game of basketball, particularly interscholastic basketball, had become in the Hoosier state during the 87 years a state champion – one state champion, to be precise – was crowned.
Following that 1997 season, the IHSAA moved to a four-class system for its roundball tournaments, like so many of its state association counterparts had done years earlier.
It would be shocking to find more than a small percentage of current high school basketball players around the country unfamiliar with the iconic movie Hoosiers, even though the film is now more than 30 years old.
And, the storyline for that blockbuster unfolded more than 30 years prior to its release, when small-town, undermanned Milan High School defeated Muncie Central High School 32-30 in the 1954 IHSAA title game.
Perhaps it’s because of the David vs Goliath notion, or the fame of the movie that replaced Milan with the fictional Hickory and real-life star Bobby Plump with Hollywood hero Jimmy Chitwood, or the simple fact that Indiana had something other states didn’t.
Whatever the reason, plenty of opposition remains to this day to basketball classification in the state.
The fact is, the small rural schools were regularly being beaten handily by the much larger suburban and city schools as the tournament progressed each season.
Small schools also were closing at a rapid rate following the state’s School Reorganization Act in 1959, as students converged on larger, centralized county schools. From 1960 to 2000, the number of schools entering the tournament dropped from 694 to 381, and in 1997 a total of 382 schools and 4,584 athletes began competition at the Sectional level (the first level of the IHSAA Basketball Tournament).
It was at the entry level of the tournament where school administrators felt the pain of the new class system, but not necessarily for the same nostalgic reasons as the fans who either attended or boycotted the tournament.
At the Sectional round of the tournament, the IHSAA was culling just 2 percent of the revenue, with the participating schools splitting the balance. So, when Sectional attendance dropped by 14 percent in that first year of class basketball, many schools realized a financial loss. It was money they had grown to count on in prior years to help fund various aspects of the department.
Schools cumulatively received more than $900,000 from Sectional competition in 1998, but that total was down from more than $1 million in the last year of the single-class tournament.
Yet, the current format provides a great deal more opportunity and realistic chances at championship runs for schools of all enrollments.
To date, 60 additional teams have championship or runner-up trophies on display in school trophy cases around Indiana.
That was the mission in front of then-IHSAA commissioner Bob Gardner (now National Federation executive director) once the board made its decision: to give thousands more student-athletes the opportunity for once-in-a-lifetime experiences.
As any statistician knows, figures can be manipulated to tell any side of a story. Declining attendance in year one of class basketball is such a number.
The truth is tournament attendance had been on a steady downward spiral since its peak of just over 1.5 million in 1962. By the last single-class event in 1997, the total attendance was half that.
The challenge then and today, as it is for all state associations, is to find that delicate balance for those holding onto tradition, those holding onto trophies, and the number of trophies to hand out.
Editor’s Note: Stories from the Fort Wayne Journal Gazette in 1998 and from a 2007 issue of Indianapolis Monthly provided facts in this article.
1st & Goal: 2024 Week 7 Review
By
Geoff Kimmerly
MHSAA.com senior editor
October 14, 2024
A total of 45 varsity teams remain undefeated after seven weeks of this 2024 football regular season.
 That total is at least 12 fewer than five days ago after a seismic Week 7 that saw several more league races decided and plenty of movement on the playoff point lists with just two games left for most before the field of 288 is selected.
Bay & Thumb
HEADLINER Chesaning 23, Ovid-Elsie 7 Chesaning (7-0) won this matchup of undefeated teams to clinch a share of the Mid-Michigan Activities Conference title, the program’s second straight as it continued a 13-game league winning streak. Chesaning can make the championship outright this week against Durand, while Ovid-Elise (6-1) closes its league schedule with New Lothrop. Click for more from WJRT.
Watch list Fenton 41, Flushing 21 Fenton (7-0) continued its Flint Metro League dominance by finishing a seventh-straight divisional title run in claiming the Stripes championship outright. Flushing fell to 5-2 but still has guaranteed its best finish since 2019.
On the move Standish-Sterling 27, Ogemaw Heights 25 Standish-Sterling’s benefit from this was a 10-spot jump to No. 16 on the Division 6 playoff list as the Panthers improved to 4-3, but Clare also ended up with a share of the Jack Pine Conference Division 1 title with Ogemaw Heights (6-1) taking its first loss. Goodrich 42, Ortonville Brandon 14 The Martians (6-1) also capped a Flint Metro League title, in the Stars division, after finishing second a year ago. Brandon fell to 4-3. Marysville 19, St. Clair 13 Marysville (6-1) finished a perfect run through the Macomb Area Conference Silver to claim its first league title since 2016 and send St. Clair to 5-2.
Greater Detroit
HEADLINER Utica Eisenhower 21, Macomb Dakota 14 Eisenhower (6-1) bounced back from a Week 6 loss to earn a share of the Macomb Area Conference Red championship for the second-straight season, with quarterback Jack Bullock scoring the go-ahead touchdown late to also give the Eagles their second-straight win over Dakota (6-1). The Cougars shared the title after tying for third a year ago. Click for more from the Macomb Daily.
Check out the best moments from this Gametime Live Matchup between the Macomb Dakota Cougars and the Utica Eisenhower Eagles from October 11th, 2024.@DakotaFootball | @IkeVEagles1
In collaboration with Shelby TV
Powered by @lawrencetechu | @salmich | @altaequipment | @MHSAA… pic.twitter.com/vwhjlMw0O3— STATE CHAMPS! Michigan (@statechampsmich) October 14, 2024
Watch list Oxford 38, West Bloomfield 14 This victory, combined with Lake Orion’s 20-13 win over Clarkston, made Oxford (5-2) the outright Oakland Activities Association Red champion. The Red remains one of the most competitive leagues in the state, and this was Oxford’s first league title since sharing the Flint Metro League championship in 2010.
On the move Macomb Lutheran North 30, Riverview Gabriel Richard 22 Lutheran North (6-1) clinched a share of a second-straight Catholic High School League Intersectional #1 title by handing Gabriel Richard (6-1) its only defeat this fall. Walled Lake Western 37, Milford 0 Western (7-0) posted its third Lakes Valley Conference shutout to move into first place alone and sent Milford (5-2) into a tie for second. Warren Michigan Collegiate 54, Romulus Summit Academy North 13 Michigan Collegiate (6-1) handed Summit (5-1) its lone loss, clinching a share of the Charter School Conference Gold title as it seeks a ninth-straight outright league championship. Grosse Pointe North 42, Warren Fitzgerald 34 GPN (4-3) forced a three-way MAC Gold championship between these two and Madison Heights Lamphere. Trenton 13, Allen Park 6 It’s unlikely Trenton will end up with a share of the Downriver League title, but for a second-straight week it handed the first loss to a contender, this time sending Allen Park to 6-1.
Mid-Michigan
HEADLINER Ithaca 42, Saginaw Nouvel Catholic Central 19 Ithaca ran its league championship streak to 16 with this outright clincher in the Tri-Valley Conference Blue, and added to a 20-game league winning streak by handing Nouvel (6-1) its first defeat this fall. The Yellowjackets (7-0) can complete a second-straight undefeated regular season with wins over Tecumseh and Shepherd. Click for more from the Mount Pleasant Morning Sun.
Watch list Howell 35, Novi 21 By winning this matchup of co-leaders, Howell (7-0) clinched a share of the Kensington Lakes Activities Association West title and sent Novi (5-2) into a tie for second with this week’s opponent Brighton. The Highlanders also tied their number of wins from the last two seasons combined.
On the move East Lansing 39, Lansing Everett 26 The Trojans (4-3) bounced back from two straight losses to hand Everett (5-2) its second and move up to No. 13 on the Division 2 playoff list. Haslett 35, St. Johns 14 Haslett (4-3) was another of the state’s biggest risers this week, moving up 12 spots to No. 21 in Division 4 with this win over Division 3 St. Johns (5-2). Central Montcalm 54, Lakeview 6 Central Montcalm (6-1) clinched a share of the Central State Activities Association Silver title and has won its first three league games by a combined 139-14 score. The six victories are the team's most since 2019.
Northern Lower Peninsula
HEADLINER Petoskey 28, Marquette 23 Petoskey (7-0) clinched a share of the Big North Conference championship, its first since 2014, by holding off Marquette (5-2) in a matchup of league co-leaders entering the night. The Northmen also surpassed their six wins from a year ago and guaranteed their most since 2015. Click for more from the Petoskey News-Review.
Watch list McBain 36, Evart 29 McBain (7-0) clinched a share of the Highland Conference title, its first since 2020, and can claim it outright this weekend against LeRoy Pine River. The Ramblers have reached 35 points in all but one game, trending toward their best offensive output in more than a decade.
On the move Frankfort 27, Muskegon Catholic Central 24 Frankfort (6-1) is holding steady at No. 15 on the Division 8 playoff list after this close win over MCC, which although 1-5 has lost three games by five points or fewer. Traverse City West 30, Mount Pleasant 13 The Titans (4-3) kept their playoff hopes alive in breaking a three-game losing streak, moving up to No. 28 on the Division 2 list. Mount Pleasant (4-3) is No. 24 in Division 3. Charlevoix 44, Mancelona 14 The Rayders (5-2) will carry a four-game winning streak into this week’s matchup with Tawas as they look to complete a second-straight outright league title run. Mancelona (3-4), meanwhile, is hanging on at the No. 30 spot on the Division 8 playoff list.
Southeast & Border
HEADLINER Monroe St. Mary Catholic Central 37, Flat Rock 14 A strongly-contested race in the Huron League will go at least partially to SMCC (7-0), as the Falcons claimed a share with this win after defeating Riverview in Week 6. The league title is their first since 2015 and in part the product of a defense that’s given up just 37 points over six league games; both Riverview and Flat Rock (5-2) are averaging 42 or more this fall, but they scored 15 and 14, respectively, the last two weeks. Click for more from the Monroe News.
Check out the highlights of Monroe Saint Mary Catholic Central's win over Flat Rock on Military Appreciation Night from October 11th, 2024. The Falcons won 37-14 and remains undefeated at 7-0 on the season. Powered by @miarmyguard@AthleticsSMCC | @SMCCMonroe pic.twitter.com/4hYfmoiYuo
— STATE CHAMPS! Michigan (@statechampsmich) October 13, 2024
Watch list Jackson Lumen Christi 35, Traverse City St. Francis 7 Lumen Christi (6-1) built on its recently-clinched CHSL AA championship with this impressive win over the Gladiators, their Division 7 championship game opponent in 2022 and the leaders in the Northern Michigan Football League Legends this fall.
On the move Grass Lake 54, Manchester 46 Grass Lake (4-3) helped make Leslie’s title share in the Cascades Conference East an outright championship by knocking Manchester (5-2) out of contention. Chelsea 35, Jackson 0 Chelsea (6-1) finished its second-straight perfect run through the Southeastern Conference White with their second shutout in five league games. Pinckney 21, Adrian 10 Pinckney (3-4) entered this season after going 0-9 a year ago and then lost the first four games of this fall. But the Pirates have won their last three and moved into the No. 32 spot on the Division 4 playoff list.
Southwest Corridor
HEADLINER Union City 45, Springport 21 The Big 8 Conference grew back to eight teams this season, but the top of the standings may not change as Union City (7-0) clinched a share of a third-straight championship and can finished it outright this week against winless Quincy. Springport (6-1) scored the most points Union City had given up this season, but the Spartans also allowed their most this fall to a Chargers team averaging 37 per game. Click for more from the Coldwater Daily Reporter.
Watch list Parchment 51, Constantine 30 Parchment (6-1) will play Kalamazoo United this week in a winner-take-all matchup for the Southwestern Athletic Conference Lakeshore title, and reigning champion Constantine (5-2) will not be part of a league title mix for the first time since 2018. Parchment had lost six straight to Constantine, including 46-0 a year ago.
On the move Berrien Springs 22, Dowagiac 20 After taking a 22-6 lead into halftime, Berrien Springs (4-3) held off Dowagiac’s comeback push to clinch a share of a second-straight Lakeland Athletic Conference title, with an opportunity to clinch outright again this week against winless Benton Harbor. Portage Central 23, Portage Northern 6 This rivalry win for Portage Central (5-2), combined with Mattawan’s 24-7 upset of St. Joseph, gave the Mustangs a share of the Southwestern Michigan Athletic Conference West title – with an opportunity to make it outright against the Bears (6-1) in Week 9. Schoolcraft 56, Saugatuck 7 These two entered as co-leaders in the SAC Valley, and Schoolcraft (6-1) finished Friday as a champion, earning a share with Saugatuck (5-2) falling into a tie for second place. Battle Creek Harper Creek 32, Hastings 0 Harper Creek (6-1) handed Hastings (6-1) its first loss and also broke the Saxons’ 20-game winning streak in the Interstate 8 Athletic Conference. The Beavers are alone in first with two league games to play.
Upper Peninsula
HEADLINER Menominee 34, Negaunee 19 Menominee (7-0) did its part to set up this week’s matchup with Kingsford as a winner-take-all for the Western Peninsula Athletic Conference Copper title, ending 2023 co-champion Negaunee’s chances to grab a share. The Maroons had lost their two recent matchups with the Miners, 47-20 a year ago and 44-0 in a 2022 Division 6 District Final. Click for more from the Eagle Herald.
Watch list Houghton 42, Gladstone 17 The Gremlins (3-4) stormed back after two straight losses to avenge last season’s to Gladstone and pull within two spots of getting into the Division 5 playoff field after falling to No. 38 the previous week. Houghton finishes with Negaunee and Hancock and has defeated the latter this season.
On the move Iron Mountain 40, Bark River-Harris 7 The Mountaineers (7-1) defeated their toughest West-PAC Iron opponent in Bark River-Harris (4-3) to clinch a share of the league title, their second in two years in that division. West Iron County 20, L’Anse 14 The Wykons (3-4) finished a season sweep of L’Anse to pull within five spots of making the Division 8 playoff field. Manistique 36, Gwinn 0 Manistique (4-3) posted a second-straight shutout to climb to No. 28 on the Division 8 playoff list.
West Michigan
HEADLINER Grand Rapids Northview 12, Grand Rapids Catholic Central 3 This matchup was for a share of the championship in the Ottawa-Kent Conference Black, and as such carried lofty expectations. But the result still created a degree of stunning as Northview (7-0) handed the Cougars (5-2) just their second league loss over the last eight seasons. Both defenses were impressive to say the least; Northview entered the game averaging 47 points per game, and Catholic Central was averaging 28 ppg after three straight games scoring 35 or more. Click for more from the Grand Rapids Press.
Check out the highlights of Grand Rapids Northview's win over Grand Rapids Catholic Central on October 11th, 2024. 🎥 WXMI-TV | @MHSAA | @SportsWildcats pic.twitter.com/jqjZWQ8yLg
— STATE CHAMPS! Michigan (@statechampsmich) October 12, 2024
Watch list Grand Rapids West Catholic 24, Ada Forest Hills Eastern 23 The Falcons (5-2) clinched a share of the O-K White title as Landon Smith booted a 38-yard field goal for the winning points. FHE (5-2) moved into a tie for second place but will be rooting this week for Hamilton, also tied for second and West Catholic’s opponent this week.
On the move Big Rapids 41, Newaygo 20 The Cardinals (6-1) finished a perfect run through the CSAA Red, avoiding a three-way championship that would have resulted from a win by Newaygo (5-2). Hudsonville Unity Christian 50, Grand Rapids South Christian 21 Unity (7-0) earned a share of the O-K Gold title in its first matchup with South Christian (4-3) since losing to the Sailors in a 2022 District Final. North Muskegon 40, Ravenna 0 North Muskegon (6-1) is undefeated in the West Michigan Conference Rivers since the league split into two divisions three seasons ago, and this clinched a third-straight league title for the Norsemen as a win by Ravenna (4-3) would have created a three-way tie for first.
8-Player
HEADLINER Gobles 20, Martin 14 This one met every expectation, as Gobles won a matchup of undefeated rivals to claim the Southwest Michigan 8-Man Football League Red championship outright and avenge a Regional Finals loss to the Clippers (5-1) from a year ago. Gobles (7-0) had entered ranked No. 5 in the Division 1 coaches poll, while Martin was No. 3. Click for more from the Kalamazoo Gazette.
Watch list Fulton 24, Portland St. Patrick 20 The Pirates (6-1) will finish as at least co-champions of the Mid-State Activities Conference Red after handing this first loss to the Division 2 top-ranked Shamrocks (6-1). This may be turning into quite a series, as St. Patrick won their two meetings in 2023 by a combined 11 points.
On the move Deckerville 44, Kingston 0 Despite all the scenarios that could have created co-champions in the Big Thumb Conference Blue over the last few weeks, Deckerville (7-0) answered with authority and its second-straight shutout when a Kingston win would have meant a three-way title share. Climax-Scotts 36, Bellevue 6 Climax-Scotts (6-1) will face Mendon this week for the Southern Central Athletic Association Red outright championship after sending Bellevue (4-3) out of title share contention. Alcona 74, Whittemore-Prescott 16 Alcona (7-0) moved into the No. 1 spot in the Division 1 coaches ranking last week and rolled through clinching a share of the North Star League Big Dipper title with this victory.
MHSAA.com's weekly “1st & Goal” previews and reviews are powered by MI Student Aid, a division within the Department of Lifelong Education, Advancement, and Potential (MiLEAP). MI Student Aid encourages students to pursue postsecondary education by providing access to student financial resources and information. MI Student Aid administers the state’s scholarship and grant programs that help make college Accessible, Affordable and Attainable for you. Click to connect with MI Student Aid and find more information on Facebook and Twitter @mistudentaid.
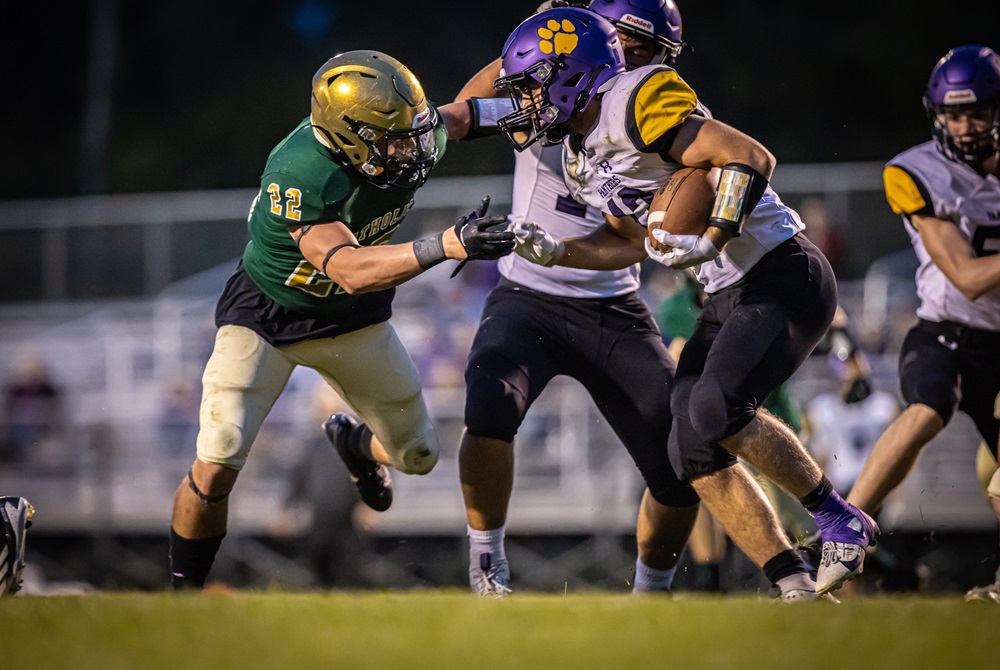
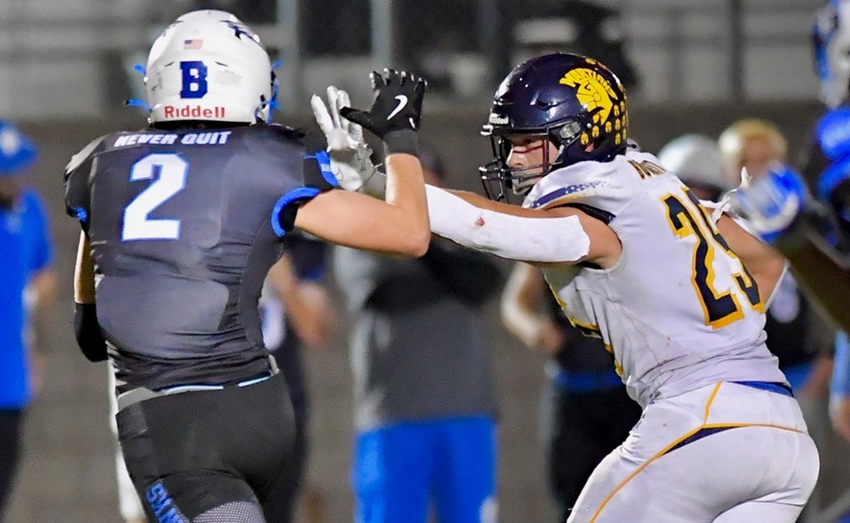
PHOTOS (Top) A Frankfort ball carrier, right, and Muskegon Catholic Central defender prepare to collide near the line of scrimmage Friday. (Middle) Goodrich's Chase Burnett (25) puts up a stiff arm as an Ortonville Brandon defender attempts to catch him. (Top photo by Tim Reilly. Goodrich/Brandon photo by Terry Lyons.)