
2017-18 Report Shows Fewer Concussions
August 8, 2018
By Geoff Kimmerly
Second Half editor
Concussions are down, according to data compiled by the Michigan High School Athletic Association during its third year of collecting head injury reports from member high schools.
The work is not done – but this year’s data reinforces trends that emerged during the first two years of reporting and will assist the MHSAA as it explores solutions to continue reducing the incidence of head injuries in school sports.
The 2017-18 concussion report found a 9.6-percent decrease in the number of confirmed concussions from the previous year. Student-athletes at MHSAA member high schools encountered during 2017-18 a total of 3,580 head injuries – or 4.8 per member school, compared to the 2016-17 average of 5.2. Total participation in MHSAA sports for 2017-18 was 284,920 – with students counted once for each sport he or she played – and only 1.3 percent of participants experienced a head injury, down from 1.4 in 2016-17 and 1.6 percent the first year of the study.
As first mandated in 2015-16, member schools are required to report head injuries to the MHSAA identifying the sport that each student-athlete was participating in and whether the injury was sustained during practice or competition. Schools also are required to designate at which level – varsity, junior varsity or freshman – the injury occurred.
The full report of all head injuries experienced during 2017-18 by student-athletes at MHSAA member high schools – including percentages by sport (per 1,000 participants), gender and team level, as well as data tracking when athletes returned to play – is available by clicking here.
Consistent with the first two years of the study, the MHSAA received data from more than 99 percent of its member high schools after the fall, winter and spring seasons and continued to track each injury report through its conclusion this summer. Member junior high and middle schools also were allowed, although not mandated, to report their potential head injuries; and those findings are not part of the published report.
The decrease in overall head injury reports collected for 2017-18 follows a similar reduction from 2015-16 to 2016-17 – and brings the total decrease to 19.6 percent fewer reports since the first year of the study.
MHSAA Executive Director John E. “Jack” Roberts noted that the decreases in reports, both year to year and since the first year of the survey, likely have some relation to year-to-year fluctuation, refinement of the follow-up reporting process and a better understanding by schools of what is not to be included for the survey – including head injuries not diagnosed as concussions and head injuries that did not take place during MHSAA-sponsored activities.
However, the findings of this year’s study – and their similarities to the findings from the first two surveys – has begun to clarify the identification and understanding of trends. Continuing to emerge perhaps most prominently is the higher incidence of concussion reports from girls sports – and pertinent questions about physiological and social causes behind those results.
“With three years of reporting by virtually 100 percent of our high schools, what we’re learning is no longer anecdotal; the results are beginning to identify valid trends and genuine issues that need to be addressed,” Roberts said. “For example, it’s even clearer than before that girls are reporting three times the number of concussions as boys when comparing similar sports – soccer, basketball and baseball versus softball. As a result, we’ve already begun to incorporate these gender differences into our coaches education, and the writers of high school playing rules are obligated to focus on these gender differences as well.”
Although the total number of confirmed concussions was significantly lower again in 2017-18, a number of findings detailing those injuries fell in line with results of the first two surveys.
Boys experienced 2,373– or 66 percent – of those injuries, the same ratio as 2016-17, and not surprisingly as boys have a much higher participation in contact sports. More than half of head injuries – 56 percent – were experienced by varsity athletes, which for the second year also fell within a percent difference of the previous year’s findings.
A total of 2,330 head injuries – or 65 percent – came in competition as opposed to practice. More than half took place during either the middle of practice or middle of competition as opposed to the start or end, and 52 percent of injuries were a result of person-to-person contact. The MHSAA also asked schools to report the number of days between the head injury and the athlete’s return to activity – and the two largest groups, both at 24 percent, returned to activity after either 6 to 10 days of rest or 11 to 15. All of these findings were within 1-3 percent of those discovered from the 2016-17 data.
Contact sports again revealed the most head injuries. Ranking first was football, 11 and 8-player combined, with 41 head injuries per 1,000 participants – a decrease for the second straight year, this time from 44 head injuries per 1,000 participants in 2016-17 and down from 49 head injuries per 1,000 football participants shown by the first study in 2015-16.
Ice hockey repeated with the second-most injuries per 1,000, with 32 (down from 36 injuries per 1,000 from 2016-17 and 38 per 1,000 in 2015-16), and girls soccer and wrestling tied for third with 25 head injuries per 1,000 participants – girls soccer down from 28 head injuries per 1,000 participants and wrestling down from 26 per 1,000 in 2016-17.
Also consistent with 2016-17, the next five sports (after football and hockey) to show the highest incidences of head injuries were girls sports – girls soccer followed by girls basketball (22 per 1,000), girls competitive cheer (20) and girls lacrosse (20). Boys lacrosse (17), girls gymnastics (16) and boys soccer (12) were the only other sports to show double-digit head injuries per 1,000 participants.
Females again reported significantly more concussions than males playing the same or similar sports – soccer, basketball and baseball/softball. Female soccer players reported more than double the concussions per 1,000 participants as male soccer players (25 to 12), while female basketball players also reported more than double the number of concussions per 1,000 participants (22 to 9). Softball players reported seven concussions per 1,000 participants, and baseball players reported three per 1,000. Although the percentage differences vary from year to year, the results of all three comparisons remained consistent with what the survey found in 2015-16 and 2016-17.
The MHSAA in 2018-19 is directing its sport committees to focus on a pair of questions – how to increase participation and how to make their specific sports safer – the latter aiming to put some of what has been learned from concussion reporting into practice. The MHSAA also is continuing to invite Michigan’s universities, health care systems and the National Federation of State High School Associations (NFHS) to take part in analyzing the data and resulting questions that have arisen during the past three years.
“Regrettably, I do not see a nationwide head injury reporting effort likely,” Roberts said. “First, it’s hard to coordinate 50 states’ efforts. And second, if left to medical professionals, the survey tool might become so cumbersome that schools would be reluctant to participate – and certainly, it would not get the 99.9 percent cooperation that we’ve enjoyed from schools over these three years.”
Schools report possible concussions online via the MHSAA Website. Reports are then examined by members of the MHSAA staff, who follow up with school administrators as those student-athletes continue to receive care and eventually return to play. Student privacy is protected.
The reporting of possible concussions is part of a three-pronged advance by the MHSAA in concussion care begun during the 2015-16 school year. The MHSAA completed in spring 2017 the largest-ever state high school association sideline concussion testing pilot program, with a sample of schools from across the state over two years using one of two screening tests designed to detect concussions. The MHSAA also was the first state association to provide all participants at every member high school and junior high/middle school with insurance intended to pay accident medical expense benefits – covering deductibles and co-pays left unpaid by other policies – resulting from head injuries sustained during school practices or competitions and at no cost to either schools or families.
Previously, the MHSAA also was among the first state associations to adopt a return-to-play protocol that keeps an athlete out of activity until at least the next day after a suspected concussion, and allows that athlete to return to play only after he or she has been cleared unconditionally for activity by a doctor (M.D. or D.O.), physician’s assistant or nurse practitioner.
In addition, the MHSAA’s Coaches Advancement Program – which includes courses that must be completed by all varsity head coaches hired for the first time at a member school – provides substantial instruction on concussion care. Separately, rules meetings that are required viewing for high school varsity and subvarsity head and assistant coaches at the start of each season include detailed training on caring for athletes with possible head injuries.
Detroit Public Schools' McEvans Selected for MHSAA Women In Sports Leadership Award
By
Geoff Kimmerly
MHSAA.com senior editor
January 22, 2026
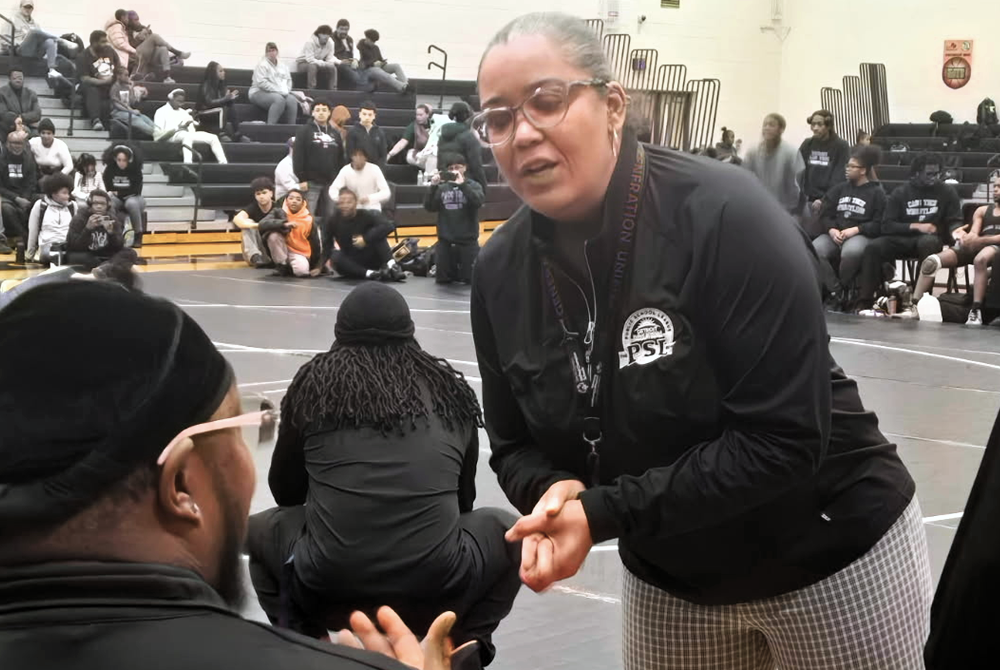
Over nearly three decades as a coach, school and league administrator, Anika McEvans has worked to provide the athletic opportunities for all children that she enjoyed as an athlete herself and later as a mother of three including two who have gone on to play at the collegiate level.
Her work in several roles, serving multiple school districts over nearly 28 years, has benefited thousands of students. In recognition of those contributions, McEvans has been named the 40th recipient of the MHSAA’s Women In Sports Leadership Award.
Each year, the Representative Council considers the achievements of women coaches, officials and athletic administrators affiliated with the MHSAA who show exemplary leadership capabilities and positive contributions to athletics. McEvans will receive her award during the WISL Conference Banquet, Feb. 1 at the Crowne Plaza Lansing.
 Currently midway through her seventh school year serving in the Office of Athletics for the Detroit Public Schools Community District, she is responsible for planning and implementation of the Detroit Public School League’s sports offerings for 72 elementary and middle schools in addition to her several responsibilities supporting the league’s 20 high schools. McEvans came to the PSL from Southfield Public Schools, where as district director she supervised more than 100 coaches, staff and volunteers.
Before that she was a building athletic director, and prior to becoming an administrator she coached multiple sports across tenures at three schools.
“Obviously as an athlete myself, and also the mother of female athletes, my children and I both were very fortunate to have amazing coaches and administrators who elevated our sports,” McEvans said. “I made it a goal of mine everywhere I go to advocate in the same way. I want any child to have what I’d want for my children.”
A basketball, volleyball and softball player while a student at Detroit Renaissance, McEvans returned to high school athletics after college first as a coach, serving as head girls varsity basketball coach at Detroit Academy of Arts & Sciences, assistant boys basketball and softball coach at Renaissance, and assistant girls basketball coach at Southfield.
She served as athletic director from 2012-15 at the former Southfield High School, and as district athletic director through 2017-18 she assisted in the merger of Southfield High and Southfield-Lathrup into Southfield Arts & Technology High School for the start of the 2016-17 school year.
Also during her time at Southfield, McEvans added competitive cheer to the school’s athletic offerings, and then brought the sport to the PSL after moving to the Detroit district office. Cass Tech, Martin Luther King and Renaissance high schools have added competitive cheer teams, and McEvans is hopeful two more schools will do the same over the coming year.
“Anika McEvans continues to create and expand opportunities so as many students as possible can enjoy all of the good that comes with participation in school sports,” MHSAA Executive Director Mark Uyl said. “This award celebrates Anika’s leadership in this way, but also the example she sets in showing what’s possible when someone is driven to make a difference.”
McEvans received an MHSAA Allen W. Bush Award in 2024, celebrating her work often “behind the scenes” in school sports. She was selected for a Skillman Foundation Visionary Award this past year for her work “updating and upgrading the education system in Detroit and beyond.”
She has contributed her expertise to statewide athletics in many ways as well, serving on several MHSAA committees including athletic equity, junior high/middle school, scholar-athlete and as part of multiple officials and site selection committees. She also provided a key voice as part of the MHSAA Multi-Sport Task Force during the last half of the last decade and has played a leading role in providing coaches education throughout Detroit Public Schools through the MHSAA Coaches Advancement Program.
McEvans graduated from Renaissance in 1994 and went on to earn a bachelor's degree in sports management and communications from University of Michigan and a master’s in business administration from the University of Detroit Mercy. She also previously served as director of business operations and then general manager for the Detroit Demolition/Detroit Danger women’s professional football franchise from 2002-06 and as assistant general manager for the Motor City Mechanics minor league hockey team from 2004-06.
Her daughter Cheyenne McEvans is currently a graduate student playing her final season of college basketball at University of Nevada. Son Cameron McEvans played basketball at Lawrence Technological University and most recently professionally in Uruguay. Youngest daughter Cierra McEvans participated on West Bloomfield’s competitive cheer team and is now a sophomore at Grand Valley State University.
“I know how for young men and women that participate in sports, that it rounds out their development, gives them leadership skills and confidence to move through the world,” Anika McEvans said. “I was telling someone the other day that because of their successes and failures on the court, I knew my children would move through the world fearlessly.
“I (also) know in my particular role (at DPSCD) and also to a certain degree at Southfield, there are still gaps in how minority students and programs are supported … (and helping fill that gap) is just my mission.”
More than 700 participants – mostly female high school student-athletes from across the state – have registered to attend this year’s sold-out WISL Conference, the 27th in the series that remains the first, largest and longest-running program of its type in the country.
The opening address Feb. 1 will be presented by Kristen Kelsay, a two-time team captain during her playing career for the Michigan State University women’s volleyball team who recently completed her first season as the Spartans’ head coach and led the team to its highest win total since 2017. MSU women’s basketball coach Robyn Fralick – in her third season and leading a Spartans team that is 17-2 and ranked No. 13 by The Associated Press – will speak during the general session at the start of the Feb. 2 conference schedule.
Several workshops will be offered over the two days, with topics including coaching, teaching and learning leadership; sports nutrition and performance, and empowerment and goal-setting. Presenters are accomplished in their fields and represent a wide range of backgrounds in sport. A complete itinerary is available on the Women In Sports Leadership page.
The first Women In Sports Leadership Award was presented in 1990.
Past recipients
1990 – Carol Seavoy, L’Anse
1991 – Diane Laffey, Harper Woods
1992 – Patricia Ashby, Scotts
1993 – Jo Lake, Grosse Pointe
1994 – Brenda Gatlin, Detroit
1995 – Jane Bennett, Ann Arbor
1996 – Cheryl Amos-Helmicki, Huntington Woods
1997 – Delores L. Elswick, Detroit
1998 – Karen S. Leinaar, Delton
1999 – Kathy McGee, Flint
2000 – Pat Richardson, Grass Lake
2001 – Suzanne Martin, East Lansing
2002 – Susan Barthold, Kentwood
2003 – Nancy Clark, Flint
2004 – Kathy Vruggink Westdorp, Grand Rapids
2005 – Barbara Redding, Capac
2006 – Melanie Miller, Lansing
2007 – Jan Sander, Warren Woods
2008 – Jane Bos, Grand Rapids
2009 – Gail Ganakas, Flint; Deb VanKuiken, Holly
2010 – Gina Mazzolini, Lansing
2011 – Ellen Pugh, West Branch; Patti Tibaldi, Traverse City
2012 – Janet Gillette, Comstock Park
2013 – Barbara Beckett, Traverse City
2014 – Teri Reyburn, DeWitt
2015 – Jean LaClair, Bronson
2016 – Betty Wroubel, Pontiac
2017 – Dottie Davis, Ann Arbor
2018 – Meg Seng, Ann Arbor
2019 – Kris Isom, Adrian
2020 – Nikki Norris, East Lansing
2021 – Dorene Ingalls, St. Ignace
2022 – Lori Hyman, Livonia
2023 – Laurie Glass, Leland
2024 – Mary Cicerone, Bloomfield Hills; Eve Claar, Ann Arbor
2025 – Jennifer Thunberg, Freeland