Girls Events Set Attendance Record
September 17, 2015
By Geoff Kimmerly
Second Half editor
Michigan High School Athletic Association girls postseason events enjoyed record attendance for the second straight school year in 2014-15 as nearly 1.4 million fans total took in tournament events for which attendance is recorded.
Total attendance for 2014-15 was 1,389,209 fans, with 926,099 at boys tournaments and 463,110 spectators at girls events. Attendance is kept for all sports except golf, skiing and tennis, for which admission typically is not charged.
That total was down 31,518 fans, or 2.2 percent, from 2013-14. But that decrease was due mostly to a 20 percent drop in football attendance stemming from an uncharacteristically cold and snowy weekend for Pre-District games, and despite a slight uptick in MHSAA Finals attendance (53,494) in the sport for the second straight season to its highest total since 2011.
Attendance for Pre-District football games was down 45,663 fans (33 percent) from the same round of the 2013 Playoffs – although that one-weekend deficit was made up partially by an increase of 28,550 fans (6.6 percent) at girls events over the previous school year.
Two girls sports – competitive cheer and volleyball – plus the combined girls and boys bowling tournament set attendance records during 2014-15. Volleyball set a an overall attendance record for the second straight season, with 110,931 fans, and also set records at the MHSAA District and Regional levels. Cheer set records at the District and Finals levels and overall with 31,284 fans for the tournament – an increase of 20 percent over the 2013-14 season. Bowling set an overall attendance record for the fourth straight season, this time with 13,298 fans.
A number of other sports continued promising trends. The Baseball and Softball Finals, which showed a 29-percent increase from the previous year after moving to Michigan State University in 2014, experienced another boost this spring. The Girls Soccer Finals also moved to MSU, which attracted more fans total to the site that weekend; however, the combined attendance for Baseball, Softball and Girls Soccer Finals (16,310 fans) this spring was 29 percent higher than the 2014 combined total when girls soccer championship games were played at two other sites.
Baseball and Softball Regionals experienced their highest turnouts since the 1995 season, with baseball setting a record for that round with 12,297 fans. Girls Soccer Regionals also set a record with 11,228 in attendance. All three sports saw overall postseason attendance increases from the spring 2014 to 2015 seasons.
Both girls and boys basketball also enjoyed postseason attendance increases for the 2014-15 season; girls basketball had its most fans (171,665) since 2005-06, while the boys (320,908) welcomed the most since 2011-12. Boys soccer postseason games attracted 34,795 fans, up 20 percent from 2013 and the most since the 2008 season, and wrestling experienced upticks at both championship levels – the Team Finals attendance of 29,564 was the highest since 2011, and the Individual Finals total of 49,215 was that event’s highest since 2012. Boys swimming and diving and the combined track and field tournaments also enjoyed increased tournament attendance from the previous school year.
Rally Champs 'Survive' Fun-Filled Forest
August 19, 2013
By Geoff Kimmerly
Second Half editor
As one of Michigan’s top high school swimming sprinters, Fenton senior Gabbi Haaraoja no doubt was in strong shape to start this summer.
But she and her Tigers teammates made sure to prepare for this month’s preseason “survival trip” with plenty of miles running and yards swimming a local lake.
All that training paid off during three days and two nights at Pigeon River Country State Forest near Vanderbilt as the team prepared for last week’s first day of practice and a run at a 10th-consecutive league championship.
And the Tigers have kicked off the title effort by being named winners of the MHSAA’s inaugural Prep Rally, a contest that was part of the MHSAA’s PLAY (Preparation Lasts All Year) initiative to encourage athletes to remain active during the offseason so they are prepared physically and acclimated to warm weather when practice begins in the fall.
“Being out in nature, it’s really pretty there. You appreciate it more,” Haaraoja said, then adding some tongue-in-cheek. “It definitely was fun. But it was a lot more work than what we were used to. I think I’m actually glad I’m a senior.”
 Athletes from Grosse Pointe Woods University Liggett and Beal City also were finalists. Participating athletes from Fenton’s girls swimming and diving team will receive tickets to an MHSAA Final of their choice, where they will be recognized for their achievement.
Fenton has taken similar training trips heading into all 14 seasons under coach Brad Jones. Others have included activities like canoeing and dune climbing, The last four years, the team journeyed to El Cortez Beach Resort in Oscoda for some time on Lake Huron together before practice began.
This season’s seniors asked to do something new. And it was a new experience for many in more ways than one.
The team left Aug. 11 and returned home two days later in time for the first day of practice. Jones took north 24 athletes, and some had never camped or slept outside. Six seniors made their fourth preseason trip with the team – but for 12 freshmen, this was their first experience as high schoolers.
That team demographic made this summer’s trip especially important for bonding. But it also had a desired effect physically – both heading into this fall and in setting preparation expectations for the future.
Pigeon River Country has 67 miles of trails, and the team hiked four or more miles between camp sites each day – making this the most physically taxing of the trips any of the Tigers had been on to start swimming and diving season.
“We were very up front that in August we’re taking this trip, and you need to be able to go 6-7 miles walking. We put that out there early on,” Jones said. “We have pretty good girls doing what they’re needing to do outside of (swimming) training. (But) we were pretty up front that you don’t put your backpack on and your hiking shoes on for the first time in August.”
Haaraoja said the hikes made it obvious quickly who had prepped during the summer and who needed to catch up. Seniors rotated throughout the line of teammates, so those who began a hike leading the group finished at the back with those working harder to keep in step.
Once in the woods, Jones split his athletes into four teams for a series of challenges that included building their own fires, cooking their own meals (they didn’t receive food until the fire was started) and breaking camp the next day. One trail ran past a small lake, and the athletes swam across it in a relay to earn more points. Another relay-type event involved filling buckets with water.
The challenge champions received ice cream.
“By the time we get home, everybody knows everybody else,” Jones said. “Once we get into training, the top girls are in one lane and the beginners are in another. So there’s not a lot of interaction. But this gives the whole team a chance to get to know each other.”
That’s the part Haaraoja said she’ll remember most fondly, while also appreciating the edge the added physical activity of the summer prep and trip should give the team this fall and in years to come.
“For the underclassmen, they realized where they should be at the beginning of the season next year so they don’t come into it completely out of shape,” Haaraoja said. “It helped our underclassmen learn what our goals were. They know what they’re working for.”
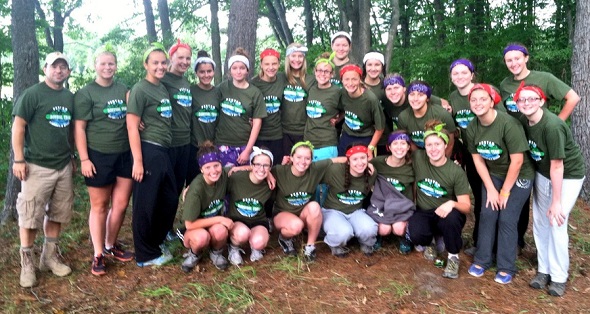
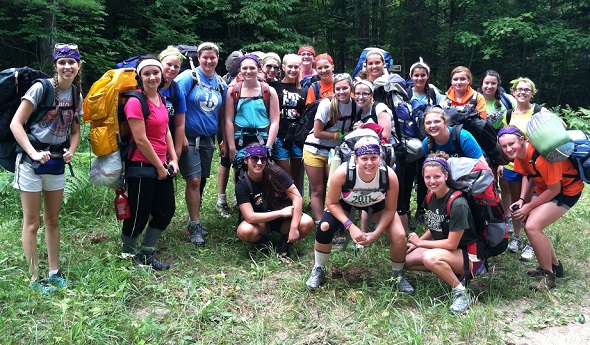
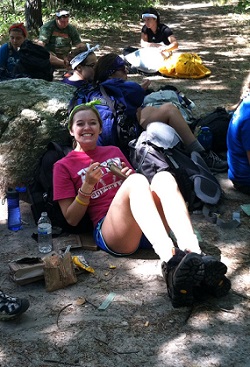
PHOTOS: (Top) Fenton's girls swimming and diving athletes take a moment for a photo during their three-day "survival trip." (Middle) The Tigers take a quick lunch break during a hike at Pigeon River Country State Forest. (Below) The Fenton athletes pose for one more photo wearing their "survivor" T-shirts. (Photos courtesy of Fenton coach Brad Jones.)