

Girls Events Set Attendance Record
September 17, 2015
By Geoff Kimmerly
Second Half editor
Michigan High School Athletic Association girls postseason events enjoyed record attendance for the second straight school year in 2014-15 as nearly 1.4 million fans total took in tournament events for which attendance is recorded.
Total attendance for 2014-15 was 1,389,209 fans, with 926,099 at boys tournaments and 463,110 spectators at girls events. Attendance is kept for all sports except golf, skiing and tennis, for which admission typically is not charged.
That total was down 31,518 fans, or 2.2 percent, from 2013-14. But that decrease was due mostly to a 20 percent drop in football attendance stemming from an uncharacteristically cold and snowy weekend for Pre-District games, and despite a slight uptick in MHSAA Finals attendance (53,494) in the sport for the second straight season to its highest total since 2011.
Attendance for Pre-District football games was down 45,663 fans (33 percent) from the same round of the 2013 Playoffs – although that one-weekend deficit was made up partially by an increase of 28,550 fans (6.6 percent) at girls events over the previous school year.
Two girls sports – competitive cheer and volleyball – plus the combined girls and boys bowling tournament set attendance records during 2014-15. Volleyball set a an overall attendance record for the second straight season, with 110,931 fans, and also set records at the MHSAA District and Regional levels. Cheer set records at the District and Finals levels and overall with 31,284 fans for the tournament – an increase of 20 percent over the 2013-14 season. Bowling set an overall attendance record for the fourth straight season, this time with 13,298 fans.
A number of other sports continued promising trends. The Baseball and Softball Finals, which showed a 29-percent increase from the previous year after moving to Michigan State University in 2014, experienced another boost this spring. The Girls Soccer Finals also moved to MSU, which attracted more fans total to the site that weekend; however, the combined attendance for Baseball, Softball and Girls Soccer Finals (16,310 fans) this spring was 29 percent higher than the 2014 combined total when girls soccer championship games were played at two other sites.
Baseball and Softball Regionals experienced their highest turnouts since the 1995 season, with baseball setting a record for that round with 12,297 fans. Girls Soccer Regionals also set a record with 11,228 in attendance. All three sports saw overall postseason attendance increases from the spring 2014 to 2015 seasons.
Both girls and boys basketball also enjoyed postseason attendance increases for the 2014-15 season; girls basketball had its most fans (171,665) since 2005-06, while the boys (320,908) welcomed the most since 2011-12. Boys soccer postseason games attracted 34,795 fans, up 20 percent from 2013 and the most since the 2008 season, and wrestling experienced upticks at both championship levels – the Team Finals attendance of 29,564 was the highest since 2011, and the Individual Finals total of 49,215 was that event’s highest since 2012. Boys swimming and diving and the combined track and field tournaments also enjoyed increased tournament attendance from the previous school year.
Scholars and Athletes 2013: Classes C, D
By
Geoff Kimmerly
MHSAA.com senior editor
February 5, 2013
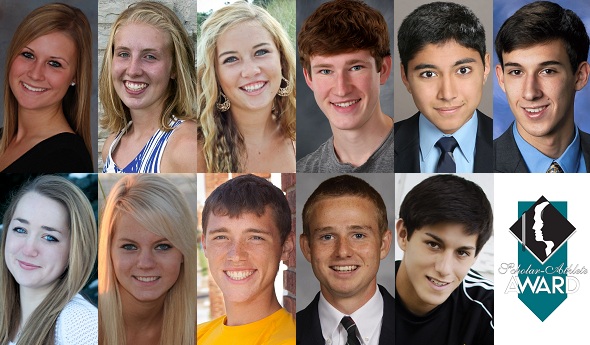
Eleven student-athletes from Michigan High School Athletic Association Class C and D member schools have been selected to receive scholarships through its Scholar-Athlete Award program.
Farm Bureau Insurance, in its 24th year of sponsoring the award, will give a $1,000 college scholarship to 32 individuals who represent their member school in at least one sport in which the Association sponsors a postseason tournament. The first 30 scholarships are awarded proportionately by school classification and the number of student-athletes involved in those classes; also, there are two at-large honorees which can come from any classification.
Each of the scholarship recipients will be honored at halftime ceremonies of the Class C Boys Basketball Final game March 23 at the Breslin Student Events Center in East Lansing. Commemorative medallions will be given to other finalists in recognition of their accomplishments.
The Class C Scholar-Athlete Award honorees are: Kylei Ratkowski, Bronson; Grace Smith, Kalamazoo Hackett; Nicole Winter, Watervliet; Jesse Anderson, Union City; Ashwin Fujii, Ann Arbor Greenhills; Connor Lockman, Royal Oak Shrine.
The Class D Scholar-Athlete Award scholarship recipients are: Elyse Kathleen Lisznyai, Hillsdale Academy; Elena Victoria Luce, Mason County Eastern; Charles Barchett, Watervliet Grace Christian; Chip A. Blood, Hillsdale Academy; Francisco Jay Noyola, Lansing Christian.
Overviews of the scholarship recipients of the Class C Scholar-Athlete Award follow. A quote from each recipient's essay is also included:
Kylei Ratkowski, Bronson. Three-time letterwinner in volleyball and basketball, serving as team captain in both sports. Also won a letter in track and field. Was all-conference and all-area in volleyball as a senior, and also a third-team all-state selection. Was Homecoming Queen in 2012. Class treasurer throughout high school and served for four years on student council, the last two years as vice president. Active in National Honor Society, Varsity Club and 4-H; and served as an officer in all three groups. Volunteers to instruct and officiate in youth girls volleyball and basketball and to work with a local food pantry and visit shut-ins. Plans medical studies at the University of Notre Dame or Michigan State University.
Essay Quote: “Athletics is about more than winning, it is about creating winners with the right attitude. It is about developing athletes that genuinely care about their opponents and do the right thing when put to the test. Sportsmanship is essential to educational athletics and we as athletes and fan of athletics need to do all we can to insure sportsmanship remains a significant part of every game.”
Grace Smith, Kalamazoo Hackett. Will earn her fourth varsity letter in soccer this spring, and also won three varsity letters in basketball. Was captain of basketball team this year, and most valuable of soccer team last spring. An Academic All-State honoree twice in both sports. Has also won all-district and all-league awards twice in soccer. Three-year member of National Honor Society, Student Athletic Advisory Board and Quiz Bowl team at her school. Was president of Student Athletic Advisory Board as a Senior, and Quiz Bowl team was a state finalist last year. Editor of student newspaper and Synthesis Literary Magazine. Has volunteered with Salvation Army, Vacation Bible School and Habitat for Humanity. Plans biology or pre-medical studies in college.
Essay Quote: “We both desperately wanted to win, but we saw the other person was more important than the outcome of the game. We did whatever we could to help our team win, but we did not do it out of hatred for our opponent. When the game was over, our friendship and mutual respect was still intact.”
Nicole Winter, Watervliet. Will earn 15 varsity letters in four different sports – four each in volleyball, basketball and softball; and three in track and field. A team captain and most valuable player in volleyball and basketball; and has earned all-conference honors in all four sports. Will finish basketball career as school record holder in assists and three-point field goals, and will likely top the 1,000-point mark in scoring. Also won Academic All-State award as a junior in basketball. President of school’s Student Council and vice president of the National Honor Society, and was also a class officer three times. Editor of school yearbook and member of newspaper staff; won an award for outstanding achieve as editor of the press association at Girls State. Will attend either Calvin College or Hope College to study communications, English or history.
Essay Quote: “No one will win every game; therefore, it is critical to learn how to conduct yourself after wins and losses. Losing is one of the toughest events to go through, but you learn more from one loss than from one hundred wins.”
Jesse Anderson, Union City. A four-year performer in both cross country and track and field. Helped track team to last three Big Eight Conference titles, and second place finishes at MHSAA Finals. Won all-conference honors as part of two relay teams and in two individual events. Was most valuable on 2012 cross country team. President of his class for three consecutive years, and vice president of National Honor Society. Active as a volunteer with local Red Cross and March of Dimes, and a member of his church youth group and 4-H. Served as editor of school yearbook. Won DAR Good Citizen Award and was twice selected as school Student of the Month. Plans medical studies at Grand Valley State University.
Essay Quote: “To truly know what sportsmanship is, you must be put in situations where being a good sportsman is not the easiest thing to do and making, at times, the unpopular choice to do what is right instead of what is easy.”
Ashwin Fujii, Ann Arbor Greenhills. A team captain in cross country and track and field, winning four varsity letters in both sports. Won All-State honors in cross country as a Junior, and as also an Academic All-State honoree. League champion in 3,200-meter run in track. Also a three-time letterwinner in swimming, where he holds several school records. On the Student Council for four years, elected president as a Senior. Was on the Chess Team and part of the Green Initiative Group for two years. Served as a volunteer swimming coach for kids recovering from cancer therapy. A National Merit Scholar Semifinalists, and a two-time Greenhills School Academic Scholar honoree. Will attend the University of Michigan and study engineering.
Essay Quote: “Just as competing with sportsmanship will make you better, competing without it will do nothing but make you dirtier and more disrespectful. Competitors lacking sportsmanship might win at first, but they won’t improve.”
Connor Lockman, Royal Oak Shrine. Will earn his fourth letter in track and field this Spring to go with four letters in soccer and one letter in cross country. Has served as a team captain in cross country and track and field. An all-league performer in all three sports, was league 800-meter champion the past two years. Has participated in the MHSAA Finals in both cross country and track. Was academic all-state and track team most valuable in 2012. Other school activity involvement includes National Honor Society, Ski Club, Backstage Tech Crew, the Winners Circle leadership forum, and a leader in Kairos. Has also been a youth soccer coach and referee. Will attend Michigan State University to study pre-law.
Essay Quote: “Sportsmanship is turning for the finish line with one hundred meters left and not giving up. Running toward the pain because you are the anchor of your 3,200-meter relay. Second place would not matter that much for you because you have three more opportunities at a championship. Your teammates may not though. You run towards the pain for your teammates and that is true sportsmanship.”
Other Class C girls finalists for the Scholar-Athlete Award were: Alyssa R. Briolat, Ubly; Kara Craig, Schoolcraft; Lindsey Dopheide, Lawton; Margaret Elizabeth Durbin, Boyne City; Macayla Geiner, Hart; Natalie Perry, Sand Creek; Theresa Pickell, Reese; Abigail Radomsky, Kalamazoo Hackett; and Faith Schroeder, Saginaw Michigan Lutheran Seminary.
Other Class C boys finalists for the Scholar-Athlete Award were: Brian Christopher Aldrich, Kalamazoo Hackett; Kenner Broullire, Manistique; Jesse Corbat, Breckenridge; Parker Eldred, Blanchard Montabella; Zachary A. Kerr, Saugatuck; Mike O'Brien, Maple City-Glen Lake; Elliott Rains, Sand Creek; Quinton Rice, Marcellus; and Luke Schaffner, Clinton.
Overviews of the scholarship recipients of the Class D Scholar-Athlete Award follow. A quote from each recipient's essay is also included:
Elyse Kathleen Lisznyai, Hillsdale Academy. Will earn 16 varsity letters in high school career in basketball, cross country, golf and track. Began high school competition in eighth grade because of school’s small enrollment, and won all-state honors in cross country and track in 2008-09. Ran leg of winning 3,200-relay at MHSAA L.P. Division 4 Track & Field Finals in 2010, was part of two medaling relays in 2012. Played in Division 4 Golf Finals five straight years, and finished sixth individually in 2012. Captained golf and track teams. Participated throughout high school in 4-H, Student Council, Drama Club, Chamber Choir and in church youth group. Student Council and National Honor Society officer. Plans to study pre-law at the University of Michigan.
Essay Quote: “As an athlete in the MHSAA, I have dedicated myself to a level of integrity and honesty that manifests itself in my behavior on the field and in the classroom. While I made this commitment as a sportsman, it had taken roots much deeper than in the athletic arena, before I was even old enough to participate in sports. This devotion to the protection of that which is true, good, and beautiful was taught to me as a child by my parents, solidified as a student at Hillsdale Academy, and perpetuated always by a firm belief in God.”
Elena Victoria Luce, Mason County Eastern. Lettered in five sports – basketball, volleyball, softball, soccer and cross country – earning 17 letters. Captained basketball, soccer and volleyball squads; and was all conference in those sports, as well as softball. Academic all-state selection in basketball, and winner of 2012 BCAM Three-Point Shooter’s Challenge at MHSAA Basketball Finals. Class president through middle school and high school. Active in Varsity Club, National Honor Society, Quiz Bowl and yearbook editor. Has been a religious education at her church, and volunteered with the Special Olympics and AYSO Soccer. She plans to pursue a degree in accounting or business in college.
Essay Quote: “Sportsmanship allows our athletic activities to maintain a competitive level, yet, we are still able to remain respectful to our opponents, and we can maintain our dignity. Nobody wants to feel degraded or put down in anything they do, and sports are supposed to be fun and enjoyable. Sportsmanship is important because it allows all of these things to be possible, and displaying these characteristics allows teams and athletics to be successful in anything they do.”
Charles Barchett, Watervliet Grace Christian. Team captain in all three of his sports – baseball, basketball and soccer. All-conference performer in baseball and soccer. Won team most valuable honors in soccer as a goalie and set school single season record for saves in 2012. Academic all-state honoree in baseball. Participated in 4-H and Buddies In Christ throughout high school. Also took part in drama, National Honor Society and Student Council. Volunteers with the Berrien County Youth Fair, his school cafeteria and as statistician for boys basketball team. Plans to attend Bradley University.
Essay Quote: “Actions speak louder than words, and my actions on the field or court exemplify my personal leadership and integrity. In my mind, that leaves me with two options: play with sportsmanship or don’t play at all.”
Chip A. Blood, Hillsdale Academy. Played varsity basketball, golf and soccer throughout high school and lettered in basketball and golf as eighth grader due to school’s small enrollment, earning 14 letters. Team captain, leading scorer and all-conference in all three sports. Has played in MHSAA Lower Peninsula Division 4 Finals in each of the past four years, placing third in 2010 and eighth in 2012. Four-year participant in Knights of Columbus Squires, Student Council, Drama Club and as volunteer with Salvation Army. Played French Horn in school band, participated in National Honor Society and various church activities. Will study economics at the University of Notre Dame.
Essay Quote: “In my participation in athletics, one trait has always been deemed most valuable in a competitor: sportsmanship. Every organization seems to champion this virtue. However, it begs the question: what defines sportsmanship, and why does it matter…four years of high school have answered the question for me, and I have had the pleasure of seeing true sportsmanship exemplified.”
Francisco Jay Noyola, Lansing Christian. Won all-state honors in soccer, and also participated in basketball and golf. Team captain in golf and soccer, and won all-conference awards in both. Has made mission trips to Guatemala the past three years and Mexico this year with schoolmates, helping build soccer fields. Member of National Honor Society, Sexually Mature Aware Responsible Team (SMART), Science Olympiad, and is active with church youth group. Plans to attend Hope College and study engineering.
Essay Quote: “Sportsmanship affects the game and the team. Knowing how to handle my emotions has made me a better sport, and having teammates who are good sports makes the game more fun. Sportsmanship is an essential part of educational athletics because it makes sports worth playing.
Other Class D girls finalists for the Scholar-Athlete Award were: Anna Marie Couture, Posen; Sarah Cullip, St. Ignace; Erica LeClaire, Dollar Bay; Christina Smith, Gaylord St. Mary; Kari L. Steenwyk, Ellsworth; and Krysta M. VanDamme, Rock-Mid Peninsula.
Other Class D boys finalists for the Scholar-Athlete Award were: Brett Branstrom, Rock-Mid Peninsula; Matthew R. Katz, Tekonsha; Alexander G. Knight, Lake Linden-Hubbell; Joseph Samuel Paquette, Munising; and Hunter Selby, Genesee Christian.
Students applying for the Scholar-Athlete Award must be carrying at least a 3.5 (on a 4.0 scale) grade-point average, and have previously won a letter in a varsity sport in which the Michigan High School Athletic Association sponsors a postseason tournament. Other requirements for the applicants were to show active participation in other school and community activities and produce an essay on the importance of sportsmanship in educational athletics.
The Class B scholarship award recipients will be announced on February 12, and the Class A honorees will be announced on February 19.
Farm Bureau Insurance, one of Michigan's major insurers, has a statewide force of more than 400 agents serving more than 380,000 Michigan policyholders. Besides providing life, home, auto, farm, business and retirement insurance, the company also sponsors life-saving, real-time Doppler weather tracking systems in several Michigan communities.