

Girls Events Set Record in 2013-14
September 18, 2014
By Geoff Kimmerly
Second Half editor
Michigan High School Athletic Association postseason tournaments drew more than 1.4 million fans in 2013-14 for the 15th straight school year, keyed in part by record attendance at girls events.
Total attendance for 2013-14 was 1,423,229 fans, with 988,669 at boys tournaments and 434,560 spectators at girls tournaments. Attendance is kept for all sports except golf, skiing and tennis, for which admission typically is not charged.
Total attendance did fall 10,127 fans, or 0.7 percent, from 2012-13. However, the girls tournament total broke a previous record set during the 2009-10 school year, with three girls sports setting overall attendance records: volleyball (101,654 fans), lacrosse (5,737) and competitive cheer (25,996). Boys and girls bowling tournaments, conducted simultaneously, also set an attendance record with 12,595 fans.
Cheer attendance increased for the 11th consecutive year and 2.8 percent from 2012-13; Cheer Finals attendance increased for the fifth straight year to a record 7,766 fans. The Boys Ice Hockey Finals also set a record with 14,595 fans, an increase of 1,690 over the previous year, while ice hockey’s total tournament attendance (60,778) was up 2.9 percent with increases at the Pre-Regional and Quarterfinal levels as well. Bowling, in addition to an overall attendance record, also saw a record for its Finals of 4,100 fans. The Baseball and Softball Finals, played at Michigan State University for the first time, did not set a record – but did draw 5,297 fans, a 29-percent increase from the previous season.
Attendance at boys tournament events fell to its lowest total since 1993-94, although the decrease from 2012-13 was less than one percent. However, football, despite a 1.5-percent decrease in attendance from the previous season, remained the highest MHSAA tournament draw for the seventh consecutive year with 392,069 fans. Football Finals attendance (52,409) rebounded 10.6 percent from 2012-13 after a similarly significant drop following 2011-12.
Boys Basketball Finals weekend attendance also bounced back significantly, with a 21.7-percent increase from the 2012-13 event to a three-day total of 42,373 fans at the Semifinals and Finals. Regional attendance also was up 4.8 percent, although overall boys basketball tournament attendance was down 3.2 percent to 308,205 fans. Girls basketball attendance was down 2.8 percent to 161,569 fans with Finals weekend attendance down 11.8 percent from 2012-13 – although the total Finals attendance of 16,763 fans in 2013-14 was the second-highest over the last four seasons, and attendance at Regionals and Quarterfinals increased from the previous girls basketball season.
Volleyball attendance increased 5.7 percent from 2012-13 while setting a District record of 68,447 fans, 16 percent more than the previous record set during 2011-12. Girls lacrosse bounced back from a slight drop in 2012-13 to set a record for overall attendance with 5,737 fans including a record for Semifinal attendance. Softball (3.7 percent to 42,242 fans), girls soccer (0.9 percent to 27,072) and girls swimming and diving (3.2 percent to 5,084) also saw attendance increases from 2012-13 – with girls soccer enjoying an 18-percent increase at the District level – while gymnastics (1,877) saw its lowest tournament attendance since 2007-08.
Five more sports saw attendance increases in 2013-14: Individual wrestling (49,037) was up 2.8 percent, boys lacrosse (7,726) was up 6.1 percent, baseball (47,540) was up 3.9 percent, boys and girls cross country (17,300) increased 1.9 percent and boys soccer (28,903) drew 35 more fans total than during 2012-13. Boys and girls cross country postseason events, like for bowling, are conducted simultaneously.
The MHSAA is a private, not-for-profit corporation of voluntary membership by more than 1,500 public and private senior high schools and junior high/middle schools which exists to develop common rules for athletic eligibility and competition. No government funds or tax dollars support the MHSAA, which was the first such association nationally to not accept membership dues or tournament entry fees from schools. Member schools which enforce these rules are permitted to participate in MHSAA tournaments, which attract more than 1.4 million spectators each year.
2026 Scholar-Athlete Award Recipients Announced in Class B
By
Geoff Kimmerly
MHSAA.com senior editor
February 10, 2026
The Michigan High School Athletic Association has selected nine student-athletes from Class B member schools to receive scholarships through the MHSAA/Farm Bureau Insurance Scholar-Athlete Award program.
 Farm Bureau Insurance, in its 37th year of sponsoring the award, will give $2,000 college scholarships to 32 individuals who represent their member schools in at least one sport in which the Association sponsors a postseason tournament. The first 30 scholarships are awarded proportionately by school classification and the number of student-athletes involved in those classes; also, there are two at-large honorees who can come from any classification.
Students applying for the Scholar-Athlete Award must be carrying at least a 3.5 (on a 4.0 scale) grade-point average and have previously won a letter in a varsity sport in which the Michigan High School Athletic Association sponsors a postseason tournament. Other requirements for the applicants were to show active participation in other school and community activities and produce an essay on the importance of sportsmanship in educational athletics.
The 32 scholarship recipients will be recognized March 14 during the MHSAA Boys Basketball Finals at the Breslin Student Events Center in East Lansing.
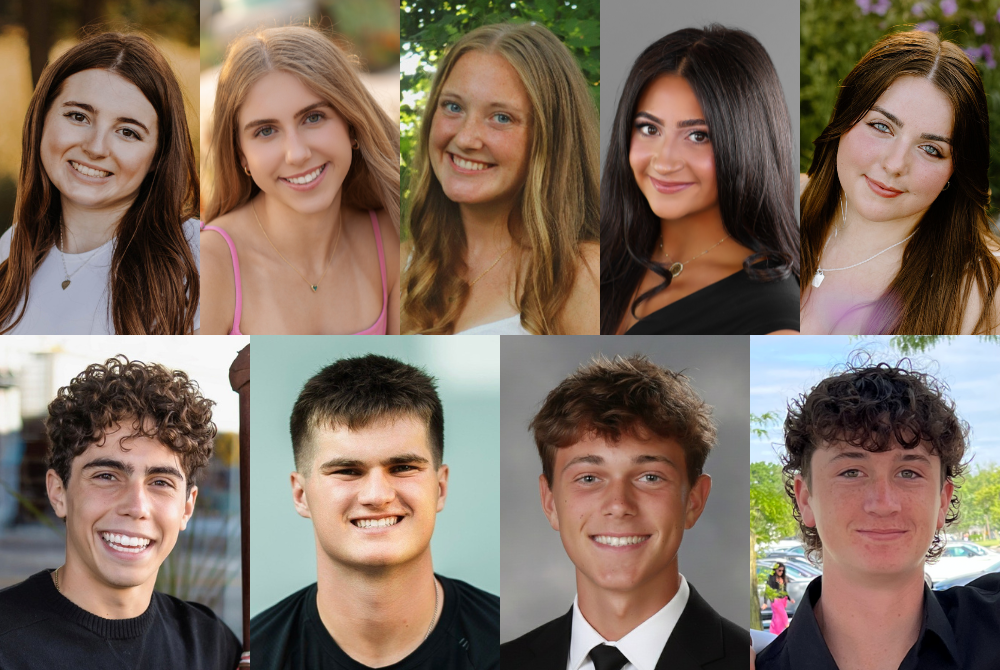
The Class B Scholar-Athlete Award honorees are Madison Dennis, Durand; Phoebe Elder, Haslett; Natalie Foltz, Frankenmuth; Julia Noureddine, Grosse Ile; Brayley West, Lake Fenton; Miles Dell, Chelsea; Cole Haist, Big Rapids; Logan Johnson, Flint Powers Catholic; and Micah Zacks, Detroit Country Day.
Overviews of the scholarship recipients of the Class B Scholar-Athlete Award follow. A quote from each recipient's essay also is included:
 Madison Dennis, Durand
Played three seasons of varsity volleyball, completing fourth varsity bowling season and will compete in second seasons of varsity track & field and tennis after missing last spring with a knee injury. Coached eighth grade team as a junior while healing from her injury. Earned all-league in bowling and serving as team captain, earned academic all-state in volleyball and helped team to academic all-state award, and helped tennis team to league title. Officiated volleyball as part of MHSAA Legacy Program. Named National Merit Scholarship Commended Student and received College Board Rural and Small Town and Scholar awards. Participating in second year of National Honor Society and has served as secretary. Serving third year as city youth ambassador, fourth year as student government class president and has served one year as executive board vice president. Leading yearbook staff as editor-in-chief. Will attend University of Michigan and study neuroscience on a pre-medicine track.
Essay Quote: “When matches are stressful or games are looking rough, I remind myself to stay positive and support my teammates. Treating others with kindness and integrity allows my teammates to feel welcome, and in turn, I help create an environment where everyone can perform their best and enjoy the sport.”
 Phoebe Elder, Haslett
Competed three seasons in swimming & diving and is competing in her fourth of gymnastics. Earned all-state and named league Gymnast of the Year as a junior and holds multiple program records. Also earned academic all-state and helped team to multiple league titles. Qualified for MHSAA Finals for swimming in multiple events and is part of a school record-holding relay. Served as captain of both teams. Named Commended Student by National Merit Scholarship program. Participating in third year of National Honor Society, fourth of school sustainability club, fourth of Future Doctors of America club, and fourth of Haslett Women in STEM club. Served as club/chapter president or vice president of all four and also on student council throughout high school. Will attend Northwestern University and study biology on a pre-medicine track.
Essay Quote: “The positive atmosphere in high school sports has made me a better athlete, inspiring me to attempt new skills in gymnastics and push through the final painful yards of a swim race. I think it has also made me a better person. It’s important to empathize with someone after a difficult performance, celebrate someone else’s success, and recognize that competing with people matters far more than competing against them.”
 Natalie Foltz, Frankenmuth
Ran four seasons of cross country and will compete in her fourth of track & field this spring. Earned all-state three times and academic all-state all four seasons of cross country, and was league and Regional champion in that sport. Qualified for MHSAA Finals in multiple events all of her first three seasons of track, earning all-state and academic all-state all of her first three seasons. Served as team captain of both. Participated in DECA throughout high school, qualifying for state competition and serving as vice president of community involvement. Served as quiz bowl captain and helped team to league championship as a senior. Served as treasurer and vice president of Be the Change club and three years as part of local library teen advisory board. Volunteered as Vacation Bible School group leader. Will attend Grand Valley State University and study exercise science.
Essay Quote: “Cross country and track introduce a complex twist into high-school sports: you’re competing against people from your own team, even your closest friends. This could cause friendships to be cracked and broken. … This season has taught me what true sportsmanship is: putting the focus on the success of others above my downfalls, no matter how difficult it may seem.”
 Julia Noureddine, Grosse Ile
Playing second season of varsity basketball, will compete in second season of track & field this spring and played two seasons of junior varsity volleyball. Earned all-region and all-area honors in track, and academic all-conference in track and basketball. Serving as basketball team captain and second year as youth game official. Earned multiple AP Scholar awards. Participating in third year of National Honor Society. Serving fourth year on student council and as executive board president, and organized sports equipment drive to support under-resourced youth. Participating in third year of Girl Up club , serving as vice president, and was regional placer and state qualifier in public speaking as part of Health Occupations Students of America. Started school sports and senior photography business, producing content for school athletic programs. Is undecided where she will attend college but intends to study a major on a pre-medicine track.
Essay Quote: “(Sportsmanship) isn’t measured by a handshake at the finish line. It’s measured by whether you choose to see people when it would be easier to walk past. Whether you give someone space to breathe in a world obsessed with winning. Whether you remind an opponent, a teammate, or someone you barely know that their worth is not determined by a stopwatch.”
 Brayley West, Lake Fenton
Played two seasons of varsity football, will compete in her fourth of track & field this spring and also played junior varsity basketball as a freshman. Also competed on powerlifting team throughout high school. Served as track & field throwers and powerlifting captain. Earned multiple AP Scholar awards and College Board recognition. Participating in second year of National Honor Society and as chapter president. Played four years in marching, symphonic, jazz and pep bands, and served as section leader. Serving fourth years on principal and superintendent advisory boards, and served two years on student council as vice president. Participating in second year of Key Club and earned volunteering achievement medallion for serving more than 100 hours as a junior. Will attend Central Michigan University and study social work with minors in American Sign Language and music.
Essay Quote: “As students, we are still learning who we are and who we want to become. Athletics accelerate that process. They place us in situations where emotions run high and winning feels like the only thing that matters. But sportsmanship keeps those moments from turning into something harmful. It teaches empathy and courage – the kind it takes to treat someone fairly even when everyone around you isn’t.”
 Miles Dell, Chelsea
Ran two seasons of varsity cross country, competing in fourth on swimming & diving team and will compete in his fourth season of track & field in the spring. Also will play his second season of varsity water polo. Qualified for MHSAA Finals all four seasons of cross country, twice in swimming and as part of a track relay, and earned academic all-state in all three sports and academic all-region in water polo. Served as team captain of cross country, swim & dive and track & field teams. Participating in second year of National Honor Society, third year of Interact Club, second years of Key Club, Link Crew and Bible Club, and first in economics club and as part of Bulldog Mentors for school’s new students. Played in wind symphony and marching bands throughout high school. Will attend University of Michigan and is finalizing his course of study.
Essay Quote: “I had just experienced the pinnacle of sportsmanship in athletics … not just to compete, but to laugh, to celebrate, to have fun, and to forge unbreakable bonds with the people around us. Too often, I think, athletes get caught up in pressure and competitiveness, and these reasons drift out of sight.”
 Cole Haist, Big Rapids
Played three seasons of varsity football, playing his fourth of varsity basketball and will play his third of varsity baseball this spring. Earned all-conference in baseball, all-area in football and all-state in basketball, helping all three teams to league championships and the football team to District titles. Earned or was part of team academic all-state honors in two sports. Served as captain of football and basketball teams. Serving second year on MHSAA Student Advisory Council and fourth on school’s student council, this year as student body mayor after three years as class president. Also serving fourth year on athletic leadership council and participating in second year of National Honor Society. Officiated youth football, basketball and baseball throughout high school and also coached youth sports. Participating in fourth year on Climate Crew. Is undecided where he will attend college and is finalizing his course of study.
Essay Quote: “… The other team isn’t the enemy. They’re kids our age who love their sport just as much as we do. Sportsmanship means remembering that – even when the game is intense, even when trash talk is flying, and even when you want to win more than anything.”
 Logan Johnson, Flint Powers Catholic
Played four seasons of varsity soccer and two of junior varsity basketball. Earned all-state and academic all-state multiple seasons in soccer and served as team captain. Officiated youth soccer throughout high school. Participating in third year of National Honor Society. Served in student government/student council the last two years and as president in second year of school’s UNICEF Club. Participated in DECA the last two years, competing at district and state levels with a focus on marketing. Has played piano for several years and earned national recognition during competitive performances. Founded neighborhood trash bin cleaning business. Co-founded and served as president of school’s investment club. Totaled more than 200 hours of volunteer community service. Is undecided where he will attend college, but intends to study business.
Essay Quote: “That moment changed how I view leadership. Sports often make it easy to get caught up in pressure, what the crowd wants, what your teammates expect, what the standings say. Real leadership doesn't let the noise around you drown out your values. It is a choice for integrity in moments when it may cost you something.”
 Micah Zacks, Detroit Country Day
Played four years of varsity soccer, is playing his fourth of varsity ice hockey and will play his fourth of varsity lacrosse in the spring. Earned all-league in ice hockey, all-state in soccer and all-America in lacrosse, and helped soccer and lacrosse teams to MHSAA Finals championships. Served as team captain of soccer and ice hockey teams. Served as icer hockey referee for two years and youth soccer trainer as a senior. Named National Merit Scholarship Commended Student and earned national scholar-athlete recognition. Founded school’s Jewish Student Alliance as a freshman and served as vice president of Youth in Government Club and Jewish Teen Connection Community Service Club. Participating in French foreign exchange program. Will attend University of Michigan and study statistics.
Essay Quote: “Sportsmanship can come in many different ways, but what’s important is making an effort to respect and help others. It is so important because what I will remember looking back on my high school sports memories is not just the wins and losses, but the character and kindness that were shown, and it is those values that I learned that I will carry with me throughout my life.”
Other Class B girls finalists for the Scholar-Athlete Award were Presley Chamberlain, Cheboygan; Sydney Fox, Birch Run; Maya Grossman, Vicksburg; Sophia Hazzi, Ann Arbor Greenhills; Kendall Hollon, Yale; Ava Lassey, Wixom St. Catherine; Clare O'Donnell, Negaunee; Avery Pagel, Birch Run; Liliana Saunders, Negaunee; Aubrey Tarkiewicz, Marshall; and Lilly Thelen, Portland.
Other Class B boys finalists for the Scholar-Athlete Award were Hugh Aaron, Detroit Country Day; Parth Ashok, Ann Arbor Greenhills; Dylan Becksvoort, Holland Christian; Caleb Carignan, Flint Powers Catholic; Nolan Carr, Corunna; Tucker Cole, Tecumseh; Joel DeLorge, Corunna; Bryce Gross, Flint Powers Catholic; Jackson Kohler, Yale; Caden Sommerfield, Frankenmuth; Möbius Stubblefield, Edwardsburg; and Jaxxon Thelen, Ionia.
The Class C and D scholarship award recipients were announced Feb. 3, and the Class A honorees will be announced Feb. 17.
Farm Bureau Insurance of Michigan was founded in 1949 by Michigan farmers who wanted an insurance company that worked as hard as they did. Those values still guide the company today and are a big reason why it is known as Michigan’s Insurance Company, dedicated to protecting the farms, families, and businesses of this great state. Farm Bureau Insurance agents across Michigan provide a full range of insurance services — life, home, auto, farm, business, retirement, Lake Estate®, and more — protecting nearly 500,000 Michigan policyholders.
The MHSAA is a private, not-for-profit corporation of voluntary membership by more than 1,500 public and private senior high schools and junior high/middle schools which exists to develop common rules for athletic eligibility and competition. No government funds or tax dollars support the MHSAA, which was the first such association nationally to not accept membership dues or tournament entry fees from schools. Member schools which enforce these rules are permitted to participate in MHSAA tournaments, which attract more than 1.4 million spectators each year.