
Hoopfest Returns to Jenison Field House
March 19, 2018
Second Half editor
March Magic Hoopfest will return to Jenison Field House for this weekend’s MHSAA Boys Basketball Finals, with extended hours and a Project UNIFY tournament highlighting the ninth championship weekend the event has run concurrent with the games being played at Michigan State University’s Breslin Center.
Up to 10 Special Olympics Project UNIFY teams will take part in a tournament played during the afternoons of March 22 and 23. Unified teams put special education students on the court participating in concert with their general education peers. Lineups must consist of three unified student athletes and two unified student partners on the floor at all times.
Games will be played on the two Hoopfest center courts. On March 24, the center courts will host a number of “JumpBall Jamboree” games made up of teams of boys and girls in grades 3-8.
A number of other favorite attractions will return including slam dunk (on lowered rims), 3-point shootout and half-court shot areas where fans can visit at any time and participate, and the festivities also will include a court for timed “Around the World” shooting games and another court featuring a skills challenge. Also returning is the Walk of History, showcasing championship games, life-size photos and display boards from throughout the MHSAA Finals’ near century-long run.
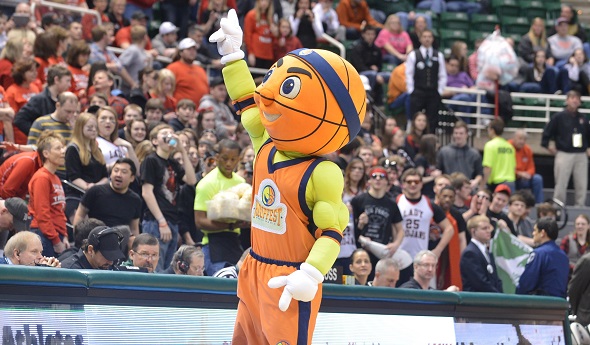
Hoopfest again also will be home to Hoopie, the event’s mascot who made his first public appearances during the 2014 MHSAA Finals.
Admission to the March Magic Hoopfest is $2 per person, and fans attending the MHSAA Boys Basketball Semifinals and Finals will be admitted free with their game tickets. Hours on March 22 and 23 will be 1 p.m. to 7 p.m.; the event is open from 10 a.m. to 6 p.m. on March 24. Jenison Field House, site of Hoopfest, also was the site of the MHSAA Boys Basketball Finals for 31 years. To find out general information about the event, visit the March Magic Hoopfest website.
The March Magic Hoopfest is conducted in partnership between the Greater Lansing Sports Authority (GLSA), a division of the Greater Lansing Convention and Visitors Bureau, and the MHSAA, with vital support coming from the Department of Intercollegiate Athletics at Michigan State University.
“Hoopfest is not just for kids, but the kid in all of us,” MHSAA Director of Brand Management Andy Frushour said. “The adults who stop in seem to love it as much as their children. There are basketball hoops everywhere, and with all of the different games to try it’s like being back on the playground.”
The Greater Lansing Sports Authority’s mission is to be the leading voice of sports tourism in the Greater Lansing area and to promote economic growth by attracting a diverse range of sporting events to the region. The GLSA strives to enhance the quality of life for area residents through the development of local sports and fitness programs for all ages, and supports the continued development and maintenance of safe, high-quality athletic facilities.
“Hoopfest has become the must-attend event for spectators of the MHSAA Tournament,” said Meghan Ziehmer, Associate Director of the Greater Lansing Sports Authority. “With games geared for all ages and abilities, the young and young-at-heart can play before, between and after sessions. With activities like the skills challenge, 3-point shooting contest and lowered rims to show off your athletic prowess, there is no shortage of fun activities.”

Rep Council Wrap-Up: Fall 2015
December 14, 2015
By Geoff Kimmerly
Second Half editor
Results of recent changes to health and safety policies and possibilities for future work to help keep school sports safe were main topics of discussion by the Representative Council of the Michigan High School Athletic Association during its annual Fall Meeting on Dec. 4 in East Lansing.
Generally, Council takes only a few actions during its Fall Meeting, with topics often introduced for additional consideration and actions during its meetings in winter and spring. The Council heard reports on a number of subjects, chiefly the “4 H’s” of health and safety – Health Histories, Heads, Heat and Hearts – and the MHSAA’s recent work on these topics.
Among data most noteworthy, it was reported that 747 of 750 member high schools complied with the first-time requirement this fall that all head coaches have a valid certification in CPR. Eighty percent of high schools arranged in-person CPR training for all of their high school varsity head coaches, and two-thirds of high schools included assistant and subvarsity coaches in school-arranged in-person training.
The Council reviewed the preliminary concussion care data released to the public Dec. 9, recent actions by U.S. Soccer to reduce heading in youth soccer, discussion in the girls lacrosse community regarding head protection and actions taken by other states and the National Federation of State High School Association regarding football practice policies and their similarities to changes adopted for MHSAA schools prior to the 2014 season. Council members also examined results from this fall’s Update Meeting opinion poll, including questions related to the possibility of using electronic forms to track students’ health histories and the possibility of practice limitations for all sports similar to those adopted for football.
As a result of the recent amendment of the MHSAA Constitution allowing for membership at the 6th-grade level, a number of potential changes to the MHSAA Handbook necessitated by the amendment were presented to the Council, as was a draft of an updated 2016-17 Membership Resolution. Both are expected to be voted on at the March meeting.
The Council also received reports on athletic-motivated and athletic-related transfers, reviewed an updated list of Approved International Student Programs for 2015-16 and discussed concerns regarding the exception to the Transfer Regulation for residential students of boarding schools.
Changes to out-of-season coaching rules were among the most significant efforts taken up by MHSAA staff over the last year, and Council members shared their observations of the impacts of changes including the rule change that allows a school coach to work with up to four athletes at one time instead of the previous three. The Council discussed if the MHSAA should consider a policy requiring in all sports athletes to participate in a minimum number of contests against school teams to be eligible for MHSAA tournaments, but declined to take action on the topic beyond policies already in place for skiing, ice hockey and soccer. Council members also were presented with examples of calendars for a balanced school year and possible movement of standardized testing dates, which both have the potential to affect the school sports calendar in the future.
The Council voted on one matter concerning MHSAA tournaments, approving a recommendation by the Girls Lacrosse Committee to not accept the new overtime rule of U.S. Women’s Lacrosse that grants in tournament play sudden victory to the first team that scores. The MHSAA will retain its current overtime procedure for tournament games, which calls for two full 3-minute halves of stop-clock overtime – and, if the game remains tied after those first two halves – additional 3-minute overtime periods with sudden victory.
The Fall Meeting also saw the addition of Courtney Hawkins, athletic director at Flint Beecher High School, to the 19-person Council. He was appointed to a two-year term and also serves as his school’s varsity football coach. He fills the position formerly held by Maureen Klocke, athletic director at Yale High School, whose term ended. Also, Cheri Meier, principal at Ionia Middle School, was re-appointed for a second two-year term.
The Council re-elected Scott Grimes, assistant superintendent of human services for Grand Haven Area Public Schools, as its president; Benton Harbor athletic director Fred Smith was re-elected vice president and Vic Michaels, director of physical education and athletics for the Archdiocese of Detroit, was re-elected secretary-treasurer.
The Representative Council is the legislative body of the MHSAA. All but five members are elected by member schools. Four members are appointed by the Council to facilitate representation of females and minorities, and the 19th position is occupied by the Superintendent of Public Instruction or designee.
The MHSAA is a private, not-for-profit corporation of voluntary membership by more than 1,400 public and private senior high schools and junior high/middle schools which exists to develop common rules for athletic eligibility and competition. No government funds or tax dollars support the MHSAA, which was the first such association nationally to not accept membership dues or tournament entry fees from schools. Member schools which enforce these rules are permitted to participate in MHSAA tournaments, which attract more than 1.4 million spectators each year.