


MHSAA 2025-26 Attendance Figures Show Increases in 10 Sports, Nearly Offsetting Early Deficit
By
Geoff Kimmerly
MHSAA.com senior editor
August 25, 2026
Increased attendance in 10 sports nearly made up for a likely Halloween-driven deficit during the first week of last season’s football playoffs as Michigan High School Athletic Association postseason tournament attendance approached 1.4 million spectators again for the 2025-26 school year.
Total, MHSAA Tournament events drew 1,381,218 spectators at competitions for which admission is charged – which counts all MHSAA-sponsored sports except golf, skiing and tennis, as single tickets are not sold for those postseason events. The total of just under 1.4 million spectators was a decrease of 16,356 tickets sold across all sports (1.2 percent) from 2024-25 – but notable increases in other sports helped make up for a year-to-year decrease of 37,617 tickets (29 percent) for the District Semifinal round of the MHSAA 11-Player Football Playoffs, which along with 8-Player Regional Semifinals coincided with Halloween in 2025.
The Boys Lacrosse Tournament saw record attendance during its Semifinals and overall with 18,067 tickets sold across all rounds – that total representing an 18-percent increase from the previous season. Girls Volleyball Tournament attendance approached its overall record, with 118,332 tickets sold an increase of 6.7 percent from the 2025 postseason and just 99 tickets shy of tying the record set during the 2019 season. Girls volleyball did set records at the District (78,307) and Regional (26,793) levels.
Girls attendance as a whole rebounded in 2025-26, up to 460,730 tickets sold, an increase of 1.6 percent over the previous year. Girls basketball (146,322), competitive cheer (29,491), lacrosse (5,573) and individual wrestling (5,539) all joined volleyball as showing attendance jumps. Overall attendance for cross country (girls and boys combined) also saw an increase (17,778), as did boys basketball (262,338), boys swimming & diving (5,831) and individual wrestling (47,903). The Individual Wrestling Finals, specifically, enjoyed their largest audience since 2016-17.
Football did receive good news, despite the lower attendance that first week and also slightly lower attendance year-to-year for the 11-Player District Finals. The Regional rounds of the playoffs, 11 and 8-player combined, saw their highest attendance (68,469) since the 2012 season, and despite 8-Player Regional Semifinals coinciding with Halloween. The Semifinals attendance (33,085) saw their highest attendance also since 2012, and Finals attendance (44,708) was its highest since 2019.
The MHSAA also sponsored postseasons for the first time for field hockey and boys volleyball, adding overall ticket sales of 2,084 and 8,158, respectively.
The MHSAA is a private, not-for-profit corporation of voluntary membership by more than 1,500 public and private senior high schools and junior high/middle schools which exists to develop common rules for athletic eligibility and competition. No government funds or tax dollars support the MHSAA, which was the first such association nationally to not accept membership dues or tournament entry fees from schools. Member schools which enforce these rules are permitted to participate in MHSAA tournaments, which attract more than 1.4 million spectators each year.
Participation Rises to 4-Year High
July 10, 2018
By Geoff Kimmerly
Second Half editor
While enrollment in MHSAA member high schools saw another slight dip in 2017-18, participation in the 28 sports for which the MHSAA sponsors postseason tournaments rose to its highest point since 2013-14.
A total of 284,920 participants competed in MHSAA-sponsored sports this past school year, up 0.46 percent from 2016-17 – and despite a 1 percent drop in enrollment at member schools during that time. The overall MHSAA participation totals count students once for each sport in which they participate, meaning students who are multiple-sport athletes are counted more than once.
Girls participation rose for the third straight year to 121,349 participants, up 1.2 percent from 2016-17 and despite a 1.1 percent enrollment drop over the last year. Boys participation fell to 163,571 participants, a decrease of less than a tenth of a percent from the previous year – and much smaller than the boys enrollment decrease of nearly a full percent.
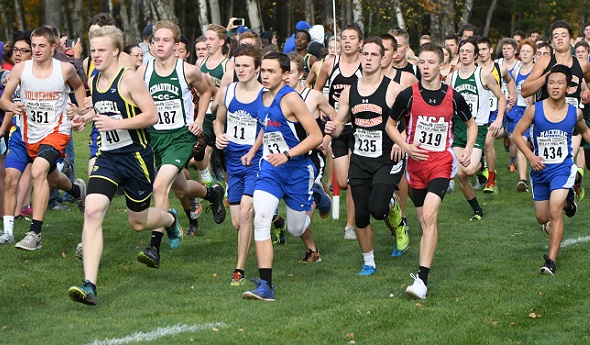
Girls lacrosse has set a participation record every season since becoming a sponsored tournament sport in 2005, and did so this spring with 2,900 participants – a 3.1 percent increase from a year ago. Boys lacrosse also set a record for the second year in a row, up 1.1 percent with 5,168 participants. Both boys and girls bowling broke records previously set in 2015-16 – boys bowling participation increased 8.4 percent over 2016-17 with 4,136 participants, while girls bowling was up 4.5 percent with 3,058 athletes. Also setting a record in 2017-18 was boys cross country, which saw record participation for the second straight season last fall with 9,656 runners (an increase of 2.6 percent).
The largest percentage increase in participation this school year came in girls gymnastics, which jumped 10.4 percent with 702 athletes – its most since 2011-12. Girls golf also enjoyed a notable increase, up 4.2 percent to 3,712 athletes – its highest participation total since 2007-08.
Six sports total saw increases in participation on both the girls and boys’ sides. In addition to bowling and lacrosse, girls cross country joined the record-setting boys with a 2.4 percent increase. Girls and boys swimming & diving both enjoyed increases for the second straight year, this time both by 2.4 percent. Girls tennis was up 2.3 percent to its highest total (9,123) since 2012-13, and boys tennis participation increased by one percent. Boys track & field (1.5 percent) increased for the third straight year, while girls track & field (1.6 percent) was up for the second consecutive.
Volleyball led participation among girls sports with 19,416 participants, up 1.8 percent from 2016-17. Other sports to see increases in 2017-18 were girls skiing, up 2.8 percent as participation increased for the second straight season; boys basketball, up a half percent; and girls soccer, which had four more athletes this spring than during the 2017 season.
Also of note in this year’s survey:
• The increase in participation for 18 sports during 2017-18 was compared to an increase in 16 sports for 2016-17 and 15 sports in 2015-16.
• Of 10 sports that saw decreases in participation in 2017-18, five were down less than a percent. Competitive cheer had five fewer athletes but 6,715 total, and there were three fewer boys golfers to take that total to 2,267. Boys skiing was down six athletes total to 831, while boys soccer was down 11 athletes and girls softball down 31 – both less than a quarter of a percent off their 2016-17 totals.
• Football experienced a much smaller decrease in participation last season than it had from 2015-16 to 2016-17, falling only 1.9 percent to 37,002 athletes – still the most participating in any sport by more than 13,000 athletes. The combined number of 11 and 8-player varsity teams sponsored by MHSAA schools last fall remained constant compared to recent seasons, although a shift of some programs from 11-player to 8-player continued.
The participation figures are gathered annually from MHSAA member schools to submit to the National Federation of State High School Associations for compiling of its national participation survey. Results of Michigan surveys from the 2000-01 school year to present may be viewed by clicking here.
The following chart shows participation figures for the 2017-18 school year from MHSAA member schools for sports in which the Association sponsors a postseason tournament:
|
BOYS |
GIRLS |
|||
|
Sport |
Schools (A) |
Participants |
Schools (A) |
Participants (B) |
|
Baseball |
642/655/5 |
17,668 |
- |
0/7 |
|
Basketball |
730/729/1 |
21,367 |
691/723 |
15,654/5 |
|
Bowling |
385/391/18 |
4,098 |
360/381 |
3,058/38 |
|
Competitive Cheer |
- |
- |
343/353 |
6,715 |
|
Cross Country |
640/651/4 |
9,650 |
620/650 |
8,696/6 |
|
Football - 11 player |
578/582/89 |
35,475 |
- |
0/108 |
|
8-player |
71/74/10 |
1,406 |
- |
0/13 |
|
Golf |
506/530/66 |
6,146 |
340/339 |
3,712/121 |
|
Gymnastics |
- |
- |
83/96 |
702 |
|
Ice Hockey |
240/269/9 |
3,353 |
- |
292/12 |
|
Lacrosse |
154/161/5 |
5,161 |
109/113 |
2,900/7 |
|
Skiing |
96/107/1 |
830 |
95/107 |
767/1 |
|
Soccer |
484/506/20 |
14,550 |
468/483 |
13,216/69 |
|
Softball |
- |
- |
624/643 |
13,610 |
|
Swimming & Diving |
246/274/14 |
5,020 |
261/280 |
5,732/78 |
|
Tennis |
295/309/12 |
6,134 |
332/340 |
9,123/31 |
|
Track & Field |
668/686/2 |
23,566 |
659/685 |
17,288/14 |
|
Volleyball |
- |
- |
715/717 |
19,416 |
|
Wrestling |
467/482/152 |
9,147 |
- |
126/250 |
(A) The first number is the number of schools reporting sponsorship on the Sports Participation Survey. The second number indicates schools sponsoring the sport including primary and secondary schools in cooperative programs as of May 14, 2018. The third number indicates the number of schools that had girls playing on teams consisting primarily of boys.
(B) The second number indicates the number of additional girls playing on teams consisting primarily of boys and entered in boys competition.
The MHSAA is a private, not-for-profit corporation of voluntary membership by more than 1,500 public and private senior high schools and junior high/middle schools which exists to develop common rules for athletic eligibility and competition. No government funds or tax dollars support the MHSAA, w