MHSAA Announces 2015-16 Concussion Data
September 12, 2016
By Geoff Kimmerly
Second Half editor
The Michigan High School Athletic Association has completed an unprecedented yearlong collection of head injury reports from its member schools, mandated in 2015-16 for the first time as part of an effort to identify and reduce the incidence of those types of injuries in educational athletics.
The MHSAA requested that member schools report, by sport, possible concussions by their student-athletes during both practice and competition. Reporting for the 2016-17 school year is underway, and schools again are required to designate if potential concussions occurred during competition or practice and at which level – varsity, junior varsity or freshman.
The full report of all head injuries experienced during 2015-16 by student-athletes at MHSAA member high schools – including percentages by sport (per 1,000 participants), gender and team level, as well as data tracking when athletes returned to play – is available on the Health & Safety page of the MHSAA Website.
The MHSAA received data from more than 99 percent of its member high schools after the end of the fall, winter and spring seasons, and continued to track each injury report through its conclusion this summer. Member junior high and middle schools also were allowed, although not mandated, to report their potential head injuries; those findings are not part of the published report.
It is the hope that universities, health care systems and the National Federation of State High School Associations will take part in analyzing the data. The MHSAA will work, in particular, with Michigan State University’s Institute for the Study of Youth Sports to explore these findings and their relation to possible changes and additions in coaches education.
“We know that school sports are safer than they’ve ever been, thanks to advances in equipment, increased and more complete coaches education and rules designed to bring higher levels of safety to both practices and competition,” said John E. “Jack” Roberts, executive director of the MHSAA. “However, this unprecedented effort will allow us for the first time to set a baseline by which we can determine year-to-year progress as we work to reduce the incidence of head injuries in school sports, while providing questions we will seek to answer with assistance from our research partners.”
Student-athletes at MHSAA member high schools encountered during 2015-16 a total of 4,452 head injuries – or 5.9 per member school. Total participation in MHSAA sports for 2015-16 was 284,227 – with students counted once for each sport he or she played – and only 1.6 percent of participants experienced a head injury. Boys experienced 3,003 – or 67 percent – of those injuries, although boys participation in sports, especially contact sports, also was higher than girls.
More than half of head injuries – 54 percent – were experienced by varsity athletes. A total of 2,973 – or 67 percent – came in competition as opposed to practice. More than half took place during either the middle of practice or middle of competition as opposed to the start or end, and nearly 56 percent of injuries were a result of person-to-person contact. The largest percentage of athletes – 28 percent – returned to activity after 6 to 10 days, while 20 percent of those who suffered head injuries returned after 11-15 days of rest.
Not surprisingly, contact sports revealed the most head injuries. Ranking first was 11-player football with 49 head injuries per 1,000 participants, followed by ice hockey with 38 and 8-player football with 34. However, girls soccer was just behind with 30 injuries per 1,000 participants, and girls basketball ranked fifth with 29 injuries per 1,000.
A startling disparity in the number of reported head injuries suffered by girls and boys playing the same sports was the most significant finding revealed by the concussion reporting. Soccer, basketball and baseball/softball are played under identical or nearly identical rules, and in those sports females reported significantly more concussions than males playing the same or similar sport.
Female soccer players reported 30 concussions per 1,000 participants. Male soccer players, meanwhile, reported only 18 concussions per 1,000 participants. Female basketball players reported 29 concussions per 1,000 participants; male players reported 11. Softball players reported 11 concussions per 1,000 participants, and baseball players reported four per 1,000.
“Experts tell us that it’s not surprising that girls report more head injuries than boys. But we found it stunning how many more head injuries were reported for girls than boys,” Roberts said. “As we delve deeper into the data, we hope to identify what physiological, social and psychological factors may contribute to this disparity – and how we can better prepare school personnel and especially coaches to watch for over- or under-reporting.”
Schools report possible concussions online via the MHSAA Website. Reports are then examined by members of the MHSAA staff, who follow up with school administrators as those student-athletes continue to receive care and eventually return to play. Student privacy is protected.
The reporting of possible concussions is part of a three-pronged advance by the MHSAA in concussion care begun during the 2015-16 school year which is producing data related to the frequency and severity of head injuries. The MHSAA in fall 2015 launched the largest-ever state high school association sideline concussion testing pilot program, with 62 schools taking part by using one of two screening tests designed to detect concussions. One of the objectives of the pilot was to increase awareness of concussions and improve sideline detection, and results indicated that the average number of possible concussions reported by pilot schools exceeded the average reported by schools outside the pilot group. For the 2016-17 school year, 34 schools are taking part in one of the two pilot programs as the project was concentrated to include schools which were diverse in size and location and able to best conduct the pilots to completion. The pilots will focus on sports for which most concussions occur, according to the mandated reporting by all schools during the 2015-16 school year.
The MHSAA also is the first state association to provide all participants at every member high school and junior high/middle school with insurance intended to pay accident medical expense benefits – covering deductibles and co-pays left unpaid by other policies – resulting from head injuries sustained during school practices or competitions and at no cost to either schools or families. During 2015-16, a total of 159 claims were made – with more than half coming in football (55) or girls basketball (29).
Previously, the MHSAA also was among the first state associations to adopt a return-to-play protocol that keeps an athlete out of activity until at least the next day after a suspected concussion, and allows that athlete to return to play only after he or she has been cleared unconditionally for activity by a doctor (M.D. or D.O.), physician’s assistant or nurse practitioner.
The MHSAA is a private, not-for-profit corporation of voluntary membership by more than 1,400 public and private senior high schools and junior high/middle schools which exists to develop common rules for athletic eligibility and competition. No government funds or tax dollars support the MHSAA, which was the first such association nationally to not accept membership dues or tournament entry fees from schools. Member schools which enforce these rules are permitted to participate in MHSAA tournaments, which attract more than 1.4 million spectators each year.
On Call as Doctor, Director, Mom
By
Geoff Kimmerly
MHSAA.com senior editor
October 31, 2013
By Geoff Kimmerly
Second Half editor
Dr. Kiran Taylor is in her 10th year as a practicing psychiatrist and specializes in providing therapy to cancer patients and family members who care for them.
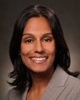 Taylor is the medical director of the Supportive Care Medicine Clinic at Spectrum Hospital’s Lemmen-Holton Cancer Pavilion in Grand Rapids. She's also the Chief of Psychiatry and Behavioral Medicine for the entire Spectrum Health System, which includes 11 hospitals and nearly 200 ambulatory and service sites all over the western Lower Peninsula.
And Thursday, she made sure to schedule a trip to her children’s school for the Halloween parade and costume parties.
Balancing is a daily requirement for Taylor (formerly Khanuja), an MHSAA Scholar-Athlete Award winner as an East Lansing senior in 1994. But the skills she learned as a tennis standout for the Trojans and at the University of Michigan are those she relies on still as a doctor, director and Mom.
“My high school athletic experience impacts all areas of my life,” Taylor said. “I think about the journey of those experiences and how those changed me.
“The discipline and time management skills you have to have as a scholar-athlete, to pay attention to school and pay attention to your sport, those are certainly skills I carry with me today.”
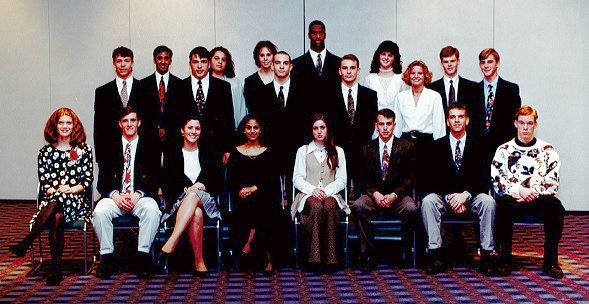
Taylor was one of 20 scholar-athletes recognized that winter by the MHSAA and  Farm Bureau Insurance, which continues to sponsor the award program that has grown to 32 recipients. In advance of this March’s 25th celebration, Second Half is catching up with some of the hundreds who have been recognized.
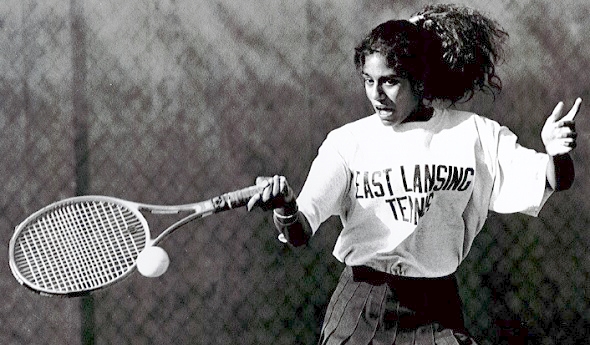
Taylor advanced as far as the Lower Peninsula Class A No. 1 singles championship match during her high school tennis career, finishing runner-up at the top flight her junior season. She already had an interest at that point in health and an understanding of what went into playing at a high level, and was most interested in sports medicine and orthopedics when she began medical school, also at U-M.
But as she got a little deeper into her studies, Taylor discovered a path that seemed more in line with her personality.
‘Natural fit’
A video bio of Taylor on the Spectrum Health website includes her explaining that she chose psychiatry because it’s an area that allows her to empower patients to help themselves. In her line of work, she not only heals but aspires to help those in her care reach their potential.
“When they’re helping themselves, they’re helping others, they’re helping their communities,” Taylor said, “and the impact is endless.”
While at U-M, Taylor found a mentor in Dr. Michelle Riba, the director of the PsychOncology program at U-M’s Comprehensive Cancer Center. Her work, like Taylor’s at Spectrum, centers on treating patients in their dealing with the emotional issues that come with cancer diagnosis and treatment.
Taylor’s role as chief of psychiatry and behavioral medicine for the entire Spectrum system allows her to affect a patient’s entire care by making more accessible treatment for emotional and well as physical needs.
There are days she comes home after working with a patient facing especially somber circumstances, and through her medical training has learned how to keep those sad situations from affecting her personally.
But there also are days when she’s had to deal with a difficult managerial situation, and during those times she taps into the skills she learned while on the court.
"You manage adversity on a tennis court. It could be a tight match, or you're up 5-0 or down 5-0," Taylor said. "It's a microcosm of the world.
"If I have a challenging colleague or someone with a different opinion in a meeting, I tap into knowing how to deal with adversity."
Pass it on
Taylor, 37, remains tied to a few from her Scholar-Athlete Awards class. She has known Okemos winner Andy Dhaliwal since childhood and he is now a doctor too, having also graduated from U-M. Jackson winner Harland Holman is a family physician in Grand Rapids and also part of the Spectrum Health system, and knew Taylor's husband through wrestling.
Karin is married to Dr. Joe Taylor, quite a former scholar-athlete himself – he was a standout wrestler at Charlotte before graduating in 1995 and going on to study at U-M.
Thanks at least in part to their parents’ inclination toward sports, the Taylor kids are beginning to try some out. The oldest is 9, the same age as when Kiran first picked up a tennis racket.
For this, Taylor also is prepared thanks to her high school and college careers. Considered together, they give her a long perspective when it comes to kids and sports.
“(It’s about) letting them figure out what they’re interested in, letting them explore. They want to pay attention to things or don’t; watching them unfold was fun,” Taylor said. “It’s about understanding the road, and that’s what high school athletics did, and going on into college athletics. They helped me understand it’s a long road. You don’t have to start your kid at 4 and have the best at 7.”
And it's a road she advises this year's Scholar-Athletes to appreciate now as they pick up knowledge they'll use for a lifetime.
“The lessons they’re learning now, and how they conduct themselves – being a scholar-athlete, I think, is about the way you conduct yourself – those are the skills they will take with them no matter what they do at any point in life,” Taylor said. “That’s what being a scholar-athlete has done for me.”
Click to read the series' first installment:
25 Years Later, Scholar Athletes Shine On
PHOTO: (Top) Kiran Khanuja returns a volley during a tennis match while at East Lansing High School. (Bottom) The MHSAA Scholar-Athlete Award class of 1993-94 included Khanuja, seated fourth from left.