
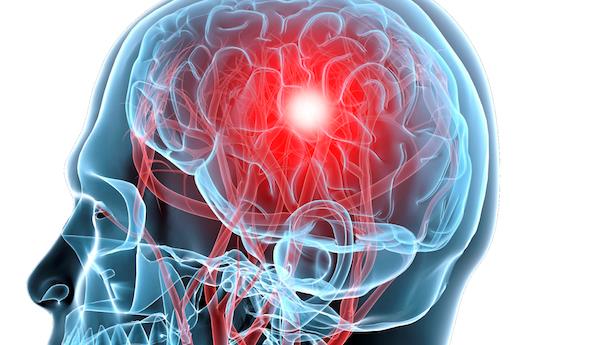
MHSAA Announces 2016-17 Concussion Data
August 7, 2017
By Geoff Kimmerly
Second Half editor
The Michigan High School Athletic Association has completed its second year of collecting head injury reports from member schools as it continues to build data that will assist in identifying trends and progress being made to reduce the incidence of head injuries in school sports.
Following a first mandate to do so in 2015-16, member schools again were required to report head injuries to the MHSAA identifying the sport that each student-athlete was participating in and whether the injury was sustained during practice or competition. As reporting for the 2017-18 school year is now underway, schools again are required to designate if potential concussions occur during competition or practice and at which level – varsity, junior varsity or freshman.
The full report of all head injuries experienced during 2016-17 by student-athletes at MHSAA member high schools – including percentages by sport (per 1,000 participants), gender and team level, as well as data tracking when athletes returned to play – is available on the Health & Safety page of the MHSAA Website.
As with the first year of reporting, the MHSAA received data from more than 99 percent of its member high schools after the fall, winter and spring seasons and continued to track each injury report through its conclusion this summer. Member junior high and middle schools also were allowed, although not mandated, to report their potential head injuries; and those findings are not part of the published report.
The 2016-17 concussion report found an 11-percent decrease in the number of confirmed concussions from the previous year. Student-athletes at MHSAA member high schools encountered during 2016-17 a total of 3,958 head injuries – or 5.2 per member school, similar but lower than the 2015-16 average of 5.9. Total participation in MHSAA sports for 2016-17 was 283,625 – with students counted once for each sport he or she played – and only 1.4 percent of participants experienced a head injury; that percentage in 2015-16 was 1.6.
However, MHSAA Executive Director John E. “Jack” Roberts said that while it’s significant to note the similarity in those statistics over the first two years of injury report collection, the lower percentages in 2016-17 don’t necessarily represent a trend – that conclusion can only be made after more data is collected in years to come. Some differences in data from the first year to the second could be the result of schools’ increased familiarity with the reporting system, the refinement of the follow-up reporting procedure and other survey error that is expected to decrease with future surveys.
“Our first survey in 2015-16 raised some initial themes, and the data we collected this past year and will continue to collect will help us identify the trends that will guide our next steps in reducing head injuries in interscholastic athletics,” Roberts said. “However, the necessity for more data to determine these trends should not delay our efforts to experiment with more head protection and modified play and practice rules in contact sports like ice hockey, soccer, wrestling and lacrosse – which all ranked among the top 10 sports for numbers of head injuries per thousand participants.
“We will continue to look for ways to make our good games better and our healthy games safer, and the collection of this data will continue to prove key as we work toward those goals.”
Although the total number of confirmed concussions was significantly lower in 2016-17, a number of findings detailing those injuries fell in line with results of the 2015-16 survey.
Boys experienced 2,607 – or 66 percent – of those injuries, nearly the same ratio as 2015-16 and as boys participation in sports, especially contact sports, remained higher than girls. More than half of head injuries – 55 percent – were experienced by varsity athletes, which also fell within a percent difference of last year’s findings.
A total of 2,973 head injuries – or 65 percent – came in competition as opposed to practice. More than half took place during either the middle of practice or middle of competition as opposed to the start or end, and 52 percent of injuries were a result of person-to-person contact. The largest percentage of athletes – 27 percent – returned to activity after 6 to 10 days, while 23 percent of those who suffered head injuries returned after 11-15 days of rest. All of these findings were within 1-4 percent of those discovered from the 2015-16 data.
Contact sports again revealed the most head injuries. Ranking first was football, 11 and 8-player combined, with 44 head injuries per 1,000 participants – a decrease of five head injuries per 1,000 participants from 2015-16. Ice hockey repeated with the second-most injuries per 1,000, with 36 (down two injuries per 1,000 from 2015-16), and girls soccer was again third with 28 head injuries per 1,000 participants (also down two from the previous year).
In fact, after football and hockey, four of the next five sports to show the highest incidences of head injuries were girls sports – girls soccer followed by girls basketball (23 per 1,000), girls competitive cheer (22) and girls lacrosse (20). Although girls basketball again showed the fifth-highest ratio, it did see a decline of six injuries per 1,000 participants from 2015-16.
Startling indications of another potential trend were seen again in the number of reported head injuries suffered by girls and boys playing the same sports. Soccer, basketball and baseball/softball are played under identical or nearly identical rules. Just as in 2015-16, females in those sports reported significantly more concussions than males playing the same or similar sport.
Female soccer players reported double the concussions per 1,000 participants as male soccer players, while female basketball players reported nearly triple the number of concussions per 1,000 participants (23 to 8). Softball players reported 11 concussions per 1,000 participants, and baseball players reported four per 1,000. The numbers from all three comparisons remained consistent from what the survey found in 2015-16.
It is the hope that Michigan’s universities, health care systems and the National Federation of State High School Associations will take part in analyzing the data and questions that have arisen during the past two years. Michigan State University’s Institute for the Study of Youth Sports submitted a paper titled “Gender Differences in Youth Sports Concussion” based on the 2015-16 results, and that subject will remain closely monitored in 2017-18 and beyond.
“The Institute’s research concluded that there is merit for believing females may be more susceptible than males to having concussions because of structural differences to the neck and head, and also due to neurological differences in the brains of females and males. But the findings also show merit for believing females may be more honest in reporting concussions,” Roberts said.
“We need to find out why. Are girls just more willing to report the injury? Are boys hiding it? These are some of our most important questions moving forward, and they will be critical in our efforts to educate athletes, their parents and coaches on the importance of reporting and receiving care for these injuries immediately.”
Schools report possible concussions online via the MHSAA Website. Reports are then examined by members of the MHSAA staff, who follow up with school administrators as those student-athletes continue to receive care and eventually return to play. Student privacy is protected.
The reporting of possible concussions is part of a three-pronged advance by the MHSAA in concussion care begun during the 2015-16 school year. The MHSAA completed this past spring (2017) the largest-ever state high school association sideline concussion testing pilot program, with a sample of schools from across the state over the last two years using one of two screening tests designed to detect concussions. The second year of the pilot program (2016-17) allowed participating schools to use the sideline detection tests in all sports but mandated they be used in sports (11 total over three seasons) showing the highest prevalence of concussions.
The MHSAA also was the first state association to provide all participants at every member high school and junior high/middle school with insurance intended to pay accident medical expense benefits – covering deductibles and co-pays left unpaid by other policies – resulting from head injuries sustained during school practices or competitions and at no cost to either schools or families. During 2016-17, a total of 139 claims were made – 20 fewer than in 2015-16 – with football (44) and girls basketball (27) the sports most cited in those claims for the second straight year.
Previously, the MHSAA also was among the first state associations to adopt a return-to-play protocol that keeps an athlete out of activity until at least the next day after a suspected concussion, and allows that athlete to return to play only after he or she has been cleared unconditionally for activity by a doctor (M.D. or D.O.), physician’s assistant or nurse practitioner.
In addition, the MHSAA’s Coaches Advancement Program – which includes courses that must be completed by all varsity head coaches hired for the first time at a member school – has augmented for this fall its already substantial instruction on concussion care. Separately, rules meetings that are required viewing for all varsity and subvarsity head and assistant coaches at the start of each season include detailed training on caring for athletes with possible head injuries.
The MHSAA is a private, not-for-profit corporation of voluntary membership by more than 1,400 public and private senior high schools and junior high/middle schools which exists to develop common rules for athletic eligibility and competition. No government funds or tax dollars support the MHSAA, which was the first such association nationally to not accept membership dues or tournament entry fees from schools. Member schools which enforce these rules are permitted to participate in MHSAA tournaments, which attract more than 1.4 million spectators each year.

Winter Rules Additions Focus on Safety
December 5, 2013
Rules promoting greater player safety and improved coach-player communication highlight the playing rules changes for the winter sports season now underway at Michigan High School Athletic Association member schools across the state.
The winter sports season involves eight different sports and approximately 70,000 student-athletes. Practices began as early as late October; and tournaments begin in mid-February, running through the end of March. Competition is already underway in Girls Basketball, Bowling in the Upper Peninsula, Girls Competitive Cheer, Girls Gymnastics, Ice Hockey, and Upper Peninsula Swimming & Diving. On Saturday (Dec. 7), competition begins for Bowling and Swimming in the Lower Peninsula, as well as Wrestling. The Boys Basketball season begins on Monday (Dec. 9), and Skiing events may begin on Dec. 14.
Ice Hockey has several rules changes promoting player safety. “Blind-side” hits, checks to an unsuspecting or vulnerable player, can now be penalized; and the rule prohibiting a player form pushing, charging, cross or body-checking an opponent from behind into the boards or goal frame has reinstated the discretion for the official to issue a game disqualification when flagrant. Another safety change stops play when the goalkeeper’s glove is displaced – expanding a rule where the displacement of the keeper’s mask or helmet stops play.
Additionally, an embellishment rule has been added to discourage players from taking dives to draw penalties and exaggerating the severity of the impact of a play in which a penalty is called. Finally, when the attacking team bats the puck directly on goal, it shall result in an immediate whistle and a resulting faceoff at the defensive zone faceoff spot of the offending team.
In Basketball and Wrestling, electronic devices may now be used on the bench or in the corner for coaching purposes – for example, to show plays or keep statistics. Devices may not be used to dispute officials’ calls.
The head coach in Basketball may enter the court without penalty when a fight may break out or has broken out to prevent the situation from escalating. Players and assistant coaches who leave the bench in such situations will continue to be assessed flagrant technical fouls and be disqualified from the contest.
In keeping with rules book language published a few years ago in football, the basketball rules have added a section which limits public address announcers’ action during play. PA announcers, during game action, are limited to announcing who scores baskets and commits fouls. Any other announcements during play, like time remaining, are inappropriate. General announcements during time outs are still allowed.
In Wrestling, forfeits are no longer considered as matches when considering the five-matches-in-one-day limit for competition.
Winter tournaments begin the first full week of February in wrestling. The first MHSAA Finals of the season are the Upper Peninsula Swimming & Diving Finals on February 15, and tournaments conclude with the Boys Basketball Semifinals & Finals, March 21-22.