

Participation Stays Above Enrollment Dip
July 13, 2017
By Geoff Kimmerly
Second Half editor
Enrollment in Michigan High School Athletic Association member high schools continued a trend of slight declines in 2016-17, but participation in sports held firm as records were set in three of the 28 sports for which postseason tournaments are sponsored by the MHSAA.
A total of 283,625 participants competed in MHSAA-sponsored sports this past school year, down 0.21 percent from 2015-16. However, this year’s decrease falls in line with a decrease in enrollment at member schools of 0.40 percent. The overall MHSAA participation totals count students once for each sport in which they participate, meaning students who are multiple-sport athletes are counted more than once.
Despite a drop in girls enrollment of 0.60 percent in 2016-17, girls participation increased for the second straight school year to 119,937 participants, an increase of 0.55 percent. Boys overall participation fell 0.76 percent to 163,688 participants, slightly sharper than the drop in boys enrollment of 0.21 percent for the school year. However, eight girls sports and eight boys sports saw increases in participation in 2016-17.
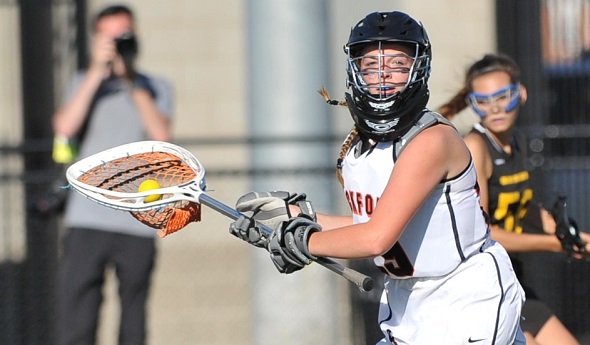
Boys and girls lacrosse continued their record-setting climb, boys lacrosse with 5,114 participants to increase 3.3 percent from 2015-16 and break its record set in 2013-14. Girls lacrosse saw 2,814 participants, an increase of 1.4 percent from the previous year, to continue its streak of setting a participation record every season since becoming a sponsored tournament sport in 2005. Boys cross country also set a record for the second straight season, this time with an increase of 1.7 percent to 9,415 participants total.
Good news also came from girls basketball, which ended a string of 10 straight declines in participation with an increase of 2.2 percent in 2016-17 – those 15,896 participants were the most in the sport since 2013-14. The largest percentage increases by far in 2016-17 were seen in boys and girls skiing, which were up 16.4 and 14.4 percent, respectively, with 837 boys participants and 746 girls after both experienced decreases in participation the school year before.
A number of other sports also saw increases on both the boys and girls’ sides: swimming & diving saw a 5.2 percent increase for boys and 4.1 increase for girls, track & field saw a 2.4 percent increase for girls and 1.9 percent increase for boys, girls cross country joined its boys counterpart with a 1.0 percent increase in participation, and tennis saw a 2.8 percent increase for girls and 0.48 increase for boys. That boys tennis increase ended a string of seven straight years of declining participation.
Other sports to see increases in 2016-17 were girls golf, increasing for the second straight season, this time 2.9 percent to 3,561 participants; boys ice hockey, up 1.8 percent to 3,411 participants; and boys soccer up 0.38 percent to 14,630 participants.
Also of note in this year’s survey:
• The increase in participation for 16 sports during 2016-17 was compared to an increase in 15 sports for 2015-16 and only eight sports in 2014-15.
• After a significant slowing in participation decline in football over the previous three years, 2016-17 saw a decline of 4.6 percent, or 1,805 participants from 2015-16. The number of school-sponsored football programs remained consistent over the last two years – there were 642 in 2015-16 and 640 in 2016-17 (up from 630 in 2014-15). But there was a shift of programs from 11-player to 8-player; there were 15 fewer 11-player programs in 2016-17 than the year before, but 13 more 8-player programs.
• Of the 12 MHSAA sports that saw participation declines in 2016-17, three were by mere hundredths of a percent. Boys wrestling saw a decline of three participants total, girls gymnastics had two fewer participants and boys golf participation decreased by one person.
The participation figures are gathered annually from MHSAA member schools to submit to the National Federation of State High School Associations for compiling of its national participation survey. Results of Michigan surveys from the 2000-01 school year to present may be viewed by clicking here.
The following chart shows participation figures for the 2016-17 school year from MHSAA member schools for sports in which the Association sponsors a postseason tournament:
|
BOYS |
GIRLS |
|||
SPORT |
SCHOOLS (A) |
PARTICIPANTS |
SCHOOLS (A) |
PARTICIPANTS (B) |
|
Baseball |
635/656/6 |
17,989 |
- |
0/9 |
|
Basketball |
722/735/1 |
21,263 |
690/725 |
15,896/4 |
|
Bowling |
363/381/10 |
3,792 |
341/369 |
2,926/24 |
|
Competitive Cheer |
- |
- |
334/349 |
6,720 |
|
Cross Country |
618/649/0 |
9,415 |
609/646 |
8,489 |
|
Football - 11 player |
580/592/87 |
36,460 |
- |
0/111 |
|
- 8-player |
60/61/11 |
1,130 |
- |
14 |
|
Golf |
496/526/59 |
6,170 |
329/342 |
3,561/100 |
|
Gymnastics |
- |
- |
72/88 |
636 |
|
Ice Hockey |
233/257/14 |
3,397 |
|
0/14 |
|
Lacrosse |
147/153/3 |
5,110 |
107/107 |
2,814/4 |
|
Skiing |
92/102/3 |
830 |
89/103 |
746/7 |
|
Soccer |
481/499/23 |
14,541 |
459/483 |
13,212/89 |
|
Softball |
- |
- |
616/646 |
13,641 |
|
Swimming & Diving |
243/274/12 |
4,919 |
256/283 |
5,600/60 |
|
Tennis |
293/309/9 |
6,085 |
327/341 |
8,920/21 |
|
Track & Field |
655/683/0 |
23,232 |
648/681 |
17,009/0 |
|
Volleyball |
- |
- |
704/720 |
19,067 |
|
Wrestling |
459/483/159 |
9,355 |
- |
0/2 |
(A) The first number is the number of schools reporting sponsorship on the Sports Participation Survey. The second number indicates schools sponsoring the sport including primary and secondary schools in cooperative programs as of May 22, 2017. The third number indicates the number of schools that had girls playing on teams consisting primarily of boys.
(B) The second number indicates the number of additional g

Week 6 Football Playoff Listing
September 26, 2012
Here is a list of Michigan High School Athletic Association football playing schools, displaying their win-loss records and playoff averages through the fifth week of the season. Schools on this list are in enrollment order. An asterisk (*) beside a record indicates that a team has eight or fewer games scheduled. A carrot (^) beside a school’s name indicates that a team is one win away from playoff qualification.
Those schools with 11-player teams with six or more wins playing nine-game schedules, or five or more wins playing eight games or fewer, will qualify for the MHSAA Football Playoffs beginning Oct. 26-27. Schools with 5-4, 4-3 or 4-4 records may qualify if the number of potential qualifiers by win total does not reach the 256 mark. Schools with six or more wins playing nine-game schedules or five or more wins playing eight games or fewer may be subtracted from the field based on playoff average if the number of potential qualifiers exceeds the 256 mark.
Once the 256 qualifying schools are determined, they will be divided by enrollment groups into eight equal divisions of 32 schools, and then drawn into regions of eight teams each and districts of four teams each.
Those schools with 8-player teams will be ranked by playoff average at season’s end, and the top 16 programs will be drawn into regions of eight teams each for the playoff in that division, which also begins Oct. 26-27.
To review a list of all football playoff schools, individual school playoff point details and to report errors, visit the Football page of the MHSAA Website.
The announcement of the qualifiers and first-round pairings for both the 11 and 8-player playoffs will take place at 7 p.m. on Oct. 21 on the Selection Sunday Show on FOX Sports Detroit. The playoff qualifiers and pairings will be posted to the MHSAA Website following the Selection Sunday Show.
---------------------------------------------------------------------------------
11-Player Playoff Listing
|
1. |
Utica Eisenhower |
2772 |
3-2 |
62.000 |
|
2. |
Sterling Heights Stevenson |
2766 |
4-1 |
75.800 |
|
3. |
Clarkston ^ |
2721 |
5-0 |
94.400 |
|
4. |
Grand Blanc |
2644 |
3-2 |
57.600 |
|
5. |
Macomb Dakota |
2608 |
4-1 |
80.600 |
|
6. |
Lake Orion ^ |
2565 |
5-0 |
96.000 |
|
7. |
Rockford |
2526 |
3-2 |
57.400 |
|
8. |
Troy |
2502 |
3-2 |
57.400 |
|
9. |
Clinton Township Chippewa Valley |
2462 |
4-1 |
77.000 |
|
10. |
Dearborn Fordson |
2442 |
4-1 |
83.400 |
|
11. |
Holland West Ottawa |
2262 |
4-1 |
71.000 |
|
12. |
Northville |
2220 |
3-2 |
60.400 |
|
13. |
Detroit Cass Tech |
2200 |
4-1 |
77.400 |
|
14. |
Canton |
2166 |
3-2 |
51.200 |
|
15. |
Monroe ^ |
2154 |
5-0 |
83.200 |
|
16. |
Detroit Catholic Central |
2060 |
3-2 |
47.800 |
|
17. |
Plymouth |
2050 |
4-1 |
71.200 |
|
18. |
Salem |
2039 |
4-1 |
75.600 |
|
19. |
Livonia Stevenson |
2005 |
4-1 |
77.200 |
|
20. |
Holt |
1992 |
3-2 |
57.200 |
|
21. |
Hartland ^ |
1932 |
5-0 |
91.200 |
|
22. |
Warren Mott ^ |
1879 |
5-0 |
86.400 |
|
23. |
Livonia Churchill ^ |
1877 |
5-0 |
100.800 |
|
24. |
Walled Lake Central |
1857 |
3-2 |
52.200 |
|
25. |
Macomb L'Anse Creuse North |
1853 |
3-2 |
58.400 |
|
26. |
Saline |
1849 |
4-1 |
72.400 |
|
27. |
Grandville |
1846 |
3-2 |
53.600 |
|
28. |
Flint Carman-Ainsworth ^ |
1772 |
5-0 |
88.000 |
|
29. |
Grand Ledge |
1743 |
4-1 |
70.600 |
|
30. |
Rochester |
1725 |
4-1 |
72.800 |
|
31. |
Traverse City West |
1720 |
4-1 |
72.200 |
|
32. |
White Lake Lakeland |
1700 |
4-1 |
72.400 |
|
33. |
Harrison Township L'Anse Creuse |
1680 |
3-2 |