

Skip the lines: Get Finals Tickets Here
February 28, 2012
Avoid lines at the ticket window by ordering and downloading your MHSAA Finals E-tickets for cheer, individual wrestling, girls and boys basketball from our partner vendor web sites.
Hockey, Cheer and Girls Basketball Finals are on sale now, with Boys Basketball Finals tickets going on sale at 10 a.m. March 5. See below on how to order each:
- Girls Basketball Finals tickets are on sale either online or via phone. Tickets can be ordered online by clicking this Breslin Center Box Office link or over the phone by calling (800) 968-2737. Tickets cost $8, with a $3 service charge applied to each order. All girls basketball seats are general admission. The Girls Basketball Semifinals are March 15-16, with all Four Finals on March 17.
- Boys Basketball Finals tickets go on sale via the Breslin Center Box Office on March 5. Tickets can be ordered online by clicking this Breslin Center Box Office link or over the phone by calling (800) 968-2737. As with girls basketball, tickets cost $8, with a $3 service charge applied to each order. However, Boys Basketball Semifinals and Finals seats are reserved in Breslin’s lower bowl, with general admission for the upper deck. The Boys Basketball Semifinals are March 22-23, with all four Finals on March 24.
- Cheer tickets are available via online vendor TicketLeap. They cost $7 – plus a 97-cent processing fee per ticket – for each of the four sessions, with a separate ticket required for entry to each. The Division 1 Final is 6 p.m. Friday at the Grand Rapids Delta Plex, with Division 2 at 10 a.m. Saturday and followed that day by Division 4 at 2 p.m. and Division 3 at 6 p.m. Cheer online ticket sales end at 4 p.m. Friday. The paper E-ticket must be presented at the gate.
- Hockey tickets are available via online vendor TicketLeap. They cost $6 per Semifinal session and $7 per Final session, plus the 97-cent processing fee per ticket. Each division’s Semifinals and each of the three Finals count as separate sessions. The Division 2 Semifinals begin at 5 p.m. March 8 at Plymouth’s Compuware Arena, with the Division 3 Semifinals at noon March 9 and Division 1 at 6 p.m. that day. The Division 2 Final is at 10 a.m. March 10, followed by Division 3 at 2 p.m. and Division 1 at 6 p.m. The paper E-ticket must be presented at the gate. Hockey online ticket sales end two hours before each session.
Scholars and Athletes 2016: Class C, D
By
Geoff Kimmerly
MHSAA.com senior editor
February 1, 2016
By Geoff Kimmerly
Second Half editor
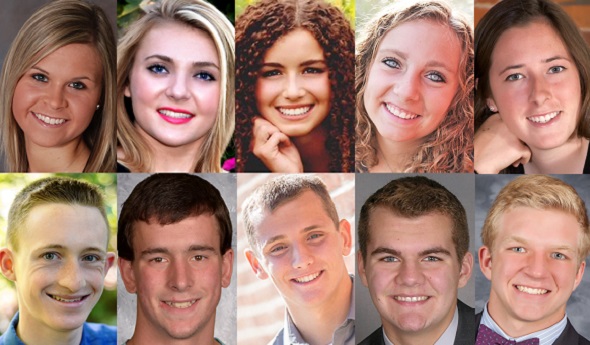
The Michigan High School Athletic Association has selected 10 student-athletes from Class C and D member schools to receive scholarships through the Farm Bureau Insurance Scholar-Athlete Award program.
 Farm Bureau Insurance, in its 27th year of sponsoring the award, will give $1,000 college scholarships to 32 individuals who represent their member schools in at least one sport in which the Association sponsors a postseason tournament. The first 30 scholarships are awarded proportionately by school classification and the number of student-athletes involved in those classes; also, there are two at-large honorees which can come from any classification.
Students applying for the Scholar-Athlete Award must be carrying at least a 3.5 (on a 4.0 scale) grade-point average and have previously won a letter in a varsity sport in which the Michigan High School Athletic Association sponsors a postseason tournament. Other requirements for the applicants were to show active participation in other school and community activities and produce an essay on the importance of sportsmanship in educational athletics.
Each of the scholarship recipients will be honored at halftime ceremonies of the Class C Boys Basketball Final game March 26 at the Breslin Student Events Center in East Lansing. Commemorative medallions will be given to the finalists in recognition of their accomplishments.
The Class C Scholar-Athlete Award honorees are: Michael Klettner, Traverse City St. Francis; Spencer Graham Knizacky, Mason County Central, Daniel R. McMichael, Bronson; Alexa Ratkowski, Bronson; Mallory Raven, Morley Stanwood; and Hannah Steffke, Beal City.
The Class D Scholar-Athlete Award recipients are: Daniel Good, Owendale-Gagetown; Nathaniel Jones, Muskegon Catholic Central; Elizabeth Munoz, Leland; and Averi Rachelle Munro, Morrice.
Overviews of the scholarship recipients of the Class C Scholar-Athlete Award follow. A quote from each recipient's essay also is included:
Alexa Ratkowski, Bronson
Played four seasons of varsity volleyball and three of varsity basketball, and helped her volleyball team to the Class C championship in the fall. Set MHSAA record for career assists and also sits among all-time leaders for career aces. Earned all-state volleyball recognition all four seasons, making the first team as a senior, and earned all-league basketball honors as a junior. Served as volleyball captain three seasons and is her basketball team’s captain this winter. Serving fourth year as class treasurer and first as student council treasurer, and also serving as National Honor Society president. Participated in Make a Difference committee three years and 4-H all four of high school, earning multiple awards for crafts and showmanship. Volunteers as instructor and referee for youth volleyball and basketball programs, at her church and as a classroom mentor to middle and elementary school students. Will attend either Central Michigan University or Grand Valley State University and study elementary education.
Essay Quote: “Soon it became evident to me that what was important wasn’t how far we went in the tournament, but that fellow athletes, coaches and rival communities were coming together as one athletic unit to show genuine concern and support for our coach in the most significant battle of her life. That’s what true sportsmanship is all about!”
Mallory Raven, Morley Stanwood
Played two years of varsity volleyball, playing fourth of varsity basketball and will play her fourth of varsity softball in the spring. Helped volleyball team to three District championships, basketball team to one and softball team to two District titles. Earned all-state honorable mention in softball and all-conference honors in softball and basketball; served as captain of both basketball and softball teams. Has served as student council co-president, National Honor Society vice president and twice as class president. Also has served four years on the Mecosta County Youth Advisory Council and three as part of Project Outreach. Earned 33 college credits through dual enrollment at Ferris State University and Mid Michigan Community College. Volunteered as part of Big Brothers/Big Sisters Lunch Buddy program and Salvation Army, and attended Michigan Youth Leadership and Women in Sports Leadership programs. Will attend University of Michigan and study biomedical engineering.
Essay Quote: “Sportsmanship is the character that teaches us lessons when wins and losses fail to do so. It is universal and unbending, and it has made me a better person through the sports that I have played, the teammates I hold dear and the opponents that are not so unfamiliar to me anymore.”
Hannah Steffke, Beal City
Ran four seasons of varsity cross country and will participate in her fourth of varsity track and field. Helped her cross country team to MHSAA championships in 2010 and 2011 while setting the school individual race record, and was part of an MHSAA title-winning 3,200-meter relay team; she also holds school records as part of that relay and in the individual 3,200. Earned all-state honors in cross country all four seasons and track and field the last two, and academic all-state honors in cross country the last three seasons and track and field as a sophomore and junior. Served as cross country team captain the last two years. Serving fourth year on student council and as vice president, and also as National Honor Society service vice president. Participating in fourth years of concert, marching and jazz bands and as drum major for second year. Served in Youth in Government four years. Is undecided where she’ll attend college and on her planned course of study.
Essay Quote: “To me, the cliché saying, ‘I didn’t come here to make friends’ is completely backward. … In fact, those girls who are my fiercest competitors are often those who I have become the best friends with, and the meets where I’m racing my friends are always the most enjoyable.”
Michael Klettner, Traverse City St. Francis
Played four seasons of varsity soccer, leading the team in goals as a senior and making the all-state third team in Division 3. Also earned all-District honors three times. Participated as part of his school’s cross country ski team four seasons and earned awards as its “outstanding skier” and for highest grade-point average as a junior. Served as boys soccer team and cross country ski team captain the last two seasons. Participating in fourth year as part of school’s marching and concert bands and also as part of its general and ensemble choirs. Has earned superior ratings at the band state festival and excellent ratings for solo and ensemble choir. Participated in Boy Scouts three years of high school, attaining Eagle Scout as a freshman, and is in his second year of National Honor Society serving as an officer this school year. Will attend University of Michigan and study computer science engineering.
Essay Quote: “Throughout my high school career, among the multiple soccer games and ski races, it never fails to amaze me how common sportsmanship is, especially during the most heated battles between rival schools. Athletics is just a game, but with sportsmanship, it has the ability to be so much more.”
Spencer Graham Knizacky, Mason County Central
Played three seasons of varsity football, is competing in fourth season of varsity wrestling and will play his fourth season of varsity baseball this spring. Earned all-conference honors in football and baseball and is a two-time MHSAA Finals placer in wrestling. Served or is serving as captain of all three of his high school teams. Earned academic all-state in wrestling and all-District in both football and baseball. Volunteered as a member of both the baseball and wrestling programs in local construction and yard work projects. Also volunteers as part of his local Pop Warner league, youth wrestling program and as an athletic concessions worker, and is in third year as part of National Honor Society. Will attend Ferris State University and study mechanical engineering technology.
Essay Quote: “Sportsmanship isn’t all about being respectful and playing fair during the game. How a player reacts after a game is important too. Whining after a loss is wrong, just like bragging after a win. You need to be able to win and stay humble, or lose with grace. Even in adulthood, you need to be able to move on after something goes wrong, or stay modest after you’ve made a huge accomplishment.”
Daniel R. McMichael, Bronson
Played four seasons of varsity football and basketball and will play his fourth of varsity baseball this spring. Earned all-conference recognition in baseball and football and served as team captain for both teams. Participating in National Honor Society for second year and is vice president this school year, and also is a member of the National Technical Honor Society. Participating in second year of local Family, Career and Community Leaders of America chapter and as vice president this school year. Serving in his fourth year of student government and currently as secretary, and has been a class officer all four years of high school and currently is vice president. Serves as a student advisor for Bronson’s Education Academy Advisory Committee and has volunteered as part of a local kids day and rocket football programs. Will attend Adrian College and study secondary education.
Essay Quote: “Knowing that they were there watching my every move made me realize that there are always opportunities to show the next generation of athletes the right way to act both on and off the field. … I know that I have tried to pass along to those that follow behind me a lesson of good sportsmanship, leadership and a good worth ethic.”
Other Class C girls finalists for the Scholar-Athlete Award were: Molly Lynch, Bloomfield Hills Academy of the Sacred Heart; Kelsey Engstrom, Charlevoix; Ellen Doyle, Gobles; Hanna Angst, Laingsburg; Julia Angst, Laingsburg; Bailee Kimbel, Manton; Jordyn Sanders, Mason County Central; Shelby Vincke, New Lothrop; and Christiana M. Jones, White Cloud.
Other Class C boys finalists for the Scholar-Athlete Award were: Joseph Comstock, Addison; Quentin E. Millette, Ann Arbor Greenhills; Sawyer Cuthrell, Cass City; Anthony Hoholik, Manistique; Cameron Brayman, Montague; Broc Roberts, Petersburg-Summerfield; Trenden Peacock, Sand Creek; Dylan Marshall, St Ignace; and Bowman Seabrook, White Cloud.
Overviews of the scholarship recipients of the Class D Scholar-Athlete Award follow. A quote from each recipient's essay also is included:
Elizabeth Munoz, Leland
Playing her fourth season of varsity basketball and will play her fourth season of varsity soccer this spring. Scored her 1,000th career point in basketball as a junior and holds the MHSAA single-season girls soccer record with 84 points; she also ranks second for single-season goals with 64 she scored as a sophomore. Earned all-state honors in both sports, making the first team in soccer twice and basketball last season. Served as basketball captain last season and again this winter, and will serve as soccer captain this spring. Serving as class president for fourth year and participating in third year of National Honor Society and fourth year of Natural Helpers. Participating in school choir for first time and also assists in her family’s business. Will attend Kalamazoo College and study biology with a focus on pre-medicine.
Essay Quote: “Though many high schoolers may not know it, the ‘big kids’ are role models for the elementary students, especially at a small school. They quickly pick up on reactions to certain situations. As they grow, children slowly mold into who they see their role models to be based on what they have seen watching them play their favorite sports.”
Averi Rachelle Munro, Morrice
Played four seasons of varsity volleyball and basketball and will play her fourth of varsity softball in the spring. Owns Morrice school records for career home runs, career runs batted in and career hits and has played on four District championship teams – one in volleyball, two in softball and one in basketball. Earned all-state recognition in softball twice, once at catcher and once at shortstop; all-state honorable mention in basketball and all-league honors in volleyball. Participated in volunteer projects as part of her school’s National Honor Society chapter and softball program, and also organized fundraisers to assist school’s Field of Dreams committee and a teacher receiving chemotherapy. Served as class president last five years and as her student council’s president. Will attend Alma College and study physics.
Essay Quote: “I work very hard on both the field and the courts, not just playing my game, but also by always doing my best to set an example of true sportsmanship. By doing this I honor myself, my team, my coach, my school and my family. As I have learned from high school sports, my behavior is a direct reflection of me and, as my grandfather taught me, there is no looking back and no changing what has been done.”
Daniel Good, Owendale-Gagetown
Played four seasons of varsity football, three of basketball and will play fourth season of varsity baseball and second of varsity golf this spring. Helped football team to undefeated regular season in the fall and earned all-league honors in that sport the last two seasons; also earned all-league recognition in baseball and golf and served as captain of the basketball and football teams. Serving in student government for fourth year, this year as vice-president after two as class president. Playing in school band for fourth year and third year as part of the Lions of Michigan All State Band. Participating in National Honor Society for third year and on yearbook staff for second. Will attend Michigan State University and study mechanical engineering.
Essay Quote: “One of the schools in our league is the Flint-located Michigan School for the Deaf. The players and the coaches on my school’s team look at our games with MSD as a great opportunity for both teams to have fun playing football and to learn about each other. … My connection with MSD has helped shape me into a hard-working, more understanding athlete and student. From this unique experience in sportsmanship, I’ve learned amazing things from diverse people and their lives.”
Nathaniel Jones, Muskegon Catholic Central
Played four seasons of varsity football, three of varsity basketball, will play his third of varsity baseball this spring and also swam as a freshman and sophomore. Played on four MHSAA championship teams, three for football and one for baseball, and all three of his teams won league titles in 2014-15. Earned all-state honors in football in the fall and honorable mention as a junior, and helped all four of his high school teams to academic all-state honors. Served as football captain in the fall and basketball captain this winter. Participating in student government and National Honor Society for third year each and is ranked number one academically in his class. Playing fourth year with school’s jazz/symphonic band and has volunteered as part of Muskegon Public Schools' summer school program, Fellowship of Christian Athletes and the American Red Cross. Received the Kettering University Science and Technology Award and Rotary Life Leadership Award. Will attend Hillsdale College and study aerospace engineering and physics.
Essay Quote: “As athletes, we strive to better ourselves each day with self-discipline, hard work, passion and unwavering effort. Educational athletics provide the foreground for a mutual appreciation for these values between athletes, coaches and fans. Through healthy competition, we bring out the best in each other, thus propelling each other to grow as athletes and individuals.”
Other Class D girls finalists for the Scholar-Athlete Award were: Lindsay Lampman, Bellaire; Chloe Niepoth, Bellaire; Maria Stankewicz, Crystal Falls Forest Park; Abby Sutherland, Lake Linden-Hubbell; Natalie Frances Beaulieu, Newberry; and Paige Blake, Ontonagon.
Other Class D boys finalists for the Scholar-Athlete Award were: Garrett Kraatz, Allen Park Inter-City Baptist; Joshua Robert Riggs, Brethren; Matthew Gratowski, DeTour; Gregory Scott Seppanen, Eben Junction Superior Central; Jayvin Wolfe, Fulton-Middleton; and Benjamin Turner, Sterling Heights Parkway Christian.
The Class B scholarship award recipients will be announced Feb. 9, and the Class A honorees will be announced Feb. 16.
Farm Bureau Insurance of Michigan was founded in 1949 by Michigan farmers who wanted an insurance company that worked as hard as they did. Those values still guide the company today and are a big reason why it is known as Michigan’s Insurance Company, dedicated to protecting the farms, families, and businesses of this great state. Farm Bureau Insurance agents across Michigan provide a full range of insurance services—life, home, auto, farm, business, retirement, Lake Estate®, and more—protecting nearly 500,000 Michigan policyholders.
The MHSAA is a private, not-for-profit corporation of voluntary membership by more than 1,400 public and private senior high schools and junior high/middle schools which exists to develop common rules for athletic eligibility and competition. No government funds or tax dollars support the MHSAA, which was the first such association nationally to not accept membership dues or tournament entry fees from schools. Member schools which enforce these rules are permitted to participate in MHSAA tournaments, which attract more than 1.4 million spectators each year.