

Skip the lines: Get Finals Tickets Here
February 28, 2012
Avoid lines at the ticket window by ordering and downloading your MHSAA Finals E-tickets for cheer, individual wrestling, girls and boys basketball from our partner vendor web sites.
Hockey, Cheer and Girls Basketball Finals are on sale now, with Boys Basketball Finals tickets going on sale at 10 a.m. March 5. See below on how to order each:
- Girls Basketball Finals tickets are on sale either online or via phone. Tickets can be ordered online by clicking this Breslin Center Box Office link or over the phone by calling (800) 968-2737. Tickets cost $8, with a $3 service charge applied to each order. All girls basketball seats are general admission. The Girls Basketball Semifinals are March 15-16, with all Four Finals on March 17.
- Boys Basketball Finals tickets go on sale via the Breslin Center Box Office on March 5. Tickets can be ordered online by clicking this Breslin Center Box Office link or over the phone by calling (800) 968-2737. As with girls basketball, tickets cost $8, with a $3 service charge applied to each order. However, Boys Basketball Semifinals and Finals seats are reserved in Breslin’s lower bowl, with general admission for the upper deck. The Boys Basketball Semifinals are March 22-23, with all four Finals on March 24.
- Cheer tickets are available via online vendor TicketLeap. They cost $7 – plus a 97-cent processing fee per ticket – for each of the four sessions, with a separate ticket required for entry to each. The Division 1 Final is 6 p.m. Friday at the Grand Rapids Delta Plex, with Division 2 at 10 a.m. Saturday and followed that day by Division 4 at 2 p.m. and Division 3 at 6 p.m. Cheer online ticket sales end at 4 p.m. Friday. The paper E-ticket must be presented at the gate.
- Hockey tickets are available via online vendor TicketLeap. They cost $6 per Semifinal session and $7 per Final session, plus the 97-cent processing fee per ticket. Each division’s Semifinals and each of the three Finals count as separate sessions. The Division 2 Semifinals begin at 5 p.m. March 8 at Plymouth’s Compuware Arena, with the Division 3 Semifinals at noon March 9 and Division 1 at 6 p.m. that day. The Division 2 Final is at 10 a.m. March 10, followed by Division 3 at 2 p.m. and Division 1 at 6 p.m. The paper E-ticket must be presented at the gate. Hockey online ticket sales end two hours before each session.
Scholars and Athletes 2015: Class C, D
By
Geoff Kimmerly
MHSAA.com senior editor
February 2, 2015
By Geoff Kimmerly
Second Half editor
The Michigan High School Athletic Association has selected 10 student-athletes from Class C and D member schools to receive scholarships through its Scholar-Athlete Award program.
 Farm Bureau Insurance, in its 26th year of sponsoring the award, will give $1,000 college scholarships to 32 individuals who represent their member schools in at least one sport in which the Association sponsors a postseason tournament. The first 30 scholarships are awarded proportionately by school classification and the number of student-athletes involved in those classes; also, there are two at-large honorees which can come from any classification.
Each of the scholarship recipients will be honored at halftime ceremonies of the Class C Boys Basketball Final game March 28 at the Breslin Student Events Center in East Lansing. Commemorative medallions will be given to the finalists in recognition of their accomplishments.
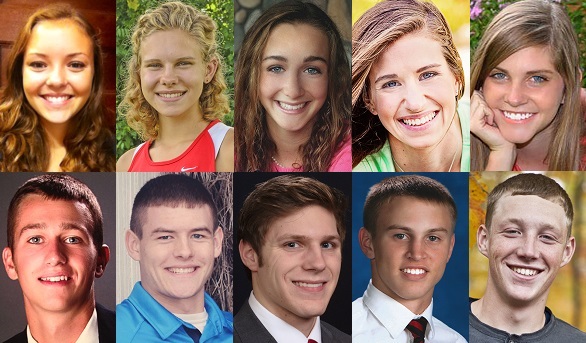
The Class C Scholar-Athlete Award honorees are: Maggie Belcher, Springport; Ryan Karapas, Clinton; Mallory Munderloh, St Louis; Emily Elizabeth Steffke, Beal City; Connor Thomas, Marlette; and Pierce Vreeland, Gobles.
The Class D Scholar-Athlete Award recipients are: Margo Brown, St. Ignace; Kevin Greenman, Battle Creek St. Philip; Travis McCormick, Mason County Eastern; and Rachelle Trafford, Lansing Christian.
Overviews of the scholarship recipients of the Class C Scholar-Athlete Award follow. A quote from each recipient's essay also is included:
Maggie Belcher, Springport
Ran four seasons of varsity cross country and will play her fourth of soccer and run her fourth of track and field this spring; played first season of varsity basketball this winter. Named captain of soccer team as a sophomore and earned all-league academic honors in cross country and track and field. Served on school’s student council for three years including as executive president this year, executive vice president as a junior and class treasurer as a sophomore. Also served as a delegate and then regional and state co-host for Michigan Association of Student Councils and Honor Societies. Named marching band’s drum major from 2012-14 and founded the school’s debate team in 2013. Competed in Destination Imagination regional and state competitions and in multiple Future Farmers of America state competitions. Attended Mercy College Business Leadership Academy in New York. Remains undecided on where she will attend college, but will study cultural anthropology.
Essay Quote: “Sportsmanship is knowing there’s a larger picture, that there is a reward more valuable than the greedy pursuit of trophies/titles. Sportsmanship is a code that distinguishes the good players from the excelled athlete.”
Mallory Munderloh, St. Louis
Ran four seasons of varsity cross country and will run her fourth of track and field this spring. Qualified for the MHSAA Cross Country Finals as a freshman and senior and also served as team captain this fall; earned all-league honors all four years and academic all-state in her final season. Qualified for MHSAA Track and Field Finals two seasons in distance events and the last three as part of her school’s 3,200 relay. Earned all-state recognition when her relay finished fifth at the 2013 Lower Peninsula Division 3 Finals. Participating in National Honor Society for second year. Participated in Business Professionals of America three years and qualified for state competitions in 2012 and 2013. Served on school’s Youth Advisory Council the last two years. Will attend Alma College and study pre-medicine.
Essay Quote: “In his determination, the sportsman is quiet. He doesn’t put down his opponents when he wins. The sportsman respects the work and toil of his competitors and considers it an honor to compete with them. In the same way, he doesn’t ridicule his opponents when he is beaten. The sportsman accepts his defeat and remembers it when he is training.”
Emily Elizabeth Steffke, Beal City
Ran four seasons of varsity cross country and will run her fourth of track and field this spring. Earned all-state honors in cross country all four seasons and academic all-state honors her last three while leading the team to MHSAA Lower Peninsula Division 4 championships in 2013 and 2014. Earned athletic and academic all-state honors for track and field the last two seasons; her 3,200 relay won at last spring’s LP Division 4 Final. Named a semifinalist for National Merit and Coca-Cola Foundation scholarships. Participating in her marching, concert and jazz bands for the fourth year and earned multiple state competition awards for piano and flute performance. Participating in National Honor Society for second year and served on student council four years. Participated in Youth in Government three years and MyLead Michigan Youth Leadership in 2013. Will attend either Yale University or Michigan State University and is considering studying pre-medicine.
Essay Quote: “After finishing a race, I turn to the runners around me. … The fellowship I feel with these girls is born of conquering a race’s and each other’s demands better together, and it can spark lasting friendships.”
Ryan Karapas, Clinton
Played two seasons of varsity football, three of varsity basketball and expects to play his fourth of varsity golf this spring. Served as captain of all three teams, earning all-conference honors in football and basketball and tying for league scoring lead in golf. Helped football team to 2013 MHSAA Division 6 Final, the basketball team to multiple District titles and the golf team to a league championship. Participated in National Honor Society the last three years, including as president this school year, and is on pace to finish as his class’ valedictorian. Also participated in local “Relay for Life” for three years and as a peer tutor as a junior, and was selected for a Rotary Youth Leadership Award. Remains undecided on where he will attend college, but will study business.
Essay Quote: “Whether it’s on the court, in the classroom, or somewhere where no one is looking, we will all run into situations where we are faced with doing the right thing or something that we know is less. Learning and demonstrating sportsmanship here and now is a great stage for the challenges and opportunities
Connor Thomas, Marlette
Played three seasons of varsity football, two of varsity basketball and will run his fourth of track and field this spring. Earned all-state honorable mention and all-conference honors in football this fall, all-conference honorable mention in basketball and all-conference honors as a sprinter and middle distance runner in track and field – while also earning all-league scholar-athlete recognition in all three sports. Served as captain of both the football and basketball teams; helped the basketball team to a District championship and the track and field team to a Regional title. Served on his school’s student council all four years and as his class’ president the first three; he’s serving as his National Honor Society chapter’s president this school year. Also is serving his second year as a member of the MHSAA Student Advisory Council. Will attend Oakland University and study business.
Essay Quote: “Many people think it’s strange that I can uphold a friendship with multiple rival athletes and still maintain my competitive edge in the best interest of my team. … Their perception of me as a fair opponent is what encourages them to pursue a friendship with me.”
Pierce Vreeland, Gobles
Expects to finish with nine varsity letters – three each in football, basketball and track and field – and he also played junior varsity baseball as a freshman. Served as captain of football team the last two seasons and was named all-conference after both, and also second-team all-conference in basketball as a junior. Placed sixth in long jump and seventh in high jump at last season’s Lower Peninsula Division 4 Track and Field Finals and was named academic all-state in that sport. Participating in National Honor Society for third year and is his chapter’s vice president. Volunteers as youth basketball official and coach and as a mentor as part of Big Brothers Big Sisters. Will attend the University of Michigan and study nuclear engineering.
Essay Quote: “In January, I was given the opportunity to co-coach a fourth grade basketball team with my father. Along with the opportunity came an enormous responsibility of teaching and mentoring 14 energetic 9 and 10-year-olds. Working with the players on a regular basis, I saw first-hand how teaching fair play is just as important as showing them how to execute a lay-up correctly.”
Other Class C girls finalists for the Scholar-Athlete Award were: Nicole Gross, Beal City; Skyler Sobeski, Bronson; Marti Ann Pirkola, Iron Mountain; Mary Grace Fries, Jackson Lumen Christi; Lauren M. Skidmore, Oscoda; Jami Hubbard, Reading; Katie Burmester, Roscommon; Erica Treiber, Unionville-Sebewaing; and Bridget Dewan, Wixom St Catherine.
Other Class C boys finalists for the Scholar-Athlete Award were: Deontay Walker, Bath; Nicholas Pung, Beal City; Blaine Michael Stowe, East Jackson; Cole Rossato, Iron Mountain; Mark Holmgren, Ishpeming; Jason Bell, Negaunee; Jacob Dibbet, Roscommon; Daniel Brown, Springport; and Aaron J. Watson, Union City.
Overviews of the scholarship recipients of the Class D Scholar-Athlete Award follow. A quote from each recipient's essay also is included:
Margo Brown, St. Ignace
Intends to compete in fourth varsity seasons this spring of golf and track and field. Also has played four seasons of varsity basketball, joining that team during the postseason as a freshman, and three of volleyball after joining that varsity during her sophomore season. Served as captain of volleyball and basketball teams; contributed to basketball teams that won the MHSAA Class D title in 2013 and finished runner-up in Class C in 2014, volleyball teams that won two District titles and track and field teams that won three MHSAA Finals championships. Won MHSAA Finals individual golf titles the last two years and earned all-state track honors. Serving as class president for fourth year and carries a 4.0 grade-point average. Participated in marching, concert and jazz band and on the robotics team. Will attend Ferris State University to study accounting and has signed a letter of intent to play basketball.
Essay Quote: “Sportsmanship is all about enjoying participating in the sport(s) you are in. When an athlete displays they are having fun playing the game, it shows their heart and love of the game.”
Rachelle Trafford, Lansing Christian
Playing fourth varsity season of basketball and will play second full varsity season of soccer this spring after joining that top team during her freshman and sophomore seasons; also played two full seasons of varsity volleyball after joining that varsity as a sophomore, and ran varsity cross country as a junior. Helped the soccer team to MHSAA Semifinals in 2013 and 2014, the basketball team to two Regional titles and the volleyball team to two District titles. Earned all-area soccer honors in the spring. Participating in National Honor Society for the third year. Volunteered and served as teen leader in a variety of Stepping Stone Foundation projects. Also served as teen leader during outdoor adventure trips to Tennessee and West Virginia and a mission trip to Mississippi. Will attend Michigan State University or Grand Valley State University and study pre-veterinary medicine.
Essay Quote: “When we make situations in life about ourselves and our achievements, the result can be devastating for everyone involved. … I work hard to be the best I can be, to play with the best, against the best, and walk away knowing I treated my teammates, coaches, officials and opponents with the utmost respect.”
Kevin Greenman, Battle Creek St. Philip
Played four years of varsity football, three of varsity basketball and will run his fourth of track and field this spring. Captained all three teams including the football and track and field teams both for the three seasons. Earned all-conference honors in both of those sports; helped the football team to Regional Finals three seasons, the basketball team to league and Regional titles and the track and field team to a league title while qualifying for the MHSAA Lower Peninsula Division 4 Finals in two events. Participating for second year as part of the Battle Creek Community Foundation’s Youth Alliance Committee and is a two-year member of the National Honor Society. Volunteered at his school’s football and basketball camps and for the Special Olympics. Participated in the international Conrad Foundation Spirit of Innovation Challenge and with his partner was selected as a semifinalist. Will study materials science and engineering at the University of Michigan.
Essay Quote: “I discovered personal meaning behind the old adage, “Winning isn’t everything.” … In all that I do, I must respect what I am doing, respect everyone around me and remember that success is not all about winning.”
Travis McCormick, Mason County Eastern
Expects to graduate with 11 varsity letters earned over four sports: four for baseball, one for basketball, three for soccer and two for cross country. Earned all-conference recognition his first three seasons of baseball and in soccer as a junior; also earned second-team all-area honors in basketball last season. Served four years on his school’s student council including as secretary, three years on his school’s Youth Advisory Council including as treasurer and three years with his school’s chapter of National Honor Society including as vice president. Received a Good Citizen Award from the local chapter of the Daughters of the American Revolution. Participated in church mission trips to Georgia and New York and volunteers at his vacation Bible school. Remains undecided on where he will attend college, but intends to study business.
Essay Quote: “Sportsmanship is treating the players, coaches, refs and fans around you with respect. Being gracious when you win or lose. The game isn’t about going there to physically and mentally destroy a player; it’s to have fun and enjoy the moment. You want to be that person or that team that people remember as good sportsmen.”
Other Class D girls finalists for the Scholar-Athlete Award were: Danielle Piggott, Fowler; Taylor Richards, Fruitport Calvary Christian; Anissa Keeler, Marion; Kelsey Rambo, Pickford; Hunter Branstrom, Rock Mid Peninsula; and Jane Hursey, Suttons Bay.
Other Class D boys finalists for the Scholar-Athlete Award were: Thomas Gallagher, Peck; Chantz Owens, Burr Oak; James Thibodeau, Clarkston Everest Collegiate; Gideon Rea Mulka, Hillman; Aaron Van Horn, Kingston; Connor Patrick Cappaert, Stephenson.
Students applying for the Scholar-Athlete Award must be carrying at least a 3.5 (on a 4.0 scale) grade-point average and have previously won a letter in a varsity sport in which the Michigan High School Athletic Association sponsors a postseason tournament. Other requirements for the applicants were to show active participation in other school and community activities and produce an essay on the importance of sportsmanship in educational athletics.
The Class B scholarship award recipients will be announced on Feb. 10, and the Class A honorees will be announced on Feb. 17.
Farm Bureau Insurance, one of Michigan's major insurers, has a statewide force of 450 agents serving nearly 500,000 Michigan policyholders. Besides providing life, home, auto, farm, business and retirement insurance, the company also sponsors life-saving, real-time Doppler weather tracking systems in several Michigan communities.
The MHSAA is a private, not-for-profit corporation of voluntary membership by more than 1,400 public and private senior high schools and junior high/middle schools which exists to develop common rules for athletic eligibility and competition. No government funds or tax dollars support the MHSAA, which was the first such association nationally to not accept membership dues or tournament entry fees from schools. Member schools which enforce these rules are permitted to participate in MHSAA tournaments, which attract more than 1.4 million spectators each year.