

2014 Week 5 Football Playoff Listing
September 23, 2014
By Geoff Kimmerly
Second Half editor
Here is a list of Michigan High School Athletic Association football playing schools, displaying their win-loss records and playoff averages through the fourth week of the season.
Schools on this list are in enrollment order for 11-player teams, with 8-player teams ordered by playoff average. An asterisk (*) beside a record indicates a team has eight or fewer games scheduled. A caret (^) beside a school’s name indicates a team is one win away from playoff qualification.
Those schools with 11-player teams with six or more wins playing nine-game schedules, or five or more wins playing eight games or fewer, will qualify for the MHSAA Football Playoffs beginning Oct. 31. Schools with 5-4, 4-3 or 4-4 records may qualify if the number of potential qualifiers by win total does not reach the 256 mark. Schools with six or more wins playing nine-game schedules or five or more wins playing eight games or fewer may be subtracted from the field based on playoff average if the number of potential qualifiers exceeds the 256 mark.
Once the 256 qualifying schools are determined, they will be divided by enrollment groups into eight equal divisions of 32 schools, and then drawn into regions of eight teams each and districts of four teams each.
Those schools with 8-player teams will be ranked by playoff average at season’s end, and the top 16 programs will be drawn into regions of eight teams each for the playoff in that division, which also begins Oct. 31.
To review a list of all football playoff schools, individual school playoff point details and to report errors, visit the Football page of the MHSAA Website.
The announcement of the qualifiers and first-round pairings for both the 11 and 8-player playoffs will take place on Oct. 26 on the Selection Sunday Show on FOX Sports Detroit. The playoff qualifiers and pairings will be posted to the MHSAA Website following the Selection Sunday Show.
11-Player Playoff Listing
1. Macomb Dakota, 2814, 3-1, 72.750
2. Sterling Heights Stevenson, 2767, 3-1, 66.250
3. Clarkston, 2742, 4-0, 98.000
4. Grand Blanc, 2668, 3-1, 66.500
5. East Kentwood, 2592, 4-0, 90.000
6. Rockford, 2555, 4-0, 98.000
7. Dearborn Fordson, 2411, 4-0, 88.000
8. Northville, 2298, 3-1, 64.750
9. Holland West Ottawa, 2293, 3-1, 74.500
10. Canton, 2289, 3-1, 66.500
11. Detroit Cass Tech, 2277, 4-0, 86.000
12. Plymouth, 2116, 3-1, 62.750
13. Lapeer, 2112, 4-0, 82.000
14. Hartland, 2007, 3-1, 72.000
15. Monroe, 1992, 3-1, 66.750
16. Grand Haven, 1960, 3-1, 70.500
17. West Bloomfield, 1929, 3-1, 66.750
18. Westland John Glenn, 1872, 3-1, 62.750
19. Warren Mott, 1870, 3-1, 70.500
20. Oxford, 1864, 4-0, 94.000
21. Livonia Stevenson, 1848, 3-1, 58.250
22. Saline, 1844, 3-1, 68.500
23. Walled Lake Central, 1815, 3-1, 68.500
24. Hudsonville, 1759, 3-1, 64.750
25. Waterford Mott, 1738, 3-1, 66.750
26. Livonia Churchill, 1696, 4-0, 98.000
27. Flint Carman-Ainsworth, 1568, 3-1, 64.500
28. Warren DeLaSalle, 1562, 3-1, 52.750
29. Detroit Western International, 1521, 3-1, 54.500
30. Detroit Martin Luther King, 1507, 4-0, 88.000
31. Walled Lake Western, 1502, 4-0, 88.000
32. Traverse City Central, 1490, 3-1, 66.250
33. Oak Park, 1486, 3-1, 66.750
34. Brownstown Woodhaven, 1484, 4-0, 92.000
35. Southgate Anderson, 1374, 3-1, 60.750
36. Dearborn Edsel Ford, 1356, 3-1, 66.250
37. Wyandotte Roosevelt, 1351, 3-1, 72.500
38. Detroit East English, 1345, 3-1, 66.750
39. Portage Northern, 1345, 3-1, 71.833
40. Port Huron, 1336, 3-1, 72.750
41. Ypsilanti Community, 1300, 3-1, 66.250
42. Birmingham Brother Rice, 1298, 4-0, 96.000
43. Garden City, 1290, 3-1, 50.750
44. Muskegon Mona Shores, 1274, 3-1, 74.750
45. Birmingham Groves, 1270, 4-0, 84.000
46. Berkley, 1265, 4-0, 80.000
47. Flushing, 1260, 3-1, 70.250
48. Midland Dow, 1255, 4-0, 90.000
49. South Lyon, 1254, 4-0, 94.000
50. Southfield, 1239, 3-1, 68.750
51. Farmington Hills Harrison, 1212, 3-1, 68.500
52. Fenton, 1181, 4-0, 92.000
53. Farmington, 1178, 3-1, 66.500
54. Grand Rapids Northview, 1177, 3-1, 62.500
55. Warren Woods Tower, 1175, 4-0, 86.000
56. Muskegon, 1157, 4-0, 98.000
57. Lowell, 1145, 4-0, 78.000
58. Greenville, 1130, 3-1, 52.250
59. Gibraltar Carlson, 1129, 3-1, 62.500
60. Grand Rapids Forest Hills Northern, 1113, 4-0, 86.000
61. Holland, 1109, 3-1, 60.250
62. Marquette, 1090, 3-1, 58.100
63. St. Johns, 1088, 4-0, 88.000
64. Byron Center, 1085, 3-1, 62.750
65. Allen Park, 1069, 3-1, 68.750
66. Auburn Hills Avondale, 1056, 3-1, 58.500
67. Orchard Lake St. Mary's, 1054, 4-0, 88.000
68. Mt. Pleasant, 1050, 3-1, 70.750
69. St. Joseph, 1028, 3-1, 70.750
70. Petoskey, 965, 3-1, 60.750
71. Romulus, 950, 3-1, 50.500
72. Riverview, 935, 4-0, 84.000
73. DeWitt, 930, 4-0, 92.000
74. Gaylord, 927, 4-0, 74.000
75. Linden, 921, 3-1, 60.750
76. Detroit Mumford, 919, 3-1, 56.250
77. Cedar Springs, 910, 3-1, 52.250
78. Grand Rapids Christian, 895, 3-1, 62.750
79. Stevensville Lakeshore, 887, 4-0, 97.333
80. Niles, 885, 3-1, 60.500
81. Carleton Airport, 879, 3-1, 52.750
82. Coldwater, 876, 4-0, 72.000
83. New Boston Huron, 867, 3-1, 58.750
84. Warren Fitzgerald, 857, 3-1, 60.750
85. Zeeland West, 850, 4-0, 74.000
86. Dearborn Divine Child, 848, 3-1, 57.583
87. St. Clair, 844, 3-1, 60.750
88. Edwardsburg, 839, 3-1, 58.750
89. Chelsea, 838, 3-1, 70.500
90. Plainwell, 812, 3-1, 56.500
91. Detroit Denby, 800, 3-1, 68.500
92. Vicksburg, 794, 4-0, 80.000
93. Bloomfield Hills Cranbrook-Kingswood, 790, 3-1, 50.500
94. Cadillac, 747, 4-0, 88.000
95. Goodrich, 737, 3-1, 64.750
96. Dearborn Heights Robichaud, 717, 4-0, 64.667
97. Yale, 716, 3-1, 50.750
98. Muskegon Orchard View, 662, 3-1, 52.250
99. Williamston, 659, 4-0, 80.000
100. Paw Paw, 657, 3-1, 56.750
101. Lansing Sexton, 652, 4-0, 98.000
102. Whitehall, 644, 4-0, 72.000
103. Kalamazoo Hackett, 635, 4-0, 64.000
104. Richmond, 630, 4-0, 80.000
105. Wyoming Kelloggsville, 610, 3-1, 50.750
106. Wyoming Godwin Heights, 609, 4-0, 58.000
107. Saginaw Swan Valley, 602, 4-0, 64.000
108. Birch Run, 575, 4-0, 72.000
109. Remus Chippewa Hills, 567, 4-0, 80.000
110. Marine City, 553, 4-0, 74.000
111. Flint Powers Catholic, 553, 3-1, 66.500
112. Freeland, 549, 4-0, 80.000
113. Ann Arbor Gabriel Richard, 545, 3-1, 46.750
114. Stanton Central Montcalm, 539, 3-1, 54.250
115. Portland, 538, 3-1, 62.750
116. Menominee, 532, 4-0, 81.467
117. Detroit University Prep, 530, 3-1, 52.750
118. River Rouge, 530, 3-1, 62.000
119. Frankenmuth, 528, 3-1, 54.750
120. Gladwin, 528, 3-1, 48.750
121. Ida, 527, 4-0, 66.000
122. Hopkins, 522, 3-1, 52.250
123. Lansing Catholic, 515, 4-0, 78.000
124. Almont, 512, 4-0, 64.000
125. Newaygo, 506, 3-1, 52.750
126. Olivet, 505, 3-1, 48.000
127. Muskegon Oakridge, 501, 3-1, 46.750
128. Onsted, 499, 3-1, 40.750
129. Chesaning, 480, 3-1, 52.750
130. Manistee, 479, 3-1, 50.500
131. Gladstone, 473, 3-1, 40.750
132. Stockbridge, 462, 3-1, 52.500
133. Reed City, 461, 3-1, 46.500
134. Harrison, 444, 4-0, 62.000
135. Kingsley, 439, 3-1, 48.750
136. Grand Rapids West Catholic, 438, 4-0, 82.000
137. Lakeview, 426, 3-1, 42.000
138. Beaverton, 422, 3-1, 42.250
139. Jonesville, 419, 3-1, 46.500
140. Jackson Lumen Christi, 417, 4-0, 72.000
141. Monroe St. Mary Catholic Central, 417, 4-0, 78.000
142. Millington, 414, 4-0, 74.000
143. Warren Michigan Collegiate, 414, 4-0, 66.000
144. Ithaca, 405, 4-0, 66.000
145. Sanford Meridian Early College, 404, 3-1, 44.250
146. Hillsdale, 401, 3-1, 50.750
147. Hanover-Horton, 399, 4-0, 48.000
148. Boyne City, 395, 4-0, 64.000
149. Grass Lake, 395, 4-0, 48.378
150. Madison Heights Madison, 393, 4-0, 86.000
151. Montrose, 392, 4-0, 66.000
152. Tawas, 385, 3-1, 52.500
153. Niles Brandywine, 383, 3-1, 47.833
154. Manchester, 379, 3-1, 46.750
155. Watervliet, 378, 3-1, 40.500
156. Quincy, 375, 3-1, 32.500
157. Vassar, 375, 3-1, 44.750
158. St. Charles, 373, 3-1, 54.500
159. Constantine, 371, 4-0, 70.000
160. Clinton, 367, 4-0, 62.000
161. Vandercook Lake, 366, 3-1, 36.500
162. Laingsburg, 361, 3-1, 42.750
163. Flint Beecher, 350, 4-0, 72.000
164. Grand Rapids NorthPointe Christian, 347, 3-1, 46.500
165. Ravenna, 342, 4-0, 58.000
166. Carson City-Crystal, 330, 3-1, 42.500
167. Ishpeming Westwood, 318, 3-1, 38.750
168. Marlette, 316, 3-1, 44.250
169. Homer, 312, 4-0, 50.000
170. Elkton-Pigeon-Bay Port Laker, 308, 4-0, 60.000
171. Ishpeming *^, 307, 4-0, 64.000
172. Traverse City St. Francis, 305, 3-1, 48.750
173. Burton Atherton, 304, 3-1, 44.750
174. Pewamo-Westphalia, 302, 3-1, 42.750
175. Dansville, 301, 3-1, 48.500
176. Gobles, 301, 3-1, 48.750
177. Flint Hamady, 295, 4-0, 50.000
178. Union City, 294, 4-0, 48.000
179. Rochester Hills Lutheran Northwest, 289, 3-1, 42.500
180. Whittemore-Prescott, 283, 4-0, 64.000
181. Mancelona, 282, 3-1, 30.750
182. Detroit Loyola, 278, 4-0, 80.000
183. Manton, 276, 3-1, 38.250
184. Royal Oak Shrine Catholic, 273, 4-0, 58.000
185. Hudson, 271, 3-1, 40.750
186. Grosse Pointe Woods University Liggett, 270, 3-1, 46.750
187. Decatur, 262, 4-0, 66.000
188. Lincoln Alcona, 260, 3-1, 38.500
189. Iron River West Iron County, 259, 4-0, 60.000
190. New Lothrop, 259, 4-0, 66.000
191. Blanchard Montabella, 256, 3-1, 40.000
192. Norway, 244, 3-1, 37.933
193. Saginaw Michigan Lutheran Seminary, 243, 3-1, 46.750
194. Suttons Bay, 243, 3-1, 43.667
195. Indian River Inland Lakes, 242, 3-1, 30.750
196. Ottawa Lake Whiteford, 238, 3-1, 42.750
197. Johannesburg-Lewiston, 237, 4-0, 52.000
198. Harbor Beach, 232, 4-0, 64.000
199. Bessemer *, 231, 3-1, 34.500
200. Beal City, 222, 4-0, 60.000
201. Lutheran Westland, 221, 3-1, 42.500
202. Coleman, 217, 3-1, 44.250
203. Mendon, 214, 3-1, 50.500
204. St. Ignace, 211, 4-0, 48.000
205. Pittsford, 205, 3-1, 30.750
206. Bark River-Harris, 194, 3-1, 30.333
207. Munising, 194, 3-1, 35.417
208. Fowler, 189, 4-0, 58.000
209. Morenci, 184, 4-0, 62.000
210. Muskegon Catholic Central, 183, 4-0, 72.000
211. Climax-Scotts, 169, 4-0, 44.000
212. Waterford Our Lady, 169, 3-1, 56.750
213. Lake Linden-Hubbell, 163, 3-1, 42.600
214. Hillman, 139, 4-0, 50.000
215. Baldwin, 137, 3-1, 36.500
216. Bay City All Saints, 133, 3-1, 40.500
217. Felch North Dickinson *, 113, 3-1, 30.500
218. Clarkston Everest Collegiate *, 105, 3-0, 59.333
8-Player Playoff Listing
1. Deckerville, 183, 4-0, 42.000
2. Cedarville, 158, 4-0, 42.000
3. Peck, 158, 4-0, 42.000
4. Portland St. Patrick, 96, 4-0, 42.000
5. Rapid River, 108, 4-0, 40.667
6. Battle Creek St. Philip, 157, 4-0, 40.000
7. Owendale-Gagetown, 49, 4-0, 40.000
8. Bellaire, 151, 4-0, 38.667
9. Lawrence, 191, 4-0, 32.000
10. Waldron, 89, 3-1, 28.750
11. New Haven Merritt Academy, 145, 3-1, 26.750
12. Webberville, 189, 3-1, 24.500
13. Posen, 90, 2-2, 21.500
14. Eben Junction Superior Central, 126, 2-2, 19.000
15. Kingston, 191, 2-2, 17.500
16. Engadine, 85, 2-2, 17.500
17. Burr Oak, 69, 2-2, 17.250
18. Morrice, 196, 2-2, 16.750
19. Ontonagon *, 138, 1-2, 12.167
20. Kinde-North Huron, 172, 1-3, 12.000
21. Caseville, 81, 1-3, 11.250
22. Brimley, 144, 1-3, 9.750
23. Akron-Fairgrove, 99, 1-3, 9.250
24. Big Rapids Crossroads Academy, 188, 0-4, 3.000
25. St. Joseph Michigan Lutheran *, 101, 0-4, 2.500
26. Tekonsha, 146, 0-4, 2.250
27. Carsonville-Port Sanilac, 147, 0-4, 2.000
28. Ewen-Trout Creek, 135, 0-4, 2.000
29. Litchfield, 106, 0-4, 2.000
30. Flint Michigan School For The Deaf, 56, 0-4, 2.000
31. Charlton Heston Academy, 54, 0-4, 0.750
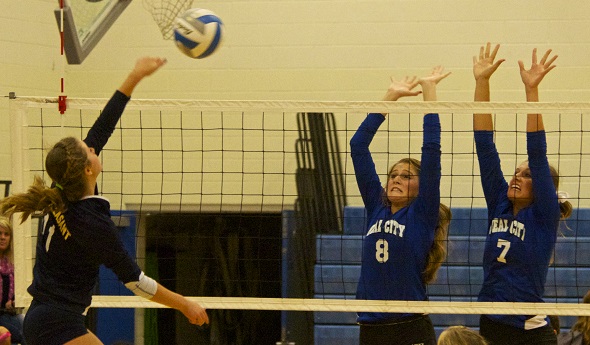
Watch Volleyball, Football LIVE
November 4, 2014
By Geoff Kimmerly
Second Half editor
District and Regional Volleyball action will be featured over the next two weeks on MHSAA.tv, while Football Playoff coverage moves into its second round and will be available live via multiple online channels this weekend.
Coverage of Girls Volleyball includes District Quarterfinal/Semifinal Matches each evening for four straight. Football this weekend can be viewed Friday from Fox Sports Detroit and Saturday from MHSAA.tv.
Volleyball
Here’s the complete District schedule, with links to each game's page on the MHSAA.tv site (all coverage available with subscription):
Monday – Class C Quarterfinals at Hanover-Horton
East Jackson vs. Michigan Center, 5:30 p.m.
Napoleon vs. Vandercook Lake, 7 p.m.
Tuesday – Class C Semifinals at Calumet
Ironwood vs. L’Anse, 6 p.m.
Calumet vs. Hancock, 7:30 p.m.
Wednesday – Class B Semifinals at Frankenmuth
Frankenmuth vs. North Branch, 6 p.m.
Caro vs. Mt. Morris, 7:30 p.m.
Thursday – Class A Semifinals at Hudsonville
Jenison vs. Grandville/Holland West Ottawa winner, 5 p.m.
Hudsonville/Holland winner vs. Wyoming/Zeeland East winner, 7 p.m.
Regional Semifinal coverage takes place next Tuesday (Nov. 11) at two locations:
Class A at Mason
Okemos District winner vs. Dexter District winner, 5 p.m.
Holt District winner vs. Portage Central District winner, 7 p.m.
Class C at Morley-Stanwood
Shelby District winner vs. White Cloud District winner, 6 p.m.
Muskegon Western Michigan Christian District winner vs. Pewamo-Westphalia District winner, 8 p.m.
Football
It’s the fourth season for the popular PrepZone on FoxSportsDetroit.com, which will provide free live coverage of four Football Playoff games each week for the first four weekends of the tournament. Games to be covered this week are:
Division 1 – Lapeer at Clarkston
Division 4 – Saginaw Swan Valley at Lansing Sexton
Division 5 – Clare at Freeland
Division 5 – Almont at Marine City
All games will take place Friday at 7 p.m., with short-term archives available on FoxSportsDetroit.com and long-term archives and DVDs available through MHSAA.tv.
Football Friday Overtime is in its fourth season on FOX Sports Detroit, airing at Midnight each Friday and running for 13 weeks. Mickey York and Rob Rubick host this 30-minute highlights show. The show re-airs Saturdays at 11 a.m. and Sunday mornings – check your local listings (this week at 7 a.m.).
The following games are scheduled to be highlighted this week:
- Wyandotte Roosevelt at Brownstown Woodhaven
- Trenton at New Boston Huron
- Southfield at Oak Park
- Walled Lake Central at West Bloomfield
- Detroit East English at Warren DeLaSalle
- Detroit Cass Tech at Dearborn Fordson
- Plus coverage from the Prep Zone games
MHSAA.tv also will cover two Football Playoff games live each Saturday the first three weeks of the tournament, and 12 Semifinal games on Nov. 22. Here’s this week’s District Final schedule (all coverage with subscription):
Division 1 – Grand Ledge at East Kentwood, 1 p.m.
Division 7 – Pewamo-Westphalia at Hudson, 1 p.m.
A Day Pass subscription to MHSAA.tv is $9.95. A Month Pass subscription is $14.95, enabling purchasers to watch all of this week’s action plus two more weeks of coverage of the Girls Volleyball Tournament, weekly Football Playoff coverage, and the Preliminaries and Finals of the Lower Peninsula Girls Swimming & Diving Finals. All events become available for free on demand viewing three days after the date of the contest.
MHSAA Highlights: This week's package includes clips from the Okemos/East Lansing volleyball match and the Plainwell/Battle Creek Harper Creek and Watervliet/Niles Brandywine football games.