

2014 Week 5 Football Playoff Listing
September 23, 2014
By Geoff Kimmerly
Second Half editor
Here is a list of Michigan High School Athletic Association football playing schools, displaying their win-loss records and playoff averages through the fourth week of the season.
Schools on this list are in enrollment order for 11-player teams, with 8-player teams ordered by playoff average. An asterisk (*) beside a record indicates a team has eight or fewer games scheduled. A caret (^) beside a school’s name indicates a team is one win away from playoff qualification.
Those schools with 11-player teams with six or more wins playing nine-game schedules, or five or more wins playing eight games or fewer, will qualify for the MHSAA Football Playoffs beginning Oct. 31. Schools with 5-4, 4-3 or 4-4 records may qualify if the number of potential qualifiers by win total does not reach the 256 mark. Schools with six or more wins playing nine-game schedules or five or more wins playing eight games or fewer may be subtracted from the field based on playoff average if the number of potential qualifiers exceeds the 256 mark.
Once the 256 qualifying schools are determined, they will be divided by enrollment groups into eight equal divisions of 32 schools, and then drawn into regions of eight teams each and districts of four teams each.
Those schools with 8-player teams will be ranked by playoff average at season’s end, and the top 16 programs will be drawn into regions of eight teams each for the playoff in that division, which also begins Oct. 31.
To review a list of all football playoff schools, individual school playoff point details and to report errors, visit the Football page of the MHSAA Website.
The announcement of the qualifiers and first-round pairings for both the 11 and 8-player playoffs will take place on Oct. 26 on the Selection Sunday Show on FOX Sports Detroit. The playoff qualifiers and pairings will be posted to the MHSAA Website following the Selection Sunday Show.
11-Player Playoff Listing
1. Macomb Dakota, 2814, 3-1, 72.750
2. Sterling Heights Stevenson, 2767, 3-1, 66.250
3. Clarkston, 2742, 4-0, 98.000
4. Grand Blanc, 2668, 3-1, 66.500
5. East Kentwood, 2592, 4-0, 90.000
6. Rockford, 2555, 4-0, 98.000
7. Dearborn Fordson, 2411, 4-0, 88.000
8. Northville, 2298, 3-1, 64.750
9. Holland West Ottawa, 2293, 3-1, 74.500
10. Canton, 2289, 3-1, 66.500
11. Detroit Cass Tech, 2277, 4-0, 86.000
12. Plymouth, 2116, 3-1, 62.750
13. Lapeer, 2112, 4-0, 82.000
14. Hartland, 2007, 3-1, 72.000
15. Monroe, 1992, 3-1, 66.750
16. Grand Haven, 1960, 3-1, 70.500
17. West Bloomfield, 1929, 3-1, 66.750
18. Westland John Glenn, 1872, 3-1, 62.750
19. Warren Mott, 1870, 3-1, 70.500
20. Oxford, 1864, 4-0, 94.000
21. Livonia Stevenson, 1848, 3-1, 58.250
22. Saline, 1844, 3-1, 68.500
23. Walled Lake Central, 1815, 3-1, 68.500
24. Hudsonville, 1759, 3-1, 64.750
25. Waterford Mott, 1738, 3-1, 66.750
26. Livonia Churchill, 1696, 4-0, 98.000
27. Flint Carman-Ainsworth, 1568, 3-1, 64.500
28. Warren DeLaSalle, 1562, 3-1, 52.750
29. Detroit Western International, 1521, 3-1, 54.500
30. Detroit Martin Luther King, 1507, 4-0, 88.000
31. Walled Lake Western, 1502, 4-0, 88.000
32. Traverse City Central, 1490, 3-1, 66.250
33. Oak Park, 1486, 3-1, 66.750
34. Brownstown Woodhaven, 1484, 4-0, 92.000
35. Southgate Anderson, 1374, 3-1, 60.750
36. Dearborn Edsel Ford, 1356, 3-1, 66.250
37. Wyandotte Roosevelt, 1351, 3-1, 72.500
38. Detroit East English, 1345, 3-1, 66.750
39. Portage Northern, 1345, 3-1, 71.833
40. Port Huron, 1336, 3-1, 72.750
41. Ypsilanti Community, 1300, 3-1, 66.250
42. Birmingham Brother Rice, 1298, 4-0, 96.000
43. Garden City, 1290, 3-1, 50.750
44. Muskegon Mona Shores, 1274, 3-1, 74.750
45. Birmingham Groves, 1270, 4-0, 84.000
46. Berkley, 1265, 4-0, 80.000
47. Flushing, 1260, 3-1, 70.250
48. Midland Dow, 1255, 4-0, 90.000
49. South Lyon, 1254, 4-0, 94.000
50. Southfield, 1239, 3-1, 68.750
51. Farmington Hills Harrison, 1212, 3-1, 68.500
52. Fenton, 1181, 4-0, 92.000
53. Farmington, 1178, 3-1, 66.500
54. Grand Rapids Northview, 1177, 3-1, 62.500
55. Warren Woods Tower, 1175, 4-0, 86.000
56. Muskegon, 1157, 4-0, 98.000
57. Lowell, 1145, 4-0, 78.000
58. Greenville, 1130, 3-1, 52.250
59. Gibraltar Carlson, 1129, 3-1, 62.500
60. Grand Rapids Forest Hills Northern, 1113, 4-0, 86.000
61. Holland, 1109, 3-1, 60.250
62. Marquette, 1090, 3-1, 58.100
63. St. Johns, 1088, 4-0, 88.000
64. Byron Center, 1085, 3-1, 62.750
65. Allen Park, 1069, 3-1, 68.750
66. Auburn Hills Avondale, 1056, 3-1, 58.500
67. Orchard Lake St. Mary's, 1054, 4-0, 88.000
68. Mt. Pleasant, 1050, 3-1, 70.750
69. St. Joseph, 1028, 3-1, 70.750
70. Petoskey, 965, 3-1, 60.750
71. Romulus, 950, 3-1, 50.500
72. Riverview, 935, 4-0, 84.000
73. DeWitt, 930, 4-0, 92.000
74. Gaylord, 927, 4-0, 74.000
75. Linden, 921, 3-1, 60.750
76. Detroit Mumford, 919, 3-1, 56.250
77. Cedar Springs, 910, 3-1, 52.250
78. Grand Rapids Christian, 895, 3-1, 62.750
79. Stevensville Lakeshore, 887, 4-0, 97.333
80. Niles, 885, 3-1, 60.500
81. Carleton Airport, 879, 3-1, 52.750
82. Coldwater, 876, 4-0, 72.000
83. New Boston Huron, 867, 3-1, 58.750
84. Warren Fitzgerald, 857, 3-1, 60.750
85. Zeeland West, 850, 4-0, 74.000
86. Dearborn Divine Child, 848, 3-1, 57.583
87. St. Clair, 844, 3-1, 60.750
88. Edwardsburg, 839, 3-1, 58.750
89. Chelsea, 838, 3-1, 70.500
90. Plainwell, 812, 3-1, 56.500
91. Detroit Denby, 800, 3-1, 68.500
92. Vicksburg, 794, 4-0, 80.000
93. Bloomfield Hills Cranbrook-Kingswood, 790, 3-1, 50.500
94. Cadillac, 747, 4-0, 88.000
95. Goodrich, 737, 3-1, 64.750
96. Dearborn Heights Robichaud, 717, 4-0, 64.667
97. Yale, 716, 3-1, 50.750
98. Muskegon Orchard View, 662, 3-1, 52.250
99. Williamston, 659, 4-0, 80.000
100. Paw Paw, 657, 3-1, 56.750
101. Lansing Sexton, 652, 4-0, 98.000
102. Whitehall, 644, 4-0, 72.000
103. Kalamazoo Hackett, 635, 4-0, 64.000
104. Richmond, 630, 4-0, 80.000
105. Wyoming Kelloggsville, 610, 3-1, 50.750
106. Wyoming Godwin Heights, 609, 4-0, 58.000
107. Saginaw Swan Valley, 602, 4-0, 64.000
108. Birch Run, 575, 4-0, 72.000
109. Remus Chippewa Hills, 567, 4-0, 80.000
110. Marine City, 553, 4-0, 74.000
111. Flint Powers Catholic, 553, 3-1, 66.500
112. Freeland, 549, 4-0, 80.000
113. Ann Arbor Gabriel Richard, 545, 3-1, 46.750
114. Stanton Central Montcalm, 539, 3-1, 54.250
115. Portland, 538, 3-1, 62.750
116. Menominee, 532, 4-0, 81.467
117. Detroit University Prep, 530, 3-1, 52.750
118. River Rouge, 530, 3-1, 62.000
119. Frankenmuth, 528, 3-1, 54.750
120. Gladwin, 528, 3-1, 48.750
121. Ida, 527, 4-0, 66.000
122. Hopkins, 522, 3-1, 52.250
123. Lansing Catholic, 515, 4-0, 78.000
124. Almont, 512, 4-0, 64.000
125. Newaygo, 506, 3-1, 52.750
126. Olivet, 505, 3-1, 48.000
127. Muskegon Oakridge, 501, 3-1, 46.750
128. Onsted, 499, 3-1, 40.750
129. Chesaning, 480, 3-1, 52.750
130. Manistee, 479, 3-1, 50.500
131. Gladstone, 473, 3-1, 40.750
132. Stockbridge, 462, 3-1, 52.500
133. Reed City, 461, 3-1, 46.500
134. Harrison, 444, 4-0, 62.000
135. Kingsley, 439, 3-1, 48.750
136. Grand Rapids West Catholic, 438, 4-0, 82.000
137. Lakeview, 426, 3-1, 42.000
138. Beaverton, 422, 3-1, 42.250
139. Jonesville, 419, 3-1, 46.500
140. Jackson Lumen Christi, 417, 4-0, 72.000
141. Monroe St. Mary Catholic Central, 417, 4-0, 78.000
142. Millington, 414, 4-0, 74.000
143. Warren Michigan Collegiate, 414, 4-0, 66.000
144. Ithaca, 405, 4-0, 66.000
145. Sanford Meridian Early College, 404, 3-1, 44.250
146. Hillsdale, 401, 3-1, 50.750
147. Hanover-Horton, 399, 4-0, 48.000
148. Boyne City, 395, 4-0, 64.000
149. Grass Lake, 395, 4-0, 48.378
150. Madison Heights Madison, 393, 4-0, 86.000
151. Montrose, 392, 4-0, 66.000
152. Tawas, 385, 3-1, 52.500
153. Niles Brandywine, 383, 3-1, 47.833
154. Manchester, 379, 3-1, 46.750
155. Watervliet, 378, 3-1, 40.500
156. Quincy, 375, 3-1, 32.500
157. Vassar, 375, 3-1, 44.750
158. St. Charles, 373, 3-1, 54.500
159. Constantine, 371, 4-0, 70.000
160. Clinton, 367, 4-0, 62.000
161. Vandercook Lake, 366, 3-1, 36.500
162. Laingsburg, 361, 3-1, 42.750
163. Flint Beecher, 350, 4-0, 72.000
164. Grand Rapids NorthPointe Christian, 347, 3-1, 46.500
165. Ravenna, 342, 4-0, 58.000
166. Carson City-Crystal, 330, 3-1, 42.500
167. Ishpeming Westwood, 318, 3-1, 38.750
168. Marlette, 316, 3-1, 44.250
169. Homer, 312, 4-0, 50.000
170. Elkton-Pigeon-Bay Port Laker, 308, 4-0, 60.000
171. Ishpeming *^, 307, 4-0, 64.000
172. Traverse City St. Francis, 305, 3-1, 48.750
173. Burton Atherton, 304, 3-1, 44.750
174. Pewamo-Westphalia, 302, 3-1, 42.750
175. Dansville, 301, 3-1, 48.500
176. Gobles, 301, 3-1, 48.750
177. Flint Hamady, 295, 4-0, 50.000
178. Union City, 294, 4-0, 48.000
179. Rochester Hills Lutheran Northwest, 289, 3-1, 42.500
180. Whittemore-Prescott, 283, 4-0, 64.000
181. Mancelona, 282, 3-1, 30.750
182. Detroit Loyola, 278, 4-0, 80.000
183. Manton, 276, 3-1, 38.250
184. Royal Oak Shrine Catholic, 273, 4-0, 58.000
185. Hudson, 271, 3-1, 40.750
186. Grosse Pointe Woods University Liggett, 270, 3-1, 46.750
187. Decatur, 262, 4-0, 66.000
188. Lincoln Alcona, 260, 3-1, 38.500
189. Iron River West Iron County, 259, 4-0, 60.000
190. New Lothrop, 259, 4-0, 66.000
191. Blanchard Montabella, 256, 3-1, 40.000
192. Norway, 244, 3-1, 37.933
193. Saginaw Michigan Lutheran Seminary, 243, 3-1, 46.750
194. Suttons Bay, 243, 3-1, 43.667
195. Indian River Inland Lakes, 242, 3-1, 30.750
196. Ottawa Lake Whiteford, 238, 3-1, 42.750
197. Johannesburg-Lewiston, 237, 4-0, 52.000
198. Harbor Beach, 232, 4-0, 64.000
199. Bessemer *, 231, 3-1, 34.500
200. Beal City, 222, 4-0, 60.000
201. Lutheran Westland, 221, 3-1, 42.500
202. Coleman, 217, 3-1, 44.250
203. Mendon, 214, 3-1, 50.500
204. St. Ignace, 211, 4-0, 48.000
205. Pittsford, 205, 3-1, 30.750
206. Bark River-Harris, 194, 3-1, 30.333
207. Munising, 194, 3-1, 35.417
208. Fowler, 189, 4-0, 58.000
209. Morenci, 184, 4-0, 62.000
210. Muskegon Catholic Central, 183, 4-0, 72.000
211. Climax-Scotts, 169, 4-0, 44.000
212. Waterford Our Lady, 169, 3-1, 56.750
213. Lake Linden-Hubbell, 163, 3-1, 42.600
214. Hillman, 139, 4-0, 50.000
215. Baldwin, 137, 3-1, 36.500
216. Bay City All Saints, 133, 3-1, 40.500
217. Felch North Dickinson *, 113, 3-1, 30.500
218. Clarkston Everest Collegiate *, 105, 3-0, 59.333
8-Player Playoff Listing
1. Deckerville, 183, 4-0, 42.000
2. Cedarville, 158, 4-0, 42.000
3. Peck, 158, 4-0, 42.000
4. Portland St. Patrick, 96, 4-0, 42.000
5. Rapid River, 108, 4-0, 40.667
6. Battle Creek St. Philip, 157, 4-0, 40.000
7. Owendale-Gagetown, 49, 4-0, 40.000
8. Bellaire, 151, 4-0, 38.667
9. Lawrence, 191, 4-0, 32.000
10. Waldron, 89, 3-1, 28.750
11. New Haven Merritt Academy, 145, 3-1, 26.750
12. Webberville, 189, 3-1, 24.500
13. Posen, 90, 2-2, 21.500
14. Eben Junction Superior Central, 126, 2-2, 19.000
15. Kingston, 191, 2-2, 17.500
16. Engadine, 85, 2-2, 17.500
17. Burr Oak, 69, 2-2, 17.250
18. Morrice, 196, 2-2, 16.750
19. Ontonagon *, 138, 1-2, 12.167
20. Kinde-North Huron, 172, 1-3, 12.000
21. Caseville, 81, 1-3, 11.250
22. Brimley, 144, 1-3, 9.750
23. Akron-Fairgrove, 99, 1-3, 9.250
24. Big Rapids Crossroads Academy, 188, 0-4, 3.000
25. St. Joseph Michigan Lutheran *, 101, 0-4, 2.500
26. Tekonsha, 146, 0-4, 2.250
27. Carsonville-Port Sanilac, 147, 0-4, 2.000
28. Ewen-Trout Creek, 135, 0-4, 2.000
29. Litchfield, 106, 0-4, 2.000
30. Flint Michigan School For The Deaf, 56, 0-4, 2.000
31. Charlton Heston Academy, 54, 0-4, 0.750
Drive for Detroit: District Semis in Review
November 5, 2013
By Geoff Kimmerly
Second Half editor
Upsets seemed to fall with the raindrops that unexpectedly cropped up in spurts during the first weekend of the 2013 MHSAA football playoffs.
From Romeo to Dowagiac, Britton-Deerfield to Wayland with Parchment and Bath in between, teams celebrated wins that probably weren't expected by most when the brackets were revealed during the Sunday Selection Show.
A telling stat: While teams with higher playoff points averages host during the first three rounds, nearly 23 percent (31 of 136) of road teams won last weekend.
Here’s a look at the results from each division that stuck out most from the 11-player District openers and 8-player Regional Semifinals:
Division 1
Detroit Catholic Central 35, Northville 14
Detroit Catholic Central (8-2) opened the playoffs against Northville (8-2) for the second time in three seasons and with hopes of again starting off smoothly on a third straight trip to the MHSAA Finals. This opener certainly was closer than the 2011 56-6 DCC win, but the result was the same as the Shamrocks ended an outstanding run by the Kensington Lakes Activities Association overall champion. Click to read more from the Detroit Free Press.
Also noted:
Macomb Dakota 19, Warren DeLaSalle 14: DeLaSalle (6-4) gave Dakota (10-0) its closest game this season and was the first to come within single digits of the Cougars since opening night.
Walled Lake Western 44, Canton 41: Western (9-1) advanced to the District Final for the third straight season but only after holding off a late comeback by Canton (8-2).
Romeo 24, Lake Orion 21: Likely considered an upset because of Lake Orion’s playoff history, there is some back story. In three playoff games during 2005-08, Lake Orion (7-3) beat Romeo all three times by a combined six points – but this time the Bulldogs (6-4) captured a close one.
Brighton 14, Grand Blanc 7: Grand Blanc (7-3) won the KLAA West thanks to a 44-21 win over Brighton in Week 4, but the Bulldogs remain alive after entering the postseason 5-4.
Division 2
Birmingham Seaholm 17, Southfield 16
Seaholm (9-1), the Oakland Activities Association Blue champion, scored twice during the final seven minutes to eliminate OAA White winner Southfield (7-3). The Maples will play in their first District Final since 2001, the last time the team also won nine or more games. Click to read more from The Oakland Press.
Also noted:
Wyandotte Roosevelt 45, Ypsilanti Lincoln 40: Downriver League champion Roosevelt (10-0) outlasted another league title winner, Southeastern Conference White winner Lincoln (7-3).
Midland Dow 30, Fenton 21: The Chargers (8-2) returned to the playoffs for the first time since 2010 and opened by beating Flint Metro League co-champ Fenton (8-2).
Pinckney 14, South Lyon 10: In its first playoff appearance since 2001, Pinckney (7-3) won its first playoff game ever and finished a season sweep of South Lyon (6-4), also its opening-night opponent.
Detroit U-D Jesuit 37, Warren Woods Tower 14: Jesuit’s first winning season since 2002 will continue; the Cubs (6-4) ended quickly the first playoff appearance for Warren Woods Tower (6-4) since 2007.
Division 3
Grand Rapids Christian 14, Grand Rapids Forest Hills Northern 13
The reigning Division 3 champion got a scare from Forest Hills Northern (7-3), which led 13-0 in the third quarter of its first playoff game since 2002. The Eagles (8-2) made an impressive comeback to move on to their fourth straight District Final. Click to read more from the Grand Rapids Press.
Also noted:
Zeeland West 44, Zeeland East 13: The Dux (9-1) received their lone loss from East (5-5) in Week 2, but this one wasn't as close as that six-point defeat.
Byron Center 28, Battle Creek Harper Creek 3: Harper Creek (7-3) made the Semifinals the last two seasons, but were stopped quickly this time by the Bulldogs (7-3).
Wayland 38, Plainwell 28: A year after finishing 0-9 (after three straight ending 1-8), Wayland is 6-4 and knocked out a solid contender in Plainwell (8-2).
Eaton Rapids 49, Charlotte 21: Although Eaton Rapids (6-4) beat Charlotte in Week 3, it was expected by at least a few that the Greyhounds’ first playoff appearance would be a short one since Charlotte (7-3) had won five straight.
Division 4
Dowagiac 21, Edwardsburg 17
Dowagiac has been exceptional over the last three seasons – the Chieftains (7-3) are playing to reach 10 wins for the third straight. But it was hard to see this one coming with Edwardsburg (9-1) undefeated and having beaten Dowagiac 36-0 only two weeks ago to decide the Wolverine B West championship. Click for to read more from the Kalamazoo Gazette.
Also noted:
Belding 21, Spring Lake 20: This spoke to the strength of the O-K Blue, as third-place Belding (7-3) beat Lakes 8 Conference champion Spring Lake (8-2).
Allendale 24, Grand Rapids Catholic Central 21 (OT): Also from the O-K Blue, league runner-up Allendale (8-1) survived a scare from frequent playoff power GRCC (6-4).
Battle Creek Pennfield 21, Paw Paw 17: The Kalamazoo Valley Association was pretty strong too, with Pennfield (9-1) one of three co-champs and the winner in this one over Wolverine B East champ Paw Paw (8-2).
Saginaw Swan Valley 14, Yale 13: Swan Valley’s hope of returning to the Semifinals – and going to Ford Field – nearly ended until the Vikings (10-0) scored the go-ahead points with two minutes to play to escape Yale (6-4).
Division 5
Parchment 40, Jackson Lumen Christi 35
In a weekend full of upsets, this was the one that rang the statewide bell loudest. Parchment has had a nice run in a tough KVA and is 7-3 overall after finishing 3-6 only a year ago. But Lumen Christi had the highest playoff point average in Division 5 by a substantial chunk and was considered a definite contender as it pursued its first MHSAA championship since 1999. Click to read more from the Kalamazoo Gazette.
Also noted:
Reed City 49, Clare 7: The Central State Activities Association champion Coyotes (10-0) continued their dominating play in eliminating Jack Pine Conference champ Clare (7-3).
Millington 28, Almont 21: The Cardinals’ two regular season losses were their most since 2006, but Millington (8-2) is looking strong again after opening with a win over Blue Water Area Conference runner-up Almont (8-2).
Grand Rapids West Catholic 27, Portland 14: This rematch of last season’s Division 5 Final ended the opposite way, with West Catholic (6-4) continuing a five-game winning streak while Portland (7-2) closed with two straight defeats.
Detroit University Prep 42, Clinton Township Clintondale 34: University Prep (8-2) equaled its 2012 record in only its eighth season as a program and handed a first loss to Macomb Area Conference Bronze champion Clintondale (9-1) in one of its best wins during that brief history.
Division 6
Grandville Calvin Christian 14, Grand Rapids NorthPointe Christian 12
These two and Hopkins played to a three-way tie for the O-K White championship during the regular season, which resulted in part because of NorthPointe’s 13-8 win over Calvin Christian (7-3) in Week 3. This time the Squires came out on top in a matchup of teams both looking for their first playoff wins. NorthPointe finished 8-2. Click to read more from the Grand Rapids Press.
Also noted:
Montrose 42, Reese 13: The Rams (10-0) won their 10th game for the third straight season and made it two this fall over solid Reese (8-2).
Shelby 35, Montague 23: Montague (6-4) played West Michigan Conference champion Shelby (9-1) closer than in Week 4, but the Tigers (9-1) bounced back from its lone loss, in Week 9, against Division 4 Spring Lake.
Schoolcraft 28, Niles Brandywine 21: Co-KVA champ Schoolcraft (9-1) hasn't lost in two months, although Brandywine (8-2) gave the Eagles one of their closest games in a while.
Constantine 41, Michigan Center 26: This win over Michigan Center (8-2) gave Constantine (6-4) at least one postseason victory in each of the last 12 seasons.
Division 7
Britton-Deerfield 42, Hudson 28
Britton-Deerfield has made the playoffs all three seasons since its creation from the merging of the Britton-Macon and Deerfield districts. In fact, the Patriots reached the Regional Final in just their second season last fall. But Lenawee County Activities Association co-champion Hudson has reached the MHSAA Semifinals three of the last five seasons and had to be considered a possibility to get back again this month. Click to read more from the Adrian Daily Telegram.
Also noted:
Iron River West Iron County 21, Traverse City St. Francis 7: Given St. Francis’ history of postseason success, this seemed ripe for an upset – but West Iron (10-0) broke away from the Gladiators (5-5) in the second half.
Pewamo-Westphalia 57, Saugatuck 21: The Central Michigan Athletic Conference champion Pirates (9-1) bounced back from their lone loss the week before to finish the season for Southwestern Athletic Conference North winner Saugatuck (8-2).
Bath 27, Elkton-Pigeon-Bay Port 14: This is not only Bath’s first playoff run since 2000, but first winning season since that fall – and the Bees (6-4) continued with a stunner against Greater Thumb Conference West runner-up Laker (7-3).
Madison Heights Bishop Foley 42, Royal Oak Shrine 10: A Week 3 loss to Shrine (6-4) got Bishop Foley off to a rough start in the Catholic League Intersectional, but the Ventures (7-3) scored their second-most points of the season in this rematch.
Division 8
Detroit Allen 54, Adrian Lenawee Christian 32
Detroit Allen (7-2) built on its first playoff berth with its first playoff win, ending a similarly historic season for Lenawee Christian – the Cougars set a team record for wins in finishing 7-3. Both programs have been in existence for only six seasons, and this fall Allen finished second to much larger River Rouge in the Michigan Metro Athletic Conference. Click to read more from the Adrian Daily Telegram.
Also noted:
Waterford Our Lady, 34, Clarkston Everest Collegiate 7: These two previously were one as a co-op team before splitting this season; Our Lady (8-2) will move on while Everest (7-3) finished an impressive first season on its own.
Powers North Central 35, Munising 21: Although Munising (6-4) made the playoffs for the second time in three seasons, neither of these teams has much recent postseason history – but Powers (8-2) made its own with this first playoff win.
Crystal Falls Forest Park 30, Bessemer 16: The Trojans (10-0) beat the Miners (6-4) for the second time in three weeks and have 10 wins again for the first time since 2010.
L’Anse 52, Lake Linden-Hubbell 34: The Purple Hornets (8-2) bounced back from a Week 9 loss with their most points of the season to outlast one of the best offensive performances as well by Lake Linden-Hubbell (5-5).
8-Player
Engadine 28, Cedarville 26
Perhaps a little under the radar, Engadine has been arguably the hottest team in 8-player football with five straight wins after beginning this season 1-4. The Eagles’ third loss this fall was 42-16 to Cedarville (8-2) – but in six weeks, Engadine (6-4) found a way to reverse the tide just enough. Click for more from WWTV 9&10.
Also noted:
Peck 32, Deckerville 14: The 8-player champion could come from the Thumb area for the third straight season; in 2012 it was Deckerville (5-5), and Peck (10-0) is looking like a favorite this time.
Carsonville-Port Sanilac 54, Portland St. Patrick 18: The Tigers (7-3) made it two straight wins and two straight over the Shamrocks (7-3) after also beating St. Patrick 45-12 in Week 9.
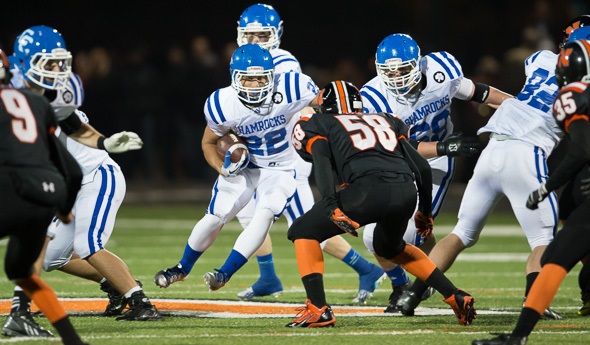
PHOTO: Detroit Catholic Central running back Connor Holton (22) prepares to sprint through a hole in the line while Northville linebacker Jack Ernst works to stop him. (See more at Terry McNamara Photography.)