

2014 Week 6 Football Playoff Listing
September 30, 2014
By Geoff Kimmerly
Second Half editor
Following is a list of Michigan High School Athletic Association football playing schools, displaying their win-loss records and playoff averages through the fifth week of the season.
Schools on this list are in enrollment order for 11-player teams, with 8-player teams ordered by playoff average. An asterisk (*) beside a record indicates a team has eight or fewer games scheduled. A caret (^) beside a school’s name indicates a team is one win away from playoff qualification.
Those schools with 11-player teams with six or more wins playing nine-game schedules, or five or more wins playing eight games or fewer, will qualify for the MHSAA Football Playoffs beginning Oct. 31. Schools with 5-4, 4-3 or 4-4 records may qualify if the number of potential qualifiers by win total does not reach the 256 mark. Schools with six or more wins playing nine-game schedules or five or more wins playing eight games or fewer may be subtracted from the field based on playoff average if the number of potential qualifiers exceeds the 256 mark.
Once the 256 qualifying schools are determined, they will be divided by enrollment groups into eight equal divisions of 32 schools, and then drawn into regions of eight teams each and districts of four teams each.
Those schools with 8-player teams will be ranked by playoff average at season’s end, and the top 16 programs will be drawn into regions of eight teams each for the playoff in that division, which also begins Oct. 31.
To review a list of all football playoff schools, individual school playoff point details and to report errors, visit the Football page of the MHSAA Website.
The announcement of the qualifiers and first-round pairings for both the 11 and 8-player playoffs will take place on Oct. 26 on the Selection Sunday Show on FOX Sports Detroit. The playoff qualifiers and pairings will be posted to the MHSAA Website following the Selection Sunday Show.
11-Player Playoff Listing
1. Macomb Dakota, 2814, 4-1, 79.200
2. Sterling Heights Stevenson, 2767, 4-1, 75.400
3. Clarkston ^, 2742, 5-0, 107.200
4. Grand Blanc, 2668, 4-1, 72.600
5. East Kentwood ^, 2592, 5-0, 91.200
6. Rockford, 2555, 4-1, 82.000
7. Clinton Township Chippewa Valley, 2538, 3-2, 60.400
8. Dearborn Fordson ^, 2411, 5-0, 91.200
9. Northville, 2298, 4-1, 69.600
10. Holland West Ottawa, 2293, 4-1, 79.000
11. Canton, 2289, 4-1, 75.800
12. Detroit Cass Tech ^, 2277, 5-0, 89.600
13. Brighton, 2133, 3-2, 55.800
14. Plymouth, 2116, 4-1, 66.400
15. Lapeer ^, 2112, 5-0, 89.600
16. Utica Ford, 2090, 3-2, 53.800
17. Hartland, 2007, 4-1, 78.400
18. Monroe, 1992, 4-1, 72.800
19. Grand Haven, 1960, 3-2, 57.400
20. West Bloomfield, 1929, 4-1, 72.800
21. Westland John Glenn, 1872, 3-2, 51.000
22. Warren Mott, 1870, 3-2, 60.200
23. Oxford, 1864, 4-1, 79.200
24. Ann Arbor Pioneer, 1857, 3-2, 53.800
25. Livonia Stevenson, 1848, 3-2, 49.000
26. Saline, 1844, 4-1, 77.933
27. Walled Lake Central, 1815, 4-1, 74.200
28. Romeo, 1770, 3-2, 58.400
29. Hudsonville, 1759, 3-2, 57.200
30. Waterford Mott, 1738, 4-1, 76.000
31. Rochester Hills Stoney Creek, 1711, 3-2, 55.800
32. Livonia Churchill ^, 1696, 5-0, 97.600
33. Grand Ledge, 1689, 3-2, 55.800
34. Waterford Kettering, 1610, 3-2, 52.400
35. Flint Carman-Ainsworth, 1568, 4-1, 70.800
36. Warren DeLaSalle, 1562, 3-2, 47.467
37. Detroit Western International, 1521, 3-2, 45.400
38. Detroit Martin Luther King ^, 1507, 5-0, 96.000
39. Walled Lake Western, 1502, 4-1, 72.600
40. Traverse City Central, 1490, 4-1, 78.600
41. Oak Park, 1486, 4-1, 74.400
42. Brownstown Woodhaven ^, 1484, 5-0, 96.000
43. Ypsilanti Lincoln, 1422, 3-2, 52.000
44. Caledonia, 1417, 3-2, 58.200
45. Midland, 1400, 3-2, 51.800
46. Portage Central *, 1384, 3-1, 63.000
47. Detroit Pershing, 1379, 3-2, 44.600
48. Southgate Anderson, 1374, 3-2, 50.800
49. Lansing Everett, 1364, 3-2, 53.800
50. Dearborn Edsel Ford, 1356, 3-2, 55.000
51. Wyandotte Roosevelt, 1351, 4-1, 75.800
52. Detroit East English, 1345, 4-1, 72.800
53. Portage Northern, 1345, 4-1, 78.400
54. Port Huron, 1336, 4-1, 79.200
55. Grosse Pointe North, 1310, 3-2, 58.400
56. Ypsilanti Community, 1300, 3-2, 56.600
57. Birmingham Brother Rice ^, 1298, 5-0, 97.600
58. North Farmington, 1296, 3-2, 50.200
59. Garden City, 1290, 3-2, 44.600
60. Battle Creek Lakeview *, 1278, 3-1, 75.000
61. Grand Rapids Ottawa Hills, 1275, 3-2, 47.200
62. Muskegon Mona Shores, 1274, 4-1, 82.200
63. Bay City Central, 1271, 3-2, 49.200
64. Birmingham Groves ^, 1270, 5-0, 86.400
65. Berkley ^, 1265, 5-0, 86.400
66. Flushing, 1260, 4-1, 78.600
67. Midland Dow ^, 1255, 5-0, 91.200
68. South Lyon ^, 1254, 5-0, 99.200
69. Southfield, 1239, 3-2, 57.400
70. Farmington Hills Harrison, 1212, 4-1, 79.000
71. Fenton ^, 1181, 5-0, 96.000
72. Farmington, 1178, 4-1, 72.600
73. Grand Rapids Northview, 1177, 3-2, 52.400
74. Warren Woods Tower ^, 1175, 5-0, 88.000
75. Muskegon ^, 1157, 5-0, 97.600
76. Lowell ^, 1145, 5-0, 86.400
77. Detroit Renaissance, 1144, 3-2, 45.800
78. Greenville, 1130, 4-1, 62.600
79. Gibraltar Carlson, 1129, 3-2, 52.600
80. Battle Creek Central, 1124, 3-2, 50.700
81. Grand Rapids Forest Hills Northern ^, 1113, 5-0, 86.400
82. Holland, 1109, 3-2, 52.000
83. Detroit Cody, 1096, 3-2, 44.400
84. Marquette, 1090, 4-1, 65.933
85. St. Johns ^, 1088, 5-0, 89.600
86. Byron Center, 1085, 4-1, 72.800
87. Allen Park, 1069, 4-1, 74.400
88. Auburn Hills Avondale, 1056, 3-2, 49.400
89. Orchard Lake St. Mary's ^, 1054, 5-0, 94.400
90. Mt. Pleasant, 1050, 3-2, 60.800
91. St. Joseph, 1028, 3-2, 58.600
92. East Grand Rapids, 986, 3-2, 57.600
93. Petoskey, 965, 4-1, 66.400
94. Trenton, 955, 3-2, 54.000
95. Romulus, 950, 4-1, 56.600
96. Riverview, 935, 4-1, 69.400
97. DeWitt ^, 930, 5-0, 91.200
98. Gaylord, 927, 4-1, 63.000
99. Linden, 921, 3-2, 51.000
100. Detroit Mumford, 919, 3-2, 47.400
101. Clio, 918, 3-2, 50.400
102. Cedar Springs, 910, 4-1, 65.800
103. Grand Rapids Christian, 895, 4-1, 74.400
104. Stevensville Lakeshore, 887, 4-1, 81.700
105. Niles, 885, 4-1, 66.200
106. Carleton Airport, 879, 3-2, 44.600
107. Coldwater ^, 876, 5-0, 70.400
108. Tecumseh, 869, 3-2, 57.200
109. New Boston Huron, 867, 4-1, 71.200
110. Warren Fitzgerald, 857, 3-2, 49.000
111. Zeeland West ^, 850, 5-0, 80.000
112. Dearborn Divine Child, 848, 4-1, 63.600
113. Bay City John Glenn, 847, 3-2, 43.200
114. Battle Creek Harper Creek, 845, 3-2, 44.400
115. St. Clair, 844, 4-1, 68.000
116. Edwardsburg, 839, 4-1, 67.800
117. Chelsea, 838, 4-1, 74.000
118. Detroit Old Redford, 837, 3-2, 44.000
119. Plainwell, 812, 4-1, 66.200
120. Marysville, 806, 3-2, 52.600
121. Spring Lake, 802, 3-2, 49.200
122. Detroit Denby, 800, 3-2, 58.800
123. Vicksburg, 794, 4-1, 67.800
124. Bloomfield Hills Cranbrook-Kingswood, 790, 3-2, 41.000
125. Eaton Rapids, 773, 3-2, 45.800
126. Cadillac ^, 747, 5-0, 88.000
127. Goodrich, 737, 4-1, 68.000
128. Three Rivers, 722, 3-2, 50.600
129. Dearborn Heights Robichaud ^, 717, 5-0, 75.600
130. Yale, 716, 4-1, 56.600
131. Harper Woods Chandler Park Academy, 691, 3-2, 52.200
132. Detroit Country Day, 690, 3-2, 51.200
133. Muskegon Orchard View, 662, 4-1, 58.000
134. Williamston ^, 659, 5-0, 80.000
135. Paw Paw, 657, 3-2, 47.600
136. Lansing Sexton ^, 652, 5-0, 102.400
137. Whitehall ^, 644, 5-0, 70.400
138. Grosse Ile, 640, 3-2, 46.200
139. Kalamazoo Hackett, 635, 4-1, 54.800
140. Richmond, 630, 4-1, 69.600
141. Grand Rapids South Christian, 623, 3-2, 49.000
142. Wyoming Kelloggsville, 610, 3-2, 44.600
143. Wyoming Godwin Heights, 609, 4-1, 49.800
144. Saginaw Swan Valley ^, 602, 5-0, 70.400
145. Clawson, 589, 3-2, 40.800
146. North Muskegon, 577, 3-2, 38.200
147. Birch Run ^, 575, 5-0, 72.000
148. Remus Chippewa Hills ^, 567, 5-0, 81.600
149. Flint Powers Catholic, 553, 3-2, 57.400
150. Marine City ^, 553, 5-0, 78.400
151. Freeland ^, 549, 5-0, 78.400
152. Ann Arbor Gabriel Richard, 545, 4-1, 53.600
153. Stanton Central Montcalm, 539, 3-2, 44.200
154. Portland, 538, 3-2, 50.800
155. Menominee ^, 532, 5-0, 83.867
156. Detroit University Prep, 530, 3-2, 46.000
157. River Rouge, 530, 4-1, 67.200
158. Frankenmuth, 528, 4-1, 60.000
159. Gladwin, 528, 4-1, 55.200
160. Ida ^, 527, 5-0, 70.400
161. Hopkins, 522, 4-1, 61.400
162. Grayling, 517, 3-2, 40.850
163. Lansing Catholic ^, 515, 5-0, 80.000
164. Almont ^, 512, 5-0, 73.600
165. Carrollton, 511, 3-2, 37.400
166. Newaygo, 506, 4-1, 61.600
167. Olivet, 505, 4-1, 53.000
168. Berrien Springs, 501, 3-2, 43.800
169. Muskegon Oakridge, 501, 4-1, 55.200
170. Onsted, 499, 4-1, 45.600
171. Chesaning, 480, 4-1, 56.800
172. Manistee, 479, 4-1, 53.400
173. Gladstone, 473, 3-2, 35.000
174. Stockbridge, 462, 4-1, 58.200
175. Reed City, 461, 4-1, 56.600
176. Leslie, 454, 3-2, 37.800
177. Clare, 445, 3-2, 43.200
178. Harrison ^, 444, 5-0, 62.400
179. Kingsley, 439, 3-2, 39.600
180. Grand Rapids West Catholic ^, 438, 5-0, 83.200
181. Lakeview, 426, 4-1, 48.000
182. Beaverton, 422, 3-2, 36.200
183. Calumet, 419, 3-2, 48.133
184. Jonesville, 419, 3-2, 39.800
185. Jackson Lumen Christi ^, 417, 5-0, 76.800
186. Monroe St. Mary Catholic Central ^, 417, 5-0, 84.800
187. Negaunee, 417, 3-2, 36.000
188. Millington ^, 414, 5-0, 76.800
189. Warren Michigan Collegiate ^, 414, 5-0, 72.000
190. Fennville, 407, 3-2, 34.600
191. Ithaca ^, 405, 5-0, 72.000
192. Sanford Meridian Early College, 404, 4-1, 45.200
193. Hillsdale, 401, 4-1, 52.000
194. Hanover-Horton, 399, 4-1, 40.600
195. Boyne City ^, 395, 5-0, 65.600
196. Grass Lake ^, 395, 5-0, 56.000
197. Madison Heights Madison, 393, 4-1, 71.200
198. Montrose, 392, 4-1, 53.400
199. Tawas, 385, 4-1, 54.800
200. Elk Rapids, 384, 3-2, 43.000
201. Niles Brandywine, 383, 4-1, 57.800
202. Manchester, 379, 4-1, 55.200
203. Watervliet, 378, 4-1, 47.000
204. Quincy, 375, 3-2, 28.400
205. Vassar, 375, 3-2, 36.800
206. St. Charles, 373, 3-2, 46.200
207. Bad Axe, 371, 3-2, 38.200
208. Constantine ^, 371, 5-0, 66.000
209. Clinton ^, 367, 5-0, 65.600
210. Vandercook Lake, 366, 4-1, 42.200
211. Laingsburg, 361, 4-1, 48.800
212. Schoolcraft, 361, 3-2, 48.400
213. Flint Beecher ^, 350, 5-0, 73.600
214. Grand Rapids NorthPointe Christian, 347, 4-1, 55.000
215. Kent City, 344, 3-2, 34.600
216. Leroy Pine River, 343, 3-2, 41.400
217. Ravenna, 342, 4-1, 48.600
218. Carson City-Crystal, 330, 3-2, 36.000
219. Bridgman *, 327, 3-1, 48.600
220. Ishpeming Westwood, 318, 3-2, 33.200
221. Marlette, 316, 4-1, 49.800
222. Homer ^, 312, 5-0, 57.600
223. Elkton-Pigeon-Bay Port Laker ^, 308, 5-0, 62.400
224. Ishpeming *, 307, 5-0, 68.800
225. Traverse City St. Francis, 305, 3-2, 41.600
226. Burton Atherton, 304, 4-1, 53.600
227. Pewamo-Westphalia, 302, 4-1, 45.400
228. Dansville, 301, 3-2, 41.400
229. Gobles, 301, 4-1, 55.200
230. Iron Mountain, 298, 3-2, 40.000
231. Riverview Gabriel Richard, 297, 3-2, 49.400
232. Flint Hamady, 295, 4-1, 42.200
233. Union City ^, 294, 5-0, 56.000
234. Rochester Hills Lutheran Northwest, 289, 3-2, 36.400
235. Ecorse, 288, 3-2, 38.800
236. Whittemore-Prescott ^, 283, 5-0, 67.200
237. Mancelona, 282, 3-2, 28.400
238. Saugatuck, 281, 3-2, 38.200
239. Detroit Loyola ^, 278, 5-0, 85.200
240. Manton, 276, 3-2, 34.600
241. Royal Oak Shrine Catholic, 273, 4-1, 49.800
242. Hudson, 271, 4-1, 45.600
243. Grosse Pointe Woods University Liggett, 270, 4-1, 48.600
244. Decatur ^, 262, 5-0, 70.400
245. Lincoln Alcona, 260, 3-2, 35.000
246. Iron River West Iron County ^, 259, 5-0, 67.200
247. New Lothrop ^, 259, 5-0, 68.800
248. Blanchard Montabella, 256, 4-1, 48.200
249. Breckenridge, 247, 3-2, 38.000
250. Reading, 246, 3-2, 33.200
251. Norway, 244, 3-2, 32.767
252. Onekama, 244, 3-2, 28.400
253. Saginaw Michigan Lutheran Seminary, 243, 4-1, 48.800
254. Suttons Bay, 243, 4-1, 51.050
255. Indian River Inland Lakes, 242, 4-1, 42.400
256. Ottawa Lake Whiteford, 238, 3-2, 34.800
257. Johannesburg-Lewiston, 237, 4-1, 44.000
258. Petersburg-Summerfield, 233, 3-2, 38.400
259. Harbor Beach ^, 232, 5-0, 65.600
260. Bessemer *, 231, 3-2, 28.467
261. L'Anse, 230, 3-2, 36.600
262. White Pigeon, 226, 3-2, 35.700
263. Beal City ^, 222, 5-0, 68.800
264. Lutheran Westland, 221, 4-1, 50.200
265. Coleman, 217, 4-1, 45.800
266. Mendon, 214, 4-1, 51.800
267. St. Ignace ^, 211, 5-0, 59.200
268. Pittsford, 205, 4-1, 36.800
269. Bark River-Harris, 194, 4-1, 37.300
270. Munising, 194, 4-1, 41.200
271. Central Lake, 190, 3-2, 28.600
272. Fowler ^, 189, 5-0, 62.400
273. Morenci ^, 184, 5-0, 67.200
274. Muskegon Catholic Central ^, 183, 5-0, 81.600
275. Sterling Heights Parkway Christian, 171, 3-2, 40.800
Drive for Detroit: Playoff Week 1 Preview
October 25, 2018
By Geoff Kimmerly
Second Half editor
Everything will seem to speed up from here for 288 Michigan high school football teams beginning their playoff runs this weekend.
 Temperatures dip below freezing, practices finish in the dark and urgency is at its utmost this time of year. But soon the reward will come into view – trips to Ford Field for the elite 11-player teams and Superior Dome for the best of the 8-player lineup.
All eight reigning champions and all eight 2017 runners-up are back as 11-player playoffs begin at the District level this weekend. Three of four 8-player finalists from last season, including one champion, are back as those brackets begin at the Pre-Regional level. A total of 125 games will be played tonight, with 19 more Saturday.
In addition to watching live from the stands, there are plenty of opportunity to watch playoff games all over the state either live or later this weekend. FOX Sports Detroit PLUS will bring the Division 7 opener at Kent City against Saugatuck to a live cable audience, and that game joins Haslett at East Lansing and Davison at Oxford to make up this week’s Prep Zone lineup streaming free of charge on FOXSportsDetroit.com and on the FOX Sports app. At least 13 more games will be viewable on MHSAA.tv, either live with subscription or free after 72 hours.
Below is a glance at a game of particular intrigue in each division. “Drive for Detroit” is powered by MI Student Aid.
Division 1
Grosse Pointe South (8-1) at Dearborn Fordson (8-1)
These two make up one side of what might be the strongest District in Division 1 – on the other side Detroit Cass Tech (9-0) takes on Detroit Western (6-3). The Blue Devils won the Macomb Area Conference White for the third straight season and tripped up only Week 9 against Romeo – over the first eight games, they gave up 5.4 points per game. For the second straight regular season, Fordson’s only loss came to undefeated Belleville – and this time by only three points. The Tractors also are one of only four in-state teams to give the Technicians a close game over the last two years – losing by just five in last season’s District Final – but they can’t look past Grosse Pointe South toward a possible rematch.
Others that caught my eye: FRIDAY Holland West Ottawa (6-3) at Hudsonville (6-3), Canton (6-3) at Detroit Catholic Central (6-3), Romeo (6-3) at Macomb Dakota (7-2). SATURDAY Brighton (7-2) at East Kentwood (8-1).
Division 2
Birmingham Groves (7-2) at Birmingham Seaholm (7-2)
This is one of those few rematches from Week 9 that crop up for the start of the playoffs every season, and Groves won this neighborly meeting 26-9 last week. But don’t think things can’t change over six days – it happens, and the Oakland Activities Association Blue champion Maples still gave up only 13 points per game during their first winning regular season since 2013. That said, Groves certainly knows how to turn it up in the playoffs. The Falcons are making their sixth straight postseason appearance and lost last year’s opener by just three to Brother Rice after making the Semifinals in 2016.
Others that caught my eye: FRIDAY Portage Central (7-2) at Portage Northern (7-2), Warren DeLaSalle (7-2) at Warren Mott (7-2), Walled Lake Western (6-3) at Fenton (7-2), St. Clair Shores Lake Shore (6-3) at Port Huron Northern (8-1).
Division 3
River Rouge (8-1) at Detroit Martin Luther King (7-2)
River Rouge’s enrollment has grown by more than 350 students over the last four years, as the Panthers went from Division 5-runner-up in 2015 to making Division 4 Semifinals the last two years and now playing in Division 3. Rouge’s only loss this fall was Week 1 to Cass Tech 40-7, and King fell by nearly the same score (42-8) to the Technicians in last week’s Detroit Public School League A championship game. The Crusaders also have lots of postseason experience, winning Division 2 in 2015 and 2016 and making the Semifinals last season before losing by a point to eventual champion Warren DeLaSalle. Just as impressive this fall, King’s only other defeat was by three to reigning Division 3 champion Muskegon – which has won 23 straight games and the rest this season by an average of 42 points per.
Others that caught my eye: FRIDAY East Grand Rapids (6-3) at Muskegon (9-0), Battle Creek Central (6-3) at Middleville Thornapple Kellogg (7-2), Garden City (6-3) at Warren Woods Tower (8-1), Haslett (8-1) at East Lansing (8-1).
Division 4
Bloomfield Hills Cranbrook Kingswood (6-3) at Farmington Hills Harrison (6-3), Saturday
The Harrison watch continues as John Herrington, the winningest coach in state football history, leads the Hawks into their final playoffs with the school closing next summer. After two straight losses, Harrison beat Farmington last week to earn an automatic playoff berth and slotted in Division 4 after finishing runner-up in Division 3 last season. The Cranes might not seem as dangerous as a year ago when they set a school wins record going 10-2. But they moved into the tougher Detroit Catholic League AA this fall, and all three losses this season were by seven or fewer points – and now they’re back in the familiar Division 4 bracket.
Others that caught my eye: FRIDAY Paw Paw (7-2) at Three Rivers (8-1), Lake Odessa Lakewood (7-2) vs. Flint Powers Catholic (6-3) at Atwood Stadium, Croswell-Lexington (6-3) at North Branch (7-2), Wyoming Godwin Heights (6-3) at Grand Rapids South Christian (5-4).
Division 5
Grand Rapids West Catholic (5-4) at Hudsonville Unity Christian (7-2)
It’s pretty well-known at this point that West Catholic has won five straight Division 5 titles and made six straight MHSAA Finals. The Falcons had to come back from a 1-3 start this fall and beat Coopersville in Week 9 to earn a shot at becoming an additional qualifier – but keep in mind they won it all in 2013 as an additional qualifier. Unity Christian has looked for a few years like a program inevitably on its way to Ford Field. The Crusaders made the Division 4 Semifinals in 2016 and lost last year’s D4 opener by just six to eventual champion Grand Rapids Catholic Central. They lost out on a share of a league title last week falling to Zeeland East, but both defeats this season came to Division 3 playoff teams – and Unity won three games over teams that made the Division 4 bracket.
Others that caught my eye: FRIDAY Berrien Springs (7-2) at Hopkins (8-1), Lansing Catholic (8-1) at Olivet (8-1), Detroit Osborn (6-3) at Detroit Denby (7-2). SATURDAY Clare (8-1) at Manistee (9-0).
Division 6
Michigan Center (8-1) at Grass Lake (8-1)
The Cardinals missed locking up a second straight Cascades Conference championship by less than a touchdown, falling to eventual title winner Grass Lake 14-10 in Week 6. Michigan Center led until the final two minutes – and this rematch should be a welcome opportunity. The Warriors are coming off a 55-7 loss to Division 8 contender Reading a week ago in the Cascades/Big 8 Conference champions crossover, but before that were giving up only 8.8 points per game. It’s easy to anticipate these teams keeping the score low and close again tonight.
Others that caught my eye: FRIDAY Ishpeming Westwood (7-2) at Calumet (9-0), Ecorse (7-2) vs. Warren Michigan Collegiate (8-1) at Madison Heights Bishop Foley, Constantine (6-3) at Schoolcraft (7-2), Hemlock (8-1) at Montrose (7-2).
Division 7
Saugatuck (8-1) at Kent City (8-1)
Kent City was a seven-point defeat to unbeaten Lake City from a second straight perfect regular season, and the Eagles get the chance to impress the statewide TV crowd by shutting down an Indians offense averaging nearly 51 points per game. Senior Brad Dunn leads Saugatuck with 2,189 yards and 38 touchdowns rushing, and senior Jacob Stewart (918/13) also could go over 1,000 yards for the season for the reigning Division 7 runner-up – which lost only to Schoolcraft, by a point. Kent City gives up just under 11 points per game and held Lake City to 22 below its final regular-season scoring average in that 14-7 Week 8 loss.
Others that caught my eye: FRIDAY Cass City (7-2) at Sandusky (8-1). SATURDAY Harbor Springs (7-2) at Roscommon (8-1), Oscoda (8-1) at Iron Mountain (7-2), Detroit Loyola (6-3) at Madison Heights Bishop Foley (8-1).
Division 8
Pittsford (7-2) at Reading (9-0)
The Rangers have put together strong teams over the years – they’re making their 24th playoff appearance, and the 2008 team reached the Division 7 Semifinals. But it’s a good argument this is Reading’s most impressive team of the playoff era as it outscores opponents 50-4 on average and outscored five playoff-bound teams by an average of 47-7. Pittsford has reasons to be confident too heading into its fifth straight playoffs and seventh in eight seasons. The Wildcats emerged from a four-team league where all four made the playoffs this fall, and their losses both were to playoff-bound teams. Pittsford also beat Waterford Our Lady (see below) big in Week 4 and is giving up only 8.7 points per game this fall.
Others that caught my eye: FRIDAY Waterford Our Lady (5-4) at Clarkston Everest Collegiate (8-1), Adrian Lenawee Christian (8-1) at Ottawa Lake Whiteford (9-0), Saginaw Nouvel (6-3) at Harbor Beach (8-1), Mendon (5-4) at White Pigeon (7-2).
8-Player Division 1
Kingston (8-1) at Deckerville (7-2)
Deckerville has played in two straight MHSAA Finals, falling just three points short of the Division 1 title a year ago. The Eagles opened their North Central Thumb League Blue title march this fall with a 36-20 win over Kingston in Week 5, and they’re 10-0 against the Cardinals since the teams began playing each other regularly again in 2010. Kingston this fall tied its most wins since 2006, and a ninth victory would tie a high since 1999 – while also breaking the streak and making the Cardinals instant Division 1 contenders.
Others that caught my eye: FRIDAY Battle Creek St. Philip (6-3) at Bellevue (8-1), Genesee (5-4) at Morrice (9-0), Camden-Frontier (5-4) at Colon (8-1).
8-Player Division 2
Crystal Falls Forest Park (5-4) at Powers North Central (8-1)
North Central clinched the Great Lakes Conference West ahead of second-place Forest Park thanks to a 52-28 win Week 6, and that was just the latest meeting between the two with potential championship implications. The Jets downed the Trojans 60-50 in a Regional Final in 2016 on the way to winning the 8-player title, and the Trojans beat the Jets 20-6 in last season’s playoff opener on the way to winning the Division 2 championship. North Central, with its only loss opening night to Engadine, would seem a big favorite this time – but Forest Park is putting up 44 points per game despite giving up 34 and should be comfortable if forced to trade score for score.
Others that caught my eye: FRIDAY Rapid River (6-3) at Engadine (8-1), Marion (6-3) at Onekama (7-2), SATURDAY Peck (5-4) vs. Portland St. Patrick (5-4) at Portland.
Second Half’s weekly “Drive for Detroit” previews and reviews are powered by MI Student Aid, a part of the Student Financial Services Bureau located within the Michigan Department of Treasury. MI Student Aid encourages students to pursue postsecondary education by providing access to student financial resources and information, including various student financial assistance programs to help make college more affordable for Michigan students. MI Student Aid administers the state’s 529 savings programs (MET/MESP) and eight additional aid programs within its Student Scholarships and Grants division. Click for more information and connect with MI Student Aid on Facebook and Twitter @mistudentaid.
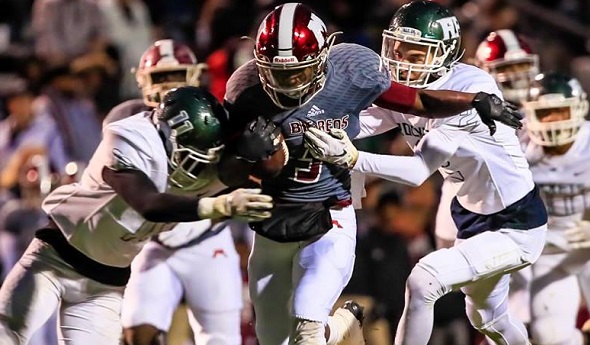
PHOTO: Jeremiah Lockhart and Muskegon, here against Reeths-Puffer, are among reigning champions seeking to repeat as playoffs begin this week. (Photo by Tim Reilly.)