

2015 Week 5 Football Playoff Listing
September 22, 2015
By Geoff Kimmerly
Second Half editor
Here is a list of Michigan High School Athletic Association football playing schools, displaying their win-loss records and playoff averages through the fourth week of the season.
Schools on this list are in enrollment order for 11-player teams, with 8-player teams ordered by playoff average. An asterisk (*) beside a record indicates a team has eight or fewer games scheduled. A caret (^) beside a school’s name indicates a team is one win away from playoff qualification.
Those schools with 11-player teams with six or more wins playing nine-game schedules, or five or more wins playing eight games or fewer, will qualify for the MHSAA Football Playoffs beginning Oct. 30. Schools with 5-4, 4-3 or 4-4 records may qualify if the number of potential qualifiers by win total does not reach the 256 mark. Schools with six or more wins playing nine-game schedules or five or more wins playing eight games or fewer may be subtracted from the field based on playoff average if the number of potential qualifiers exceeds the 256 mark.
Once the 256 qualifying schools are determined, they will be divided by enrollment groups into eight equal divisions of 32 schools, and then drawn into regions of eight teams each and districts of four teams each. Those schools with 8-player teams will be ranked by playoff average at season’s end, and the top 16 programs will be drawn into regions of eight teams each for the playoff in that division, which also begins Oct. 30.
To review a list of all football playoff schools, individual school playoff point details and to report errors, visit the Football page of the MHSAA Website.
The announcement of the qualifiers and first-round pairings for both the 11 and 8-player playoffs will take place at 7 p.m. on Oct. 25 on the Selection Sunday Show on FOX Sports Detroit. The playoff qualifiers and pairings will be posted to the MHSAA Website following the Selection Sunday Show.
11-Player Playoff Listing
1. Macomb Dakota, 2921, 3-1, 72.750
2. Grand Blanc, 2727, 3-1, 64.750
3. Utica Eisenhower, 2669, 3-1, 74.500
4. Sterling Heights Stevenson, 2634, 3-1, 66.500
5. Clinton Township Chippewa Valley, 2611, 3-1, 76.500
6. East Kentwood, 2581, 4-0, 94.000
7. Howell, 2567, 4-0, 90.000
8. Detroit Cass Tech, 2285, 4-0, 90.000
9. Northville, 2281, 4-0, 86.000
10. Brighton, 2211, 4-0, 101.111
11. Detroit Catholic Central, 2138, 3-1, 45.167
12. Utica Ford, 2080, 3-1, 68.750
13. Canton, 2076, 4-0, 92.000
14. Monroe, 2066, 3-1, 66.750
15. Lapeer, 2059, 4-0, 80.000
16. Plymouth, 2057, 3-1, 64.500
17. Ann Arbor Pioneer, 2025, 4-0, 84.000
18. West Bloomfield, 1932, 4-0, 92.000
19. Saline, 1879, 4-0, 84.000
20. Livonia Stevenson, 1831, 4-0, 92.000
21. Warren Mott, 1810, 4-0, 94.000
22. Hudsonville, 1763, 3-1, 68.500
23. Belleville, 1735, 3-1, 66.250
24. Romeo, 1673, 4-0, 96.000
25. Grand Ledge, 1663, 4-0, 80.000
26. Walled Lake Northern, 1611, 3-1, 66.750
27. Warren DeLaSalle, 1572, 3-1, 58.750
28. Sterling Heights, 1561, 4-0, 78.000
29. Detroit Martin Luther King, 1537, 4-0, 94.000
30. Warren Cousino, 1514, 3-1, 64.500
31. Waterford Kettering, 1512, 3-1, 62.750
32. Detroit U-D Jesuit, 1486, 3-1, 45.417
33. Traverse City Central, 1474, 4-0, 86.000
34. Walled Lake Western, 1462, 4-0, 98.000
35. Midland, 1419, 4-0, 84.000
36. Lincoln Park, 1363, 3-1, 68.750
37. Portage Central, 1351, 4-0, 95.778
38. Wyandotte Roosevelt, 1346, 3-1, 72.500
39. Detroit East English, 1338, 3-1, 64.750
40. Southfield, 1269, 3-1, 74.750
41. Midland Dow, 1256, 3-1, 62.500
42. Berkley, 1248, 3-1, 54.250
43. Birmingham Groves, 1248, 4-0, 82.000
44. Jackson, 1244, 3-1, 58.250
45. Flushing, 1242, 3-1, 68.500
46. Muskegon Mona Shores, 1239, 4-0, 90.000
47. Farmington Hills Harrison, 1218, 3-1, 64.750
48. Farmington, 1176, 3-1, 70.500
49. Lowell, 1168, 3-1, 72.750
50. Gibraltar Carlson, 1140, 3-1, 62.500
51. Grand Rapids Forest Hills Northern, 1124, 4-0, 90.000
52. Muskegon, 1113, 3-1, 76.500
53. Fenton, 1108, 3-1, 68.250
54. Byron Center, 1070, 3-1, 64.750
55. Mt. Pleasant, 1061, 3-1, 70.750
56. Ortonville-Brandon, 1060, 3-1, 64.500
57. Allen Park, 1058, 3-1, 64.500
58. St. Johns, 1053, 3-1, 74.500
59. Zeeland East, 1040, 3-1, 70.500
60. Orchard Lake St. Mary's *^, 1032, 4-0, 90.400
61. St. Joseph, 980, 3-1, 70.500
62. East Grand Rapids, 975, 3-1, 70.500
63. Petoskey, 970, 3-1, 58.250
64. DeWitt, 960, 4-0, 96.000
65. Romulus, 956, 3-1, 62.750
66. Trenton, 953, 4-0, 86.000
67. Linden, 947, 3-1, 66.750
68. Gaylord, 940, 4-0, 76.667
69. Sturgis, 926, 3-1, 54.250
70. Grand Rapids Christian, 905, 3-1, 64.500
71. Haslett, 875, 3-1, 68.500
72. Stevensville Lakeshore, 874, 3-1, 72.750
73. Coldwater, 863, 4-0, 84.000
74. Marshall, 863, 3-1, 64.750
75. Vicksburg, 858, 3-1, 58.750
76. Edwardsburg, 851, 4-0, 74.000
77. Sault Ste. Marie, 850, 3-1, 71.833
78. Chelsea, 845, 4-0, 78.000
79. Zeeland West, 840, 4-0, 82.000
80. Ada Forest Hills Eastern, 828, 4-0, 72.000
81. Milan, 820, 3-1, 60.500
82. Bloomfield Hills Cranbrook Kingswood, 794, 4-0, 68.000
83. North Branch, 758, 3-1, 54.250
84. Pontiac Notre Dame Prep, 728, 4-0, 84.000
85. Detroit Country Day, 685, 3-1, 56.500
86. Comstock Park, 682, 3-1, 70.750
87. Detroit Cesar Chavez Academy, 681, 3-1, 40.750
88. Croswell-Lexington, 668, 3-1, 52.750
89. St. Clair Shores South Lake, 668, 4-0, 86.000
90. Hudsonville Unity Christian, 665, 3-1, 48.250
91. Grand Rapids Catholic Central, 658, 3-1, 65.667
92. Williamston, 657, 3-1, 62.500
93. Corunna, 656, 3-1, 56.250
94. Whitehall, 656, 3-1, 64.556
95. Detroit Collegiate Prep, 632, 4-0, 72.000
96. Lake Fenton, 625, 3-1, 50.750
97. Lake Odessa Lakewood, 624, 4-0, 60.000
98. Saginaw Swan Valley, 613, 3-1, 56.500
99. Dowagiac, 611, 3-1, 54.500
100. Flint Powers Catholic, 610, 3-1, 68.500
101. Big Rapids, 609, 4-0, 68.000
102. Richmond, 605, 4-0, 78.000
103. Remus Chippewa Hills, 600, 3-1, 54.500
104. River Rouge, 593, 4-0, 82.000
105. Clawson, 592, 3-1, 44.000
106. Dearborn Heights Robichaud, 573, 4-0, 78.000
107. Freeland, 563, 4-0, 76.000
108. Portland, 563, 4-0, 84.000
109. Ann Arbor Gabriel Richard, 556, 3-1, 56.500
110. Southfield Bradford Academy, 550, 3-1, 46.250
111. Ida, 548, 4-0, 74.000
112. Kingsford, 547, 3-1, 59.417
113. Marine City, 540, 3-1, 50.750
114. Muskegon Oakridge, 538, 3-1, 43.833
115. Algonac, 532, 4-0, 68.000
116. Frankenmuth, 529, 4-0, 66.000
117. Olivet, 524, 3-1, 48.000
118. Detroit Henry Ford, 523, 3-1, 44.000
119. Lansing Catholic, 517, 3-1, 60.750
120. Almont, 513, 4-0, 62.000
121. Onsted, 509, 3-1, 44.750
122. Berrien Springs, 495, 4-0, 68.800
123. Parchment, 493, 3-1, 42.000
124. Stockbridge, 493, 3-1, 54.750
125. Ovid-Elsie, 491, 3-1, 56.750
126. Reed City, 491, 4-0, 56.667
127. Grayling, 489, 3-1, 50.750
128. Clinton Township Clintondale, 486, 3-1, 62.750
129. Menominee, 480, 4-0, 76.800
130. Harper Woods, 476, 3-1, 50.500
131. Manistee, 469, 4-0, 68.667
132. Brooklyn Columbia Central, 463, 4-0, 68.000
133. Buchanan, 459, 4-0, 66.000
134. Harrison, 430, 3-1, 50.250
135. Jackson Lumen Christi, 426, 4-0, 80.000
136. Lakeview, 417, 3-1, 48.250
137. Sanford Meridian Early College, 408, 4-0, 66.000
138. Ithaca, 402, 4-0, 62.000
139. Byron, 399, 3-1, 48.500
140. Delton Kellogg, 398, 3-1, 50.500
141. Millington, 398, 4-0, 74.000
142. Montague, 396, 4-0, 60.000
143. Burton Bendle, 393, 3-1, 46.750
144. Oscoda, 391, 3-1, 34.000
145. Monroe St. Mary Catholic Central, 389, 4-0, 82.000
146. Negaunee, 385, 4-0, 64.000
147. Maple City Glen Lake, 384, 3-1, 38.500
148. Boyne City, 383, 4-0, 60.000
149. Vassar, 377, 3-1, 38.750
150. St. Louis, 374, 3-1, 44.250
151. Laingsburg, 373, 3-1, 42.750
152. Watervliet, 372, 3-1, 48.750
153. Madison Heights Madison, 367, 3-1, 62.750
154. Manchester, 365, 3-1, 44.750
155. Schoolcraft, 357, 4-0, 64.000
156. Grand Rapids NorthPointe Christian, 345, 4-0, 64.000
157. Lawton, 342, 4-0, 56.000
158. Vandercook Lake, 341, 4-0, 56.000
159. Clinton, 335, 4-0, 60.000
160. Traverse City St. Francis, 320, 4-0, 68.000
161. Hesperia, 310, 4-0, 58.000
162. Sandusky, 310, 4-0, 56.000
163. McBain, 307, 3-1, 50.750
164. Cass City, 304, 3-1, 40.500
165. Bridgman, 303, 4-0, 60.000
166. Gobles, 301, 3-1, 48.000
167. Marlette, 298, 3-1, 42.500
168. Union City, 298, 3-1, 40.500
169. Elkton-Pigeon-Bay Port Laker, 296, 3-1, 44.500
170. Homer, 294, 3-1, 40.500
171. Pewamo-Westphalia, 292, 4-0, 60.000
172. Flint Hamady, 291, 4-0, 54.000
173. Dansville, 289, 3-1, 40.750
174. Saginaw Nouvel, 285, 3-1, 45.417
175. Riverview Gabriel Richard, 284, 4-0, 56.000
176. Grosse Pointe Woods University Liggett, 282, 3-1, 46.250
177. Harbor Springs, 281, 3-1, 28.500
178. Flint Beecher, 278, 4-0, 70.000
179. Ishpeming *^, 278, 4-0, 60.000
180. Detroit Loyola, 276, 3-1, 60.750
181. New Lothrop, 276, 4-0, 68.000
182. Saugatuck, 271, 4-0, 56.000
183. Ubly, 271, 3-1, 48.500
184. Cassopolis, 270, 3-1, 40.750
185. Concord, 267, 3-1, 50.500
186. Decatur, 266, 3-1, 44.250
187. Lincoln Alcona, 265, 4-0, 40.000
188. Unionville-Sebewaing, 262, 3-1, 46.750
189. Ottawa Lake Whiteford, 255, 3-1, 36.500
190. Indian River Inland Lakes, 251, 3-1, 38.750
191. Onekama, 250, 4-0, 48.000
192. Petersburg-Summerfield, 240, 3-1, 42.750
193. Beal City, 228, 4-0, 60.000
194. Johannesburg-Lewiston, 226, 4-0, 50.000
195. St. Ignace, 225, 4-0, 48.000
196. Saginaw Michigan Lutheran Seminary, 223, 4-0, 62.000
197. Mayville, 217, 3-1, 40.750
198. L'Anse, 215, 3-1, 50.250
199. Newberry, 211, 3-1, 42.750
200. Pittsford, 211, 3-1, 34.750
201. Vestaburg, 205, 3-1, 36.500
202. Bark River-Harris, 194, 4-0, 54.000
203. Morenci, 191, 4-0, 64.000
204. Munising, 191, 3-1, 43.700
205. Fowler, 183, 4-0, 52.000
206. Adrian Lenawee Christian, 170, 3-1, 28.750
207. Climax-Scotts, 163, 4-0, 48.000
208. Frankfort, 160, 3-1, 46.500
209. Waterford Our Lady, 157, 4-0, 66.000
210. Lake Linden-Hubbell, 155, 4-0, 47.067
211. Colon, 153, 3-1, 36.750
212. Hillman, 146, 3-1, 28.250
213. Bay City All Saints, 118, 3-1, 28.500
8-Player Playoff Listing
1. Rapid River, 111, 4-0, 46.000
2. Owendale-Gagetown, 49, 4-0, 45.333
3. Deckerville, 178, 4-0, 44.000
4. Battle Creek St. Philip, 144, 4-0, 42.000
5. Powers North Central, 198, 4-0, 42.000
6. Posen, 84, 4-0, 40.000
7. Waldron, 88, 4-0, 40.000
8. Cedarville, 144, 3-1, 36.750
9. Webberville, 184, 4-0, 34.000
10. Peck, 152, 3-1, 32.500
11. Lawrence, 189, 4-0, 32.000
12. Morrice, 169, 3-1, 30.750
13. Pickford, 164, 3-1, 28.500
14. Baraga, 164, 3-1, 28.250
15. Portland St. Patrick, 87, 3-1, 26.750
16. Akron-Fairgrove, 99, 3-1, 26.333
17. New Haven Merritt Academy, 148, 3-1, 24.750
18. Stephenson, 186, 2-2, 23.000
19. Marion *, 145, 2-2, 22.583
20. Bellaire, 134, 2-2, 21.500
21. Kingston, 187, 2-2, 21.500
22. Onaway, 196, 2-2, 21.250
23. Engadine, 85, 2-2, 19.250
24. Kinde-North Huron, 147, 2-2, 18.750
25. Tekonsha, 148, 1-3, 12.000
26. Ontonagon, 129, 1-3, 9.750
27. Burr Oak, 75, 1-3, 9.500
28. Caseville, 91, 1-3, 9.500
29. St. Helen Charlton Heston Academy, 108, 1-3, 9.500
30. Eben Junction Superior Central, 123, 1-3, 9.250
31. St. Joseph Michigan Lutheran, 103, 0-4, 2.750
32. Ewen-Trout Creek, 126, 0-4, 2.250
33. Litchfield, 92, 0-4, 2.250
34. Carsonville-Port Sanilac, 120, 0-4, 2.000
35. Big Rapids Crossroads Academy, 190, 0-4, 1.833
36. Flint Michigan School For The Deaf *, 47, 0-3, 1.750
37. Covert *, 91, 0-3, 1.583
38. Hale, 132, 0-4, 1.333
39. Pellston, 170, 0-4, 1.250
40. Brimley, 142, 0-4, 1.000
As Football Launches Again, Reeths-Puffer Fueled for Fresh Start
By
Geoff Kimmerly
MHSAA.com senior editor
August 9, 2021
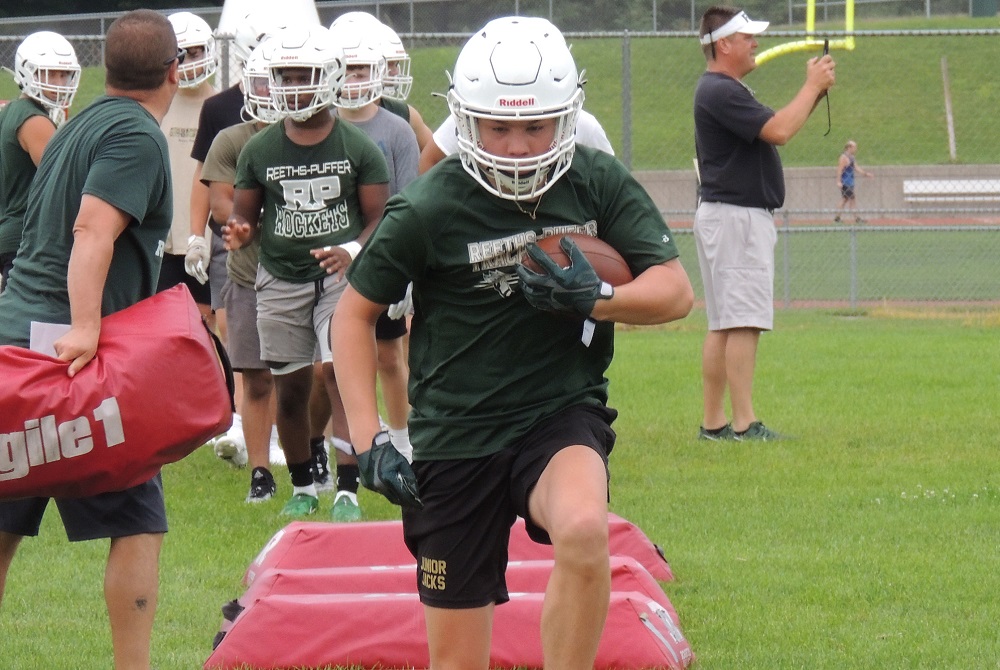
MUSKEGON – A Reeths-Puffer running back tripped and plowed into the Kit Kat-shaped bags he was supposed to be hurdling Monday, and his teammates laughed. The offensive line coach wore a shirt, like line coaches always do, that read “No One Works Harder Than The Offensive Line.” The sun came out about halfway through, but the breeze kept the weather just right, and after a hands-in, all-together “R-P!” someone shouted, “I’ve missed that!”
The setting was as typical as could be for the first day of football practice at any high school across Michigan over the last many years … except for 2020.
Remember a year ago? When COVID-19 precautions meant little to no contact for the most contact-filled sport? When locker rooms were closed and footballs were wiped down after every snap? And the possibility of the season ending at any moment hung in the air?
“I was telling the team (last year) we could play our first game and the rest of the season could get canceled, so you don’t know,” Rockets senior lineman Marco Fields recalled. “The seniors only got to play half their season, and some got hurt.
“Now that we know we have a full senior season ahead of us, for us seniors, all we can do now is stay focused.”
 Indeed, although there’s little debate that COVID-19 is still lingering, just about everything Monday at Reeths-Puffer felt differently from the first day of football practice a year ago. And although varsity head coach Matt Bird thought he might have an answer to what remained the same from 2020 … he really didn’t.
“The same is … (searching for his thought)
“… that you are … (pause)
“Kids … (trailed off)
“Actually, I don’t feel that anything is the same,” he admitted. “Other than we have a football, and we have some things involved from that standpoint.”
Monday marked a fresh start for high school football across Michigan, after last season included multiple COVID-related delays before finishing up in late January – which followed also an abbreviated regular season during which the conversation was forced at times into much more serious topics than the highlights on the field.
But every first day of practice means starting anew. And when it comes to fresh starts, Reeths-Puffer is a great place to begin Fall 2021.
Start with Bird, something of a master when it comes to building from a clean slate.
Way back in 2000, he was an offensive assistant when Grand Ledge won the Division 1 championship, the only Division 1 title that’s been won by a Lansing-area team. Six years later, he took over the Comets program and debuted with back-to-back 3-6 seasons (which predictably didn’t go over too well) before rattling off 10 winning seasons over the next 12 including a Semifinals trip in 2015. That eventually led to a rarely-seen career move after the 2018 season – leaving an established power for a new challenge, as Bird took the Reeths-Puffer job and took on a program that was coming off a second-straight 5-4 finish but accomplished with just under 30 players on the roster.
Bird led his first Rockets team to another 5-4 finish in 2019 … and then 2020 hit. Reeths-Puffer finished 2-5, but all things considered there were plenty of positives to take away.
When practice started, Bird was just finishing up recovery from COVID-19. And despite the unpredictability the season promised, the varsity still managed to grow to 53 players.
“As a coach you have to acknowledge it,” Bird said Monday, recalling 2020. “But the thing that is frustrating to me is you want to acknowledge it, but when you look at it everything was done so differently; it didn’t even feel like a season. At times you’d get started, then kicked back, then started and kicked back. We couldn’t do team dinners, we couldn’t do a lot of the bonding things we do as a group, and that hurt us.”
Monday was the beginning of another fresh start for the Rockets. Set aside that the great majority of COVID restrictions are off – the program is still emphasizing a number of hygiene and health-related concepts to help players avoid illness – and the football-related details provide plenty of excitement.
 On one hand, Reeths-Puffer still plays in the Ottawa-Kent Conference Green – which includes the winningest program in MHSAA history in Muskegon High, back-to-back Division 2 champion Mona Shores and powerful neighbors Zeeland West and East. Grand Rapids Union, Holland and Wyoming all provide some intriguing possibilities as well heading into the new season.
But Bird’s varsity roster looks to push past 50 again, with 20 seniors including four returning senior starters on both sides of the ball. Fields is a Division I-caliber college line prospect, and the sophomore class is shaping up to be special with 6-foot-7 Travis Ambrose of particular note.
“I know every coach says their sport is the best team sport, but there’s something about football where you’ve got 11 guys out there and everybody can contribute,” Bird said. “The 6-5 kid to the 5-7 kid, and you can find a way to make that come together. I’ve always been a big fan, where it’s ‘Tell me that we can’t do something, and let me prove that (we can).’ … We compete using our strengths rather than focusing on some of the things that we don’t have.”
And there are lessons learned last season which, despite its wildness, should pay off. For example, last year teams were forced to focus more on technique with contact cut down substantially, and then rely on technology to cut down on face-to-face conversation. On Monday, Bird was recording his quarterbacks’ footwork with a tablet so he could share the video later over Google Meet, the new norm in communication but something Bird considers a valuable teaching tool brought on by the last 18 months.
The players, for their part, could allow themselves to feel a little lighter than a year ago. Fields and his teammates got to have more fun this time. And they were able talk about the expectations and aspirations that always make the first day a special one.
“I’ve heard people are expecting a normal Reeths-Puffer, and some say ‘Rocket failure again,’ which is just us going 2-5 or whatever they’re trying to say,” Fields said. “But I think we’re going to take this thing all the way.”
“This is normalcy, to an extent,” was Bird’s take on the day. “And it’s just really nice.”
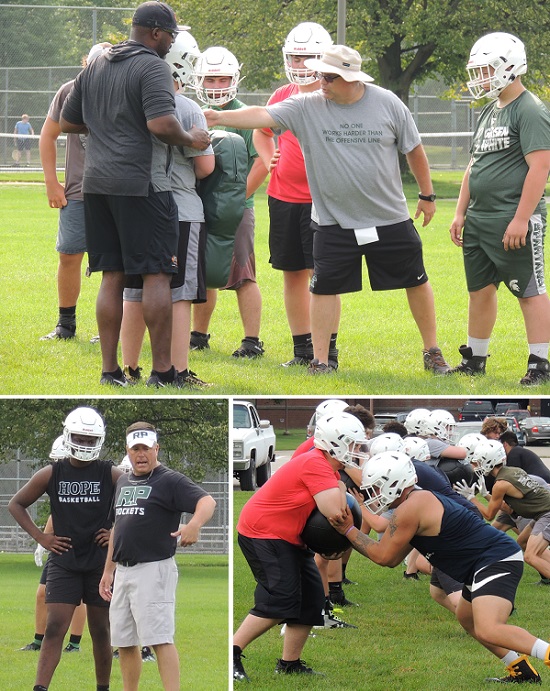
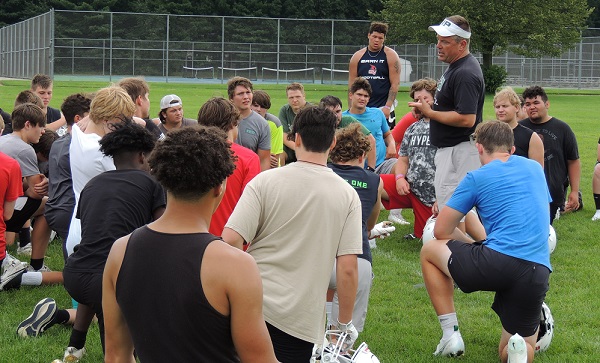
PHOTOS: (Top) Reeths-Puffer running backs hurdle a series of bags during a busy first practice Monday. (Middle) Clockwise from top: Assistant coaches Jari Brown (left) and Jeff Uganski work with the linemen; senior Marco Fields (front, blue sleeveless shirt) is among those working on his form; varsity coach Matt Bird works with one of his quarterbacks and their receivers. (Below) Bird gathers with his team at the end of their first practice of the season. (Photos by Geoff Kimmerly.)