

2015 Week 7 Football Playoff Listing
October 6, 2015
By Geoff Kimmerly
Second Half editor
Here is a list of Michigan High School Athletic Association football playing schools, displaying their win-loss records and playoff averages through the sixth week of the season.
Schools on this list are in enrollment order for 11-player teams, with 8-player teams ordered by playoff average. An asterisk (*) beside a record indicates a team has eight or fewer games scheduled. A caret (^) beside a school’s name indicates a team is one win away from playoff qualification.
Those schools with 11-player teams with six or more wins playing nine-game schedules, or five or more wins playing eight games or fewer, will qualify for the MHSAA Football Playoffs beginning Oct. 30. Schools with 5-4, 4-3 or 4-4 records may qualify if the number of potential qualifiers by win total does not reach the 256 mark. Schools with six or more wins playing nine-game schedules or five or more wins playing eight games or fewer may be subtracted from the field based on playoff average if the number of potential qualifiers exceeds the 256 mark.
Once the 256 qualifying schools are determined, they will be divided by enrollment groups into eight equal divisions of 32 schools, and then drawn into regions of eight teams each and districts of four teams each. Those schools with 8-player teams will be ranked by playoff average at season’s end, and the top 16 programs will be drawn into regions of eight teams each for the playoff in that division, which also begins Oct. 30.
To review a list of all football playoff schools, individual school playoff point details and to report errors, visit the Football page of the MHSAA Website.
The announcement of the qualifiers and first-round pairings for both the 11 and 8-player playoffs will take place at 7 p.m. Oct. 25 on the Selection Sunday Show on FOX Sports Detroit. The playoff qualifiers and pairings will be posted to the MHSAA Website following the Selection Sunday Show.
11-Player Playoff Listing
1. Macomb Dakota, 2921, 4-2, 72.167
2. Grand Blanc, 2727, 4-2, 64.667
3. Clarkston, 2707, 4-2, 66.667
4. Utica Eisenhower, 2669, 3-3, 56.333
5. Sterling Heights Stevenson ^, 2634, 5-1, 82.000
6. Clinton Township Chippewa Valley ^, 2611, 5-1, 92.500
7. East Kentwood, 2581, 4-2, 69.000
8. Howell ^, 2567, 5-1, 77.833
9. Rockford, 2561, 4-2, 69.667
10. Dearborn Fordson, 2477, 3-3, 47.000
11. Detroit Cass Tech ^, 2285, 5-1, 84.833
12. Northville, 2281, 6-0, 97.333
13. Brighton ^, 2211, 5-1, 50.000
14. Troy Athens, 2153, 3-3, 48.333
15. Detroit Catholic Central ^, 2138, 5-1, 74.100
16. Utica Ford, 2080, 4-2, 70.833
17. Canton ^, 2076, 5-1, 80.500
18. Monroe, 2066, 3-3, 49.500
19. Salem, 2063, 3-3, 51.333
20. Lapeer, 2059, 6-0, 88.000
21. Plymouth ^, 2057, 5-1, 77.667
22. Ann Arbor Pioneer ^, 2025, 5-1, 80.833
23. Hartland, 2017, 4-2, 66.667
24. Novi, 2017, 3-3, 48.333
25. Macomb L'Anse Creuse North, 2001, 3-3, 51.000
26. New Baltimore Anchor Bay, 1946, 3-3, 48.833
27. West Bloomfield, 1932, 6-0, 97.333
28. Dearborn, 1921, 3-3, 47.333
29. Saline *, 1879, 6-0, 96.000
30. Livonia Stevenson ^, 1831, 5-1, 83.500
31. Grandville, 1825, 3-3, 47.000
32. Warren Mott ^, 1810, 5-1, 84.667
33. Holt, 1788, 4-2, 59.833
34. Utica, 1788, 3-3, 52.667
35. Davison, 1765, 4-2, 60.833
36. Hudsonville ^, 1763, 5-1, 88.333
37. Belleville ^, 1735, 5-1, 81.667
38. Ann Arbor Skyline, 1703, 3-3, 41.333
39. Romeo, 1673, 6-0, 104.000
40. Grand Ledge, 1663, 6-0, 89.333
41. Rochester Hills Stoney Creek, 1654, 3-3, 44.833
42. Waterford Mott, 1651, 3-3, 45.500
43. Grosse Pointe South, 1629, 4-2, 66.500
44. Livonia Churchill, 1620, 4-2, 61.333
45. Livonia Franklin, 1615, 3-3, 42.000
46. Walled Lake Northern, 1611, 4-2, 65.500
47. Warren DeLaSalle ^, 1572, 5-1, 83.500
48. Sterling Heights ^, 1561, 5-1, 72.500
49. Detroit Martin Luther King, 1537, 6-0, 104.000
50. Flint Carman-Ainsworth, 1533, 3-3, 44.500
51. Oak Park, 1530, 3-3, 48.667
52. Warren Cousino, 1514, 4-2, 61.000
53. Waterford Kettering, 1512, 3-3, 46.833
54. Detroit U-D Jesuit, 1486, 4-2, 58.933
55. Traverse City Central, 1474, 6-0, 100.000
56. Walled Lake Western, 1462, 6-0, 106.667
57. Midland, 1419, 6-0, 93.333
58. Jenison, 1418, 3-3, 51.833
59. Dearborn Edsel Ford, 1380, 3-3, 42.667
60. Portage Northern, 1375, 3-3, 45.667
61. Lincoln Park, 1363, 4-2, 63.500
62. Portage Central, 1351, 6-0, 97.333
63. Wyandotte Roosevelt ^, 1346, 5-1, 81.833
64. Battle Creek Lakeview, 1344, 4-2, 66.500
65. Grosse Pointe North, 1341, 3-3, 45.333
66. Detroit East English, 1338, 4-2, 61.500
67. Swartz Creek, 1322, 3-3, 50.167
68. Southfield-Lathrup, 1320, 4-2, 55.833
69. Dearborn Heights Crestwood, 1308, 3-3, 37.167
70. Alpena, 1285, 3-3, 35.767
71. Grand Rapids Ottawa Hills, 1280, 4-2, 58.167
72. Southfield, 1269, 4-2, 69.333
73. North Farmington, 1267, 3-3, 46.333
74. Port Huron Northern, 1260, 4-2, 56.500
75. Midland Dow ^, 1256, 5-1, 75.167
76. Berkley ^, 1248, 5-1, 71.167
77. Birmingham Groves, 1248, 6-0, 88.000
78. Royal Oak, 1248, 3-3, 45.333
79. Jackson, 1244, 4-2, 55.833
80. Flushing, 1242, 3-3, 48.167
81. Muskegon Mona Shores, 1239, 6-0, 100.000
82. Muskegon Reeths-Puffer, 1222, 3-3, 41.667
83. Farmington Hills Harrison ^, 1218, 5-1, 81.833
84. Grand Rapids Northview, 1183, 3-3, 46.000
85. Farmington, 1176, 4-2, 64.833
86. Mattawan, 1175, 3-3, 47.000
87. Lowell ^, 1168, 5-1, 86.167
88. Gibraltar Carlson, 1140, 4-2, 61.333
89. Grand Rapids Forest Hills Northern ^, 1124, 5-1, 81.833
90. East Lansing, 1123, 3-3, 49.667
91. Battle Creek Central, 1115, 3-3, 50.833
92. Muskegon ^, 1113, 5-1, 90.000
93. Fenton ^, 1108, 5-1, 81.833
94. Ypsilanti Community, 1088, 3-3, 42.667
95. Byron Center ^, 1070, 5-1, 75.333
96. Holly, 1068, 4-2, 69.167
97. Redford Thurston, 1064, 3-3, 52.667
98. Mt. Pleasant, 1061, 4-2, 63.000
99. Ortonville-Brandon, 1060, 3-3, 47.000
100. Allen Park ^, 1058, 5-1, 86.000
101. St. Johns ^, 1053, 5-1, 83.333
102. Zeeland East, 1040, 3-3, 59.333
103. Mason, 1033, 4-2, 61.500
104. Orchard Lake St. Mary's *, 1032, 5-1, 83.524
105. Grand Rapids Kenowa Hills, 1030, 3-3, 48.167
106. Hamtramck, 984, 4-2, 48.333
107. St. Joseph ^, 980, 5-1, 80.500
108. East Grand Rapids, 975, 4-2, 70.500
109. Petoskey, 970, 4-2, 57.267
110. DeWitt, 960, 6-0, 101.333
111. Romulus, 956, 4-2, 63.833
112. Trenton ^, 953, 5-1, 78.000
113. Linden ^, 947, 5-1, 86.167
114. Cedar Springs, 943, 4-2, 60.000
115. Gaylord ^, 940, 5-1, 65.100
116. Sturgis ^, 926, 5-1, 66.833
117. Riverview, 912, 4-2, 49.500
118. Grand Rapids Christian, 905, 4-2, 65.333
119. Parma Western, 876, 4-2, 56.167
120. Haslett, 875, 3-3, 50.000
121. Stevensville Lakeshore, 874, 4-2, 70.667
122. Warren Fitzgerald, 871, 3-3, 40.667
123. Fruitport, 865, 3-3, 38.933
124. Coldwater, 863, 6-0, 92.000
125. Marshall ^, 863, 5-1, 79.500
126. Vicksburg, 858, 4-2, 54.833
127. Edwardsburg, 851, 6-0, 81.333
128. Sault Ste. Marie, 850, 4-2, 67.400
129. Bay City John Glenn, 847, 4-2, 49.600
130. Chelsea, 845, 6-0, 82.667
131. Tecumseh, 844, 3-3, 45.000
132. Zeeland West, 840, 6-0, 89.333
133. Detroit Mumford, 837, 3-3, 46.667
134. Ada Forest Hills Eastern, 828, 6-0, 86.667
135. Dearborn Divine Child, 827, 3-3, 44.500
136. Milan ^, 820, 5-1, 72.667
137. Battle Creek Harper Creek, 816, 3-3, 41.167
138. Plainwell, 807, 4-2, 52.833
139. Fowlerville, 800, 3-3, 44.833
140. Bloomfield Hills Cranbrook Kingswood, 794, 6-0, 72.000
141. Spring Lake, 794, 3-3, 39.767
142. Detroit Denby, 790, 3-3, 47.000
143. Marysville, 783, 4-2, 62.333
144. Holland Christian, 759, 3-3, 40.833
145. North Branch, 758, 3-3, 40.000
146. Goodrich, 754, 4-2, 55.667
147. Pontiac Notre Dame Prep, 728, 5-1, 79.167
148. Allendale, 720, 3-3, 39.000
149. Detroit Douglass, 718, 3-3, 37.667
150. Warren Lincoln, 697, 3-3, 41.500
151. Harper Woods Chandler Park Academy, 692, 4-2, 53.433
152. Detroit Country Day ^, 685, 5-1, 71.167
153. Comstock Park ^, 682, 5-1, 75.500
154. Detroit Cesar Chavez Academy, 681, 4-2, 40.167
155. Croswell-Lexington, 668, 4-2, 46.833
156. St. Clair Shores South Lake, 668, 6-0, 84.000
157. Hudsonville Unity Christian, 665, 4-2, 49.167
158. Grand Rapids Catholic Central ^, 658, 5-1, 77.833
159. Williamston, 657, 4-2, 58.333
160. Corunna ^, 656, 5-1, 69.833
161. Whitehall, 656, 3-3, 42.333
162. Paw Paw, 653, 3-3, 43.000
163. Alma, 642, 3-3, 41.833
164. Wyoming Kelloggsville, 640, 3-3, 33.667
165. Detroit Collegiate Prep, 632, 6-0, 82.667
166. Benton Harbor, 631, 3-3, 51.000
167. Lake Fenton, 625, 4-2, 53.500
168. Lake Odessa Lakewood, 624, 6-0, 72.000
169. Saginaw Valley Lutheran, 620, 3-3, 36.167
170. Saginaw Swan Valley, 613, 4-2, 52.833
171. Dowagiac, 611, 3-3, 39.167
172. Flint Powers Catholic, 610, 4-2, 63.667
173. Big Rapids, 609, 4-2, 49.333
174. Richmond ^, 605, 5-1, 68.833
175. Wyoming Godwin Heights, 602, 4-2, 46.333
176. Remus Chippewa Hills ^, 600, 5-1, 65.667
177. River Rouge, 593, 6-0, 85.333
178. Clawson, 592, 4-2, 46.000
179. Birch Run, 583, 3-3, 40.500
180. Dearborn Heights Robichaud ^, 573, 5-1, 71.333
181. Gladwin, 571, 4-2, 44.833
182. Freeland, 563, 6-0, 85.333
183. Portland, 563, 6-0, 89.333
184. Essexville Garber, 557, 3-3, 42.000
185. Ann Arbor Gabriel Richard, 556, 4-2, 50.767
186. Detroit University Prep, 555, 3-3, 37.500
187. Southfield Bradford Academy, 550, 4-2, 43.667
188. Ida, 548, 6-0, 85.333
189. Kingsford, 547, 4-2, 59.267
190. Marine City, 540, 3-3, 39.667
191. Muskegon Oakridge ^, 538, 5-1, 58.900
192. Algonac, 532, 6-0, 76.000
193. Frankenmuth, 529, 6-0, 80.000
194. Olivet, 524, 4-2, 53.000
195. Chesaning, 523, 3-3, 41.500
196. Detroit Henry Ford, 523, 4-2, 46.333
197. Lansing Catholic ^, 517, 5-1, 68.833
198. Almont, 513, 6-0, 73.333
199. Onsted, 509, 4-2, 41.333
200. Detroit Central Collegiate, 508, 4-2, 47.500
201. Berrien Springs, 495, 6-0, 75.238
202. Parchment, 493, 4-2, 43.667
203. Stockbridge, 493, 4-2, 53.333
204. Ovid-Elsie, 491, 4-2, 57.667
205. Reed City, 491, 6-0, 69.867
206. Dundee, 489, 3-3, 29.500
207. Grayling, 489, 4-2, 53.500
208. Standish-Sterling, 489, 3-3, 35.667
209. Clinton Township Clintondale, 486, 4-2, 59.667
210. Menominee, 480, 6-0, 84.571
211. Harper Woods, 476, 4-2, 41.333
212. Manistee ^, 469, 5-1, 58.100
213. Brooklyn Columbia Central ^, 463, 5-1, 60.833
214. Buchanan, 459, 6-0, 80.000
215. Houghton, 443, 3-3, 28.952
216. Grand Rapids West Catholic, 442, 4-2, 58.667
217. Clare, 437, 3-3, 33.000
218. Kalkaska, 437, 3-3, 33.500
219. Kingsley, 431, 3-3, 35.000
220. Harrison ^, 430, 5-1, 57.667
221. Hillsdale, 430, 4-2, 53.500
222. Pinconning, 430, 3-3, 30.333
223. Jackson Lumen Christi, 426, 4-2, 58.833
224. Warren Michigan Collegiate, 421, 4-2, 54.833
225. Calumet, 419, 4-2, 47.919
226. Lakeview, 417, 4-2, 42.000
227. Sanford Meridian Early College, 408, 6-0, 68.000
228. Michigan Center, 406, 3-3, 30.667
229. Detroit Pershing, 405, 3-3, 33.333
230. Ithaca, 402, 6-0, 76.000
231. Byron, 399, 4-2, 44.167
232. Delton Kellogg ^, 398, 5-1, 61.833
233. Millington ^, 398, 5-1, 71.500
234. Montague, 396, 6-0, 73.333
235. Burton Bendle ^, 393, 5-1, 58.167
236. Oscoda, 391, 4-2, 35.667
237. Detroit Edison Public School Academy, 390, 4-2, 37.000
238. Monroe St. Mary Catholic Central, 389, 6-0, 85.333
239. Montrose, 386, 3-3, 35.000
240. Morley Stanwood, 386, 4-2, 47.833
241. Constantine, 385, 3-3, 39.500
242. Negaunee, 385, 6-0, 68.000
243. Maple City Glen Lake, 384, 4-2, 45.167
244. Boyne City ^, 383, 5-1, 60.833
245. Niles Brandywine, 380, 4-2, 44.200
246. Adrian Madison, 379, 3-3, 32.667
247. Vassar ^, 377, 5-1, 54.000
248. Mason County Central, 376, 4-2, 50.500
249. St Louis, 374, 3-3, 33.167
250. Laingsburg ^, 373, 5-1, 46.000
251. Watervliet ^, 372, 5-1, 62.167
252. Madison Heights Madison ^, 367, 5-1, 70.167
253. Manchester ^, 365, 5-1, 52.833
254. Ravenna, 357, 3-3, 31.333
255. Schoolcraft, 357, 6-0, 73.333
256. Charlevoix, 350, 4-2, 42.500
257. Leroy Pine River, 349, 3-3, 37.500
258. Quincy, 346, 3-3, 28.667
259. Grand Rapids NorthPointe Christian, 345, 6-0, 72.000
260. St. Charles, 345, 3-3, 37.833
261. Lawton ^, 342, 5-1, 52.833
262. Vandercook Lake, 341, 6-0, 62.667
263. Clinton, 335, 6-0, 66.667
264. Lake City, 331, 3-3, 41.833
265. Traverse City St. Francis, 320, 6-0, 80.000
266. Ishpeming Westwood, 315, 3-3, 39.205
267. Hesperia, 310, 6-0, 62.667
268. Sandusky, 310, 6-0, 69.333
269. Iron Mountain, 309, 4-2, 40.300
270. McBain, 307, 4-2, 50.833
271. Hartford, 305, 3-3, 35.500
272. Cass City, 304, 4-2, 42.333
273. Bridgman ^, 303, 5-1, 48.833
274. Gobles, 301, 4-2, 47.667
275. Marlette, 298, 3-3, 32.167
276. Union City, 298, 3-3, 29.167
277. Burton Atherton, 296, 3-3, 27.333
278. Elkton-Pigeon-Bay Port Laker, 296, 3-3, 35.167
279. Wyoming Tri-unity Christian, 296, 3-3, 29.033
280. Homer ^, 294, 5-1, 56.500
281. Pewamo-Westphalia, 292, 6-0, 61.333
282. Rochester Hills Lutheran Northwest, 292, 3-3, 30.833
283. Flint Hamady ^, 291, 5-1, 51.333
284. Dansville ^, 289, 5-1, 50.167
285. Springport, 287, 3-3, 29.833
286. Saginaw Nouvel ^, 285, 5-1, 57.100
287. Riverview Gabriel Richard ^, 284, 5-1, 56.833
Drive for Detroit: Week 9 in Review
October 26, 2015
By Geoff Kimmerly
Second Half editor
Week 9 of the football regular season brings with it a Twitter feed full of gems like these:
Enjoy perfection? Northville finished 9-0 for the first time since 1961. Portland did so for the first time since 1969. Birmingham Groves posted its first flawless regular-season finish since 1978. For Buchanan, it was the first since 1988.
How about streaks? Rockford continued a 20-season playoff streak, and Stevensville Lakeshore clinched 18 years in a row heading to the postseason. And of course there was at least one stat line worth a double take – like Pewamo-Westphalia running back Jared Smith finishing the regular season with 2,065 rushing yards and 38 touchdowns for the undefeated Pirates.
Those are just highlights. As we begin to focus on the first week of the playoffs, let's not forget the rest of the best from the final week of the regular season.
Bay & Thumb
Fenton 30, Linden 27 (OT)
Fenton upped its Flint Metro League winning streak to 29 straight games and its league title streak to five seasons either sharing the championship or winning it outright thanks to this victory over second-place Linden. The Tigers ended the regular season at 8-1 while Linden is 7-2; Fenton’s lone loss came on opening night to Davison by three points. Click for more from the Flint Journal.
Also noted:
Freeland 42, Frankenmuth 7 – The Falcons (9-0) won the only matchup between undefeated teams in the state this weekend, but could see Frankenmuth (8-1) again in a Division 5 District Final.
Midland Dow 49, Midland 28 – The Chargers (8-1) won this crosstown rivalry game for the second straight season … and earned a rematch with the Chemics (7-2) in a Division 2 opener.
New Lothrop 41, Montrose 0 – The Hornets (9-0) completed their sixth straight undefeated regular season and in the process gave Montrose (5-4) a boost that helped the Rams into the playoffs as an at-large team.
Saginaw Swan Valley 28, Bay City John Glenn 21 – The Vikings (6-3) secured a fourth-straight playoff berth, but John Glenn (5-4) also made the postseason for a second straight season.
Greater Detroit
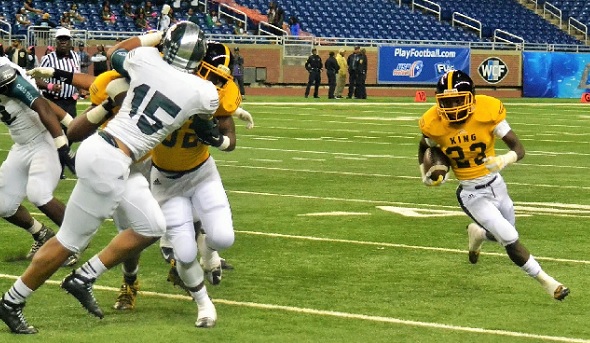
Detroit Martin Luther King 27, Detroit Cass Tech 25
It wouldn’t surprise many if both of these teams ended up back at Ford Field in five weeks playing for MHSAA titles in Division 2 and Division 1, respectively. This Detroit Public League Division I Final was their second matchup this season and both were decided by a field goal or less; King won the Sept. 25 meeting 31-28. The Crusaders (9-0) locked down Cass Tech’s passing game in this one, holding the Technicians (7-2) to their season low in points. Click for more from the Detroit Free Press.
Also noted:
Orchard Lake St. Mary's 38, Warren DeLaSalle 0 – The Eaglets (7-1) look like strong favorites in Division 3 after defeating reigning Division 2 champ DeLaSalle (6-3) big in the Prep Bowl to avenge their only loss this season.
Utica Eisenhower 17, Romeo 14 – The Eagles (6-3) are one of the state’s hottest teams, beating opponents the last three weeks that are a combined 21-6 including handing Romeo (8-1) its only loss.
Detroit Collegiate Prep 26, Detroit Central Collegiate 12 – The Colts (9-0) won the PSL Division II title game to register their first perfect regular season in at least 65 years; Central Collegiate (6-3) is headed to the playoffs for the second straight season after going 0-9 in 2013.
West Bloomfield 20, Farmington Hills Harrison 14 – The Lakers (9-0) tied their school record for wins set last season with their first perfect regular season since going 8-0 in 1960; Harrison (7-2) is headed back to the playoffs for the ninth time in 10 seasons.
Mid-Michigan
Lansing Catholic 35, Monroe St. Mary Catholic Central 10
Reigning Division 6 champion Monroe St. Mary (8-1) has looked ready for another run since putting up 62 points on Tecumseh on opening night, but Lansing Catholic (8-1) reminded the rest of Michigan it’s one of the dangerous teams in Division 5 by going on the road and handing the Falcons their first regular-season loss since 2013. The Cougars rattled off 28 unanswered points during the second half. Click for more from MLive-Lansing.
Also noted:
Portland 25, Marshall 16 – The Raiders finished 9-0 for the first time since 1969, which was a lot easier said than done considering Marshall (7-2) was one of five playoff teams on the schedule.
Harrison 40, Clare 20 – The Hornets (7-2) locked down second place in the Jack Pine Conference with their first win over Clare since 2010, and in the process kept the Pioneers (5-4) out of the playoffs for the first time since 2005.
Grand Ledge 42, Holt 0 – The Comets (9-0) completed their outright Capital Area Activities Conference Blue title, finished their third perfect regular season over the last eight and in the process kept rival Holt (5-4) from making the playoffs (although the Rams did improve from 3-6 a year ago).
Mount Pleasant Sacred Heart 13, Mendon 7 – The Irish (6-3) ran off six straight wins after opening 0-3 against teams that finished a combined 25-2 to return to the playoffs for the eighth straight season; Mendon (5-4) also earned its ninth straight postseason bid despite the loss and after starting 1-3.
Northern Lower Peninsula
Harbor Springs 22, Charlevoix 20
The winner was guaranteed a playoff spot. And Harbor Springs had plenty to celebrate with its move to 6-3 earning both the first playoff berth since 2000 but also its first winning record in 16 years. Senior Mitch Hoffman drilled a last-second field goal to put his team over the top – and keep the Red Rayders out of the playoffs as they did not end up with enough playoff points to qualify as an at-large team despite finishing 5-4. Click for more from the Petoskey News.
Also noted:
Boyne City 35, Grayling 20 – Boyne City may have finished behind Traverse City St. Francis in the Northern Michigan Football Conference Leaders standings, but beating third-place Grayling (6-3) helped the Vikings (8-1) secure up to two home playoff games – with St. Francis likely awaiting in the Regional Final.
Lake City 28, Newberry 21 – The Trojans made quite a bounce-back from last season’s 2-7 finish and beat two straight playoffs teams in Lincoln Alcona and Newberry (6-3) the last two weeks to get back to the playoffs at 5-4.
Oscoda 48, AuGres-Sims 22 – The Owls (6-3) also are back in the playoffs for the first time since 2000 after finishing the regular season with two straight wins.
Onekama 21, Frankfort 8 – Before last season, Onekama hadn’t beaten Frankfort since 1994; now, the Portagers (8-1) have won two straight over the Panthers (7-2) and could see them again in a Division 8 District Final.
Southeast & Border
Jackson 35, Jackson Lumen Christi 34 (OT)
This season just keeps getting better for Jackson. By moving to 7-2, the Vikings equaled their wins from 2010-2014 combined. And although they didn’t play most seasons in between, it’s worth noting this was Jackson’s first win over Lumen Christi since 1988 – and after 27, 29 and 34-point defeats to the Titans (6-3) the last three years. Click for more from the Jackson Citizen-Patriot.
Also noted:
Grass Lake 19, Union City 16 – The Warriors (5-4) survived a three-game losing streak midseason to earn an at-large playoff bid, and with this win knocked Union City (4-5) out of the running.
Clinton 36, Ottawa Lake Whiteford 18 – The Redskins (9-0) finished their fourth straight perfect regular season and fourth straight Tri-County Conference title by beating Whiteford (7-2), one of three other playoff teams from the league.
Manchester 45, Homer 38 – The Flying Dutchmen (8-1) claimed this meeting of first-place teams in the Cascades and Big 8 conferences for the second straight season, putting up a season high points total while also giving up their most this season to Homer (7-2).
Parma Western 28, Dexter 0 – After missing by a win twice over the last six seasons, Western (6-3) finally has its first MHSAA playoff berth thanks to two straight victories to close the regular season.
Southwest Corridor
Benton Harbor 29, Portage Northern 23 (OT)
Benton Harbor is one of the best stories of this season. The Tigers (5-4) didn’t win a game in 2013 or 2014 and went a combined 4-68 over the last eight seasons, but with a new coach and new athletic director posted their first winning season since 1989 – and earned their first playoff berth ever. It took this overtime win over Portage Northern (4-5), which hadn’t lost to Benton Harbor since 1996. Click for more from the St. Joseph Herald-Palladium.
Also noted:
Dowagiac 49, Paw Paw 46 – The Chieftains (6-3) reversed their record of a year ago but needed a second straight win by three points or fewer to return to the playoffs.
Constantine 21, Hartford 6 – The Falcons kept their playoff streak alive for a 17th straight season by bouncing back from a Week 8 loss to finish 5-4; Hartford also made the playoffs at 5-4.
St. Joseph 22, Portage Central 6 – The Bears (8-1) gained a share of the Southwestern Michigan Athletic Conference East title by breaking a three-year losing streak against the Mustangs (8-1).
Schoolcraft 41, Delton Kellogg 15 – The Eagles (9-0) finished a perfect regular season for the second time in four and won all but one of their games by at least 18 points; Delton (5-4) still made the playoffs for the first time since 2001 with its first winning record since 2009.
Upper Peninsula
Escanaba 18, Kingsford 14
Escanaba was riding high this fall after opening with two wins under a new coach. Then came four straight losses against a string of opponents that ended up including three playoff teams. But the Eskymos (5-4) didn’t fold, instead finishing with three wins including two over playoff teams to earn their first postseason berth since 2011. Kingsford (6-3) ended up with a home game this week despite the loss. Click for more from the Iron Mountain Daily News.
Also noted:
St. Ignace 14, Fowler 7 – The Saints (8-1) deserve a lot of credit for stacking their nonleague schedule with undefeated Ishpeming last week and annual Division 8 power Fowler (6-3).
Negaunee 35, Ishepming Westwood 0 – Westwood (5-4) claimed a playoff spot for a second straight season despite the loss, but Negaunee (7-2) hopes it regained some momentum after two straight defeats by a combined seven points.
Munising 41, L'Anse 8 – The reigning Division 8 runner-up Mustangs (7-2) bounced back from a Week 8 loss by ending the playoff hopes for L’Anse (5-4).
Lake Linden-Hubbell 34, Crystal Falls Forest Park 28 – The Lakes (9-0) broke a five-game losing streak against Forest Park (5-3) to finish perfect for the regular season for the first time since 2009 … and earn a rematch with Forest Park this week.
West Michigan
Rockford 28, Hudsonville 27
At stake Friday was a share of the Ottawa-Kent Conference Red title – four teams were tied for first place, guaranteeing multiple champions. But also at stake was Rockford’s 20-season playoff streak, the longest-running in Michigan and third-longest in MHSAA history. A blocked extra point by a back-up quarterback and a pair of field goals by the back-up kicker were among contributions that paid off nicely for the Rams (6-3), who could see Hudsonville (6-3) again in a Division 1 District Final. Click for more from the Grand Rapids Press.
Also noted:
Grandville 18, East Kentwood 8 – This decided the other half of the O-K Red title, with the Bulldogs (6-3) not only earning a share but posting a sixth win for the first time since 2006; East Kentwood also is 6-3 and gets also third-place Hudsonville in the playoffs.
Lowell 28, Grand Rapids Christian 14 – The Red Arrows (8-1) finished a perfect run in the O-K White for the second time in three seasons and won their fourth straight against the Eagles (5-4).
Grand Rapids Forest Hills Northern 26, Ada Forest Hills Eastern 24 – The Huskies (7-2) fell shy in the O-K Bronze after a 5-0 start, but forcing rival Forest Hills Eastern (8-1) to share the title probably lessened any lingering disappointment.
Big Rapids 20, Morley-Stanwood 10 – After seasons of three and one win over the last two, Big Rapids is back in the playoffs thanks to two straight wins, this one over a Mohawks team also 6-3.
8-Player
Battle Creek St. Philip 47, Lawrence 44
St. Philip (9-0) got the better of Lawrence for the first time in their last four meetings, handing those Tigers (7-2) their first in-state loss since 2013 and cementing the top spot overall in the 8-player tournament with the highest final playoff-point average. The two could meet again in a Regional Final next week. Click for more from the Battle Creek Enquirer.
Also noted:
Pickford 62, Onaway 28 – It was this simple: Pickford (6-3) won and got into the playoffs, and Onaway (5-4) fell out of the top 16 with the loss.
Morrice 58, Portland St. Patrick 42 – The Orioles (8-1) still aren't getting much mention as a contender, but they haven’t lost since falling to St. Philip on opening night and clinched the Central Michigan 8-Man League title with this win over the Shamrocks (6-3).
PHOTO: A Detroit Martin Luther King ball-carrier follows his blocker during the Crusaders' Detroit Public School League Division I championship win. (Photo courtesy of the Detroit Public School League.)