

2016 Week 5 Football Playoff Listing
September 19, 2016
By Geoff Kimmerly
Second Half editor
Here is a list of Michigan High School Athletic Association football playing schools, displaying their win-loss records and playoff averages through the fourth week of the season.
Schools on this list are in enrollment order for 11-player teams, with 8-player teams ordered by playoff average. An asterisk (*) beside a record indicates a team has eight or fewer games scheduled.
Those schools with 11-player teams with six or more wins playing nine-game schedules, or five or more wins playing eight games or fewer, will qualify for the MHSAA Football Playoffs beginning Oct. 28. Schools with 5-4, 4-3 or 4-4 records may qualify if the number of potential qualifiers by win total does not reach the 256 mark. Schools with six or more wins playing nine-game schedules or five or more wins playing eight games or fewer may be subtracted from the field based on playoff average if the number of potential qualifiers exceeds the 256 mark.
Once the 256 qualifying schools are determined, they will be divided by enrollment groups into eight equal divisions of 32 schools, and then drawn into regions of eight teams each and districts of four teams each. Those schools with 8-player teams will be ranked by playoff average at season’s end, and the top 16 programs will be drawn into regions of eight teams each for the playoff in that division, which also begins Oct. 28.
To review a list of all football playoff schools, individual school playoff point details and to report errors, visit the Football page of the MHSAA Website.
The announcement of the qualifiers and first-round pairings for both the 11 and 8-player playoffs will take place at 7 p.m. on Oct. 23 on the Selection Sunday Show on FOX Sports Detroit. The playoff qualifiers and pairings will be posted to the MHSAA Website following the Selection Sunday Show.
11-Player Playoff Listing
1. Utica Eisenhower, 2700, 4-0, 92.000
2. Clarkston, 2683, 3-1, 70.250
3. Grand Blanc, 2628, 4-0, 94.000
4. Howell, 2499, 3-1, 66.500
5. Dearborn Fordson, 2487, 4-0, 94.000
6. Detroit Cass Tech, 2368, 4-0, 70.000
7. Northville, 2325, 3-1, 76.750
8. Brighton, 2142, 3-1, 72.500
9. Detroit Catholic Central, 2128, 4-0, 94.000
10. Macomb L'Anse Creuse North, 1986, 4-0, 90.000
11. Dearborn, 1978, 3-1, 70.500
12. Lapeer, 1932, 3-1, 60.500
13. Saline, 1923, 4-0, 94.667
14. Bloomfield Hills, 1831, 4-0, 92.000
15. White Lake Lakeland, 1822, 4-0, 90.000
16. Grandville, 1810, 4-0, 94.000
17. Hudsonville, 1797, 3-1, 74.750
18. Warren Mott, 1768, 4-0, 90.000
19. Grand Ledge, 1694, 3-1, 68.500
20. Davison, 1668, 4-0, 84.000
21. Rochester Adams, 1666, 3-1, 66.250
22. Romeo, 1641, 3-1, 72.000
23. Walled Lake Northern, 1631, 4-0, 88.000
24. Grosse Pointe South, 1600, 4-0, 92.000
25. Temperance Bedford, 1597, 3-1, 66.750
26. Detroit Western International, 1584, 3-1, 44.750
27. Brownstown Woodhaven, 1579, 3-1, 64.750
28. Detroit East English, 1579, 3-1, 50.500
29. Livonia Churchill, 1578, 3-1, 72.250
30. Traverse City West, 1552, 3-1, 70.750
31. Warren Cousino, 1496, 3-1, 66.250
32. Detroit Martin Luther King, 1487, 4-0, 78.000
33. Detroit U-D Jesuit *, 1482, 3-1, 60.250
34. Jenison, 1481, 3-1, 64.500
35. Traverse City Central, 1394, 4-0, 96.000
36. Midland, 1388, 3-1, 60.500
37. Portage Central, 1388, 3-1, 62.750
38. Walled Lake Western, 1370, 4-0, 92.000
39. Grosse Pointe North, 1367, 3-1, 58.500
40. Battle Creek Lakeview *, 1353, 3-0, 84.000
41. Berkley, 1319, 3-1, 68.500
42. Grand Rapids Forest Hills Central, 1316, 3-1, 68.500
43. Wyandotte Roosevelt, 1311, 3-1, 66.750
44. Port Huron Northern, 1288, 3-1, 52.000
45. Wyoming, 1288, 3-1, 62.750
46. Midland Dow, 1254, 4-0, 84.000
47. Birmingham Brother Rice, 1250, 3-1, 68.400
48. Birmingham Groves, 1248, 4-0, 92.000
49. Muskegon Reeths-Puffer, 1198, 3-1, 58.250
50. Lowell, 1165, 4-0, 92.000
51. Holly, 1164, 3-1, 62.500
52. Farmington Hills Harrison, 1161, 3-1, 66.250
53. Greenville, 1142, 3-1, 70.500
54. Allen Park, 1094, 4-0, 94.000
55. Redford Thurston, 1090, 3-1, 62.500
56. Byron Center, 1070, 3-1, 62.500
57. Muskegon, 1052, 3-1, 66.500
58. Ortonville-Brandon, 1034, 3-1, 56.250
59. Detroit Cody, 1015, 3-1, 48.750
60. Mason, 1009, 3-1, 64.500
61. Zeeland East, 1007, 3-1, 58.750
62. DeWitt, 1002, 3-1, 76.500
63. St. Joseph, 989, 3-1, 68.500
64. Trenton, 969, 4-0, 90.000
65. Linden, 940, 3-1, 60.500
66. Cedar Springs, 936, 3-1, 68.500
67. Niles, 931, 3-1, 57.850
68. Coldwater, 929, 3-1, 66.250
69. Romulus, 929, 4-0, 35.333
70. Grand Rapids Christian, 912, 4-0, 88.800
71. Warren Fitzgerald, 891, 4-0, 80.000
72. New Boston Huron, 886, 3-1, 54.750
73. Battle Creek Harper Creek, 880, 4-0, 74.000
74. Chelsea, 867, 4-0, 84.000
75. Redford Union, 865, 3-1, 50.250
76. Stevensville Lakeshore, 865, 3-1, 70.500
77. Vicksburg, 861, 3-1, 54.750
78. Dearborn Divine Child, 859, 4-0, 78.000
79. Zeeland West, 857, 3-1, 70.750
80. Edwardsburg, 855, 4-0, 74.000
81. Sparta, 834, 3-1, 50.500
82. Fowlerville, 833, 3-1, 56.750
83. Cadillac, 817, 3-1, 62.250
84. Hamilton, 810, 4-0, 82.000
85. Bloomfield Hills Cranbrook Kingswood, 797, 3-1, 50.250
86. Marysville, 794, 4-0, 76.000
87. Detroit Osborn, 786, 3-1, 54.500
88. Milan, 775, 4-0, 78.000
89. Pontiac Notre Dame Prep, 749, 3-1, 72.250
90. River Rouge, 741, 3-1, 56.750
91. Three Rivers, 730, 3-1, 60.000
92. Escanaba, 722, 4-0, 90.000
93. Detroit Mumford, 714, 3-1, 50.500
94. Ludington, 695, 3-1, 46.750
95. Detroit Country Day, 692, 4-0, 70.000
96. Alma, 674, 3-1, 56.750
97. South Haven, 674, 3-1, 58.250
98. Wyoming Kelloggsville, 660, 3-1, 51.417
99. Croswell-Lexington, 659, 3-1, 58.500
100. Lake Fenton, 654, 4-0, 72.000
101. Grosse Ile, 653, 4-0, 84.000
102. Whitehall, 653, 4-0, 66.000
103. Wyoming Godwin Heights, 645, 3-1, 52.917
104. Grand Rapids Catholic Central, 644, 4-0, 84.000
105. Benton Harbor, 643, 4-0, 70.000
106. Corunna, 639, 4-0, 74.000
107. Hudsonville Unity Christian, 629, 4-0, 88.000
108. St. Clair Shores South Lake, 617, 3-1, 64.750
109. Lake Odessa Lakewood, 614, 4-0, 68.000
110. Hancock, 608, 3-1, 38.350
111. Detroit Denby, 593, 3-1, 54.500
112. Muskegon Oakridge, 590, 3-1, 40.750
113. Southfield Bradford, 587, 3-1, 52.500
114. Portland, 579, 4-0, 82.000
115. Remus Chippewa Hills, 577, 4-0, 74.000
116. Richmond, 562, 3-1, 62.750
117. Freeland, 561, 4-0, 84.000
118. Essexville Garber, 550, 3-1, 52.750
119. Algonac, 547, 4-0, 66.000
120. Ida, 546, 4-0, 68.000
121. Carrollton, 543, 3-1, 48.750
122. Kingsford, 543, 3-1, 61.200
123. Olivet, 541, 3-1, 50.750
124. Harper Woods, 540, 3-1, 52.250
125. Frankenmuth, 533, 4-0, 70.000
126. Lansing Catholic, 532, 3-1, 66.750
127. Grant, 520, 3-1, 46.750
128. Kalkaska, 517, 4-0, 60.000
129. Reed City, 496, 4-0, 72.000
130. Grayling, 492, 3-1, 52.750
131. Stockbridge, 482, 3-1, 52.750
132. Grand Rapids West Catholic, 475, 3-1, 46.500
133. Durand, 463, 4-0, 56.000
134. Parchment, 448, 3-1, 38.250
135. Menominee, 439, 4-0, 71.600
136. Ithaca, 426, 4-0, 72.000
137. Clare, 419, 3-1, 50.750
138. Montague, 414, 4-0, 62.000
139. Houghton, 412, 3-1, 38.500
140. Tawas *, 412, 3-1, 40.500
141. Calumet, 406, 3-1, 50.750
142. Morley Stanwood, 404, 3-1, 48.500
143. Negaunee, 400, 4-0, 66.000
144. Warren Michigan Collegiate, 398, 3-1, 56.500
145. Adrian Madison, 397, 3-1, 48.750
146. Charlevoix, 393, 4-0, 54.000
147. Millington, 393, 4-0, 72.000
148. Constantine, 386, 3-1, 48.750
149. Montrose, 386, 3-1, 52.500
150. Byron, 385, 3-1, 46.250
151. Quincy, 381, 4-0, 50.000
152. Watervliet, 380, 3-1, 48.750
153. Maple City Glen Lake, 379, 3-1, 46.750
154. Houghton Lake, 374, 3-1, 48.750
155. Laingsburg, 374, 4-0, 58.000
156. Roscommon, 367, 4-0, 70.000
157. Grass Lake, 363, 4-0, 68.000
158. Kent City, 362, 3-1, 46.500
159. Schoolcraft, 358, 4-0, 58.000
160. Oscoda, 352, 3-1, 44.500
161. Ravenna, 350, 3-1, 46.750
162. Leroy Pine River, 347, 3-1, 52.750
163. Madison Heights Madison, 343, 3-1, 64.500
164. Traverse City St. Francis, 341, 4-0, 70.000
165. Lawton, 333, 4-0, 52.000
166. Clinton, 331, 4-0, 62.000
167. Grand Rapids NorthPointe Christian, 330, 3-1, 40.250
168. Reese, 328, 3-1, 46.750
169. McBain, 326, 3-1, 54.500
170. Riverview Gabriel Richard, 320, 3-1, 50.500
171. Bridgman, 312, 3-1, 42.250
172. Iron Mountain, 302, 3-1, 52.083
173. New Lothrop, 298, 4-0, 58.000
174. Gobles, 289, 4-0, 60.000
175. Saugatuck, 289, 4-0, 0.000
176. Pewamo-Westphalia, 288, 4-0, 62.000
177. Gwinn, 287, 3-1, 42.500
178. Cassopolis, 278, 4-0, 60.667
179. Grosse Pointe Woods University Liggett, 277, 4-0, 62.000
180. Elkton-Pigeon-Bay Port Laker, 274, 4-0, 56.000
181. Carson City-Crystal, 268, 3-1, 34.000
182. Sand Creek, 268, 4-0, 48.000
183. Hudson, 267, 4-0, 66.000
184. Unionville-Sebewaing, 267, 3-1, 10.444
185. Detroit Loyola, 266, 3-1, 52.250
186. East Jordan, 261, 3-1, 34.500
187. Ubly, 260, 4-0, 62.000
188. Springport, 259, 4-0, 52.000
189. Concord, 258, 4-0, 52.000
190. Onekama, 254, 3-1, 30.500
191. Whittemore-Prescott, 251, 3-1, 44.500
192. Royal Oak Shrine Catholic, 249, 3-1, 52.500
193. Saginaw Nouvel, 248, 3-1, 54.750
194. Lincoln Alcona, 245, 3-1, 34.500
195. Evart, 242, 3-1, 44.500
196. Ottawa Lake Whiteford, 242, 4-0, 58.000
197. Breckenridge, 235, 4-0, 48.000
198. St. Joseph Lake Michigan Catholic, 232, 4-0, 50.000
199. Melvindale Academy for Business & Tech, 224, 3-1, 44.250
200. St. Ignace, 219, 3-1, 46.750
201. Norway, 214, 4-0, 41.200
202. Newberry, 212, 4-0, 50.000
203. AuGres-Sims, 206, 3-1, 38.500
204. Saginaw Michigan Lutheran Seminary, 200, 3-1, 48.250
205. Vestaburg, 195, 4-0, 50.000
206. Merrill, 191, 3-1, 32.000
207. Fowler, 185, 3-1, 38.250
208. Frankfort, 171, 4-0, 48.000
209. Gaylord St. Mary, 170, 4-0, 42.000
210. Climax-Scotts, 169, 4-0, 52.000
211. Muskegon Catholic Central, 163, 4-0, 78.000
212. Lake Linden-Hubbell, 157, 4-0, 60.800
213. Colon, 156, 3-1, 34.750
214. Clarkston Everest Collegiate, 115, 4-0, 54.000
8-Player Playoff Listing
1. Powers North Central, 115, 4-0, 48.800
2. Deckerville *, 177, 4-0, 48.000
3. Cedarville, 156, 4-0, 48.000
4. New Haven Merritt Academy, 165, 4-0, 46.000
5. Engadine, 91, 4-0, 44.000
6. Portland St. Patrick, 92, 4-0, 42.667
7. Lawrence, 186, 4-0, 42.000
8. Owendale-Gagetown, 48, 4-0, 42.000
9. Crystal Falls Forest Park, 159, 3-1, 38.750
10. Peck, 143, 3-1, 36.750
11. Rapid River, 116, 3-1, 36.500
12. Wyoming Tri-unity Christian, 168, 4-0, 36.000
13. Camden-Frontier *, 159, 3-0, 34.667
14. Battle Creek St. Philip, 143, 4-0, 34.000
15. Stephenson, 177, 3-1, 31.700
16. Marion, 132, 3-1, 31.167
17. Waldron, 83, 3-1, 29.417
18. Pickford, 149, 3-1, 28.750
19. Hale, 129, 3-1, 28.750
20. Fife Lake Forest Area, 162, 3-1, 27.417
21. Webberville, 178, 3-1, 27.167
22. Posen, 94, 2-2, 21.917
23. Morrice, 168, 2-2, 21.500
24. Mayville, 196, 2-2, 21.250
25. Ontonagon, 126, 2-2, 21.250
26. Flint International Academy, 185, 2-2, 19.500
27. Onaway, 190, 2-2, 17.500
28. Tekonsha, 135, 1-3, 14.583
29. Brethren, 152, 1-3, 13.667
30. Carney-Nadeau *, 140, 1-2, 12.667
31. Caseville, 98, 1-3, 12.000
32. Eben Junction Superior Central, 125, 1-3, 11.917
33. Flint Michigan School for the Deaf *, 47, 1-2, 11.583
34. Baraga, 150, 1-3, 11.417
35. Ewen-Trout Creek, 115, 1-3, 11.250
36. Burr Oak, 72, 1-3, 11.167
37. Bellaire, 133, 1-3, 9.750
38. St. Joseph Michigan Lutheran, 97, 1-3, 9.750
39. Burton Madison Academy, 198, 1-3, 9.500
40. St. Helen Charlton Heston Academy, 137, 1-3, 9.500
41. Carsonville-Port Sanilac, 118, 1-3, 9.500
42. Manistee Catholic Central, 189, 1-3, 9.000
43. Pellston, 169, 0-4, 2.000
44. Covert *, 95, 0-4, 2.000
45. Kinde-North Huron, 157, 0-4, 1.750
46. Litchfield, 85, 0-4, 1.500
47. Akron-Fairgrove, 105, 0-4, 0.750
48. Big Rapids Crossroads Academy, 193, 0-4, 0.500
Drive for Detroit: Week 9 in Review
October 23, 2017
By Geoff Kimmerly
Second Half editor
By now, you know which teams made the playoffs, what the first-round matchups look like and what the roads will be for your favorites to arrive at either the Superior Dome or Ford Field next month.
 But a lot was still undecided heading into Week 9 – in fact, nearly one third of the playoff berths were still up for grabs.
So as we’ve done each Monday since mid-August, our “Drive for Detroit” – powered by MI Student Aid – will give you 45 glimpses below into how we got to this point.
Bay & Thumb
Lapeer 35, Flint Carman-Ainsworth 23
With both 5-3 entering the weekend, a win would guarantee the victor a playoff berth. In the end, both teams qualified, but Carman-Ainsworth had to wait a little longer to find out its season would go on. Lapeer has made the playoffs all four years since the former West and East high schools merged into one. Carman-Ainsworth made the playoffs as an at-large qualifier for the second straight year, no doubt helped that its losses this fall came to to Grand Blanc, Davison, Midland Dow and Lapeer (which are a combined 28-8). Click for more from the Lapeer County Press.
It’s a playoff like atmosphere tonight at Lapeer! The Lightning & Carman-Ainsworth each needing a win to make postseason pic.twitter.com/28lM2qUmRN
— Jason Lewis (@JasonLewis_TV) October 20, 2017
Also noted:
Bridgeport 54, Chesaning 31 – The Bearcats (6-3) have as many wins as the last three seasons combined and earned their first playoff berth since 1999; Chesaning (4-5) missed the playoffs but did double its win total from a year ago.
Frankenmuth 20, Freeland 7 – After missing perfect regular seasons the last two because of losses to Freeland (6-3), Frankenmuth (9-0) got past its nemesis and ended up with the highest playoff point average in Division 5.
Midland 49, Midland Dow 21 – The Chemics (8-1) broke a four-game losing streak to rival Dow (7-2), in doing so doubling their win total from a year ago.
Lake Fenton 35, Williamston 28 – The Blue Devils (8-1) staved off their most challenging opponent since a Week 1 loss to New Lothrop … and earned the opportunity to face Williamston (5-4) again this week in a Division 4 opener.
Greater Detroit
Detroit Martin Luther King 21, Detroit East English 0
King completed its second Detroit Public School overall title run in three seasons with this win in the PSL A final at Ford Field. The Crusaders also made it eight straight victories over East English (8-1), which hadn’t been shut out since 2013. King, the two-time reigning MHSAA Division 2 champion, finished the regular season 8-1 with its only loss to Toledo Central Catholic (which also is 8-1). Click for more from MLive-Detroit.
Also noted:
Warren DeLaSalle 35, Detroit Catholic Central 14 – The Pilots (7-2) beat Detroit Catholic Central (5-4) in Week 8 to clinch the Catholic League Central title, and then again Saturday for the A-B championship.
Detroit Central 40, Detroit Denby 0 – After opening the Detroit Public School League Black schedule with a 12-6 loss to Denby (6-2), Central (7-2) avenged in a big way in Friday’s PSL B championship game.
Waterford Mott 42, Fenton 28 – The Corsairs (8-1) reached eight wins for the first time since 1973 by handing Fenton (8-1) its lone loss of the regular season.
Canton 35, Livonia Churchill 21 – The overall Kensington Lakes Activities Association championship went to the Chiefs (8-1), who have won eight straight and swept the KLAA Black; Churchill (7-2) swept the Red to reach this final.
Mid-Michigan
Clare 38, Beaverton 14
Clare continues to own the Jack Pine Conference. Both of these teams entered the regular-season finale undefeated in league play – Beaverton undefeated overall as well – but the Pioneers (8-1) emerged with a big win to claim their 10th league title in 11 seasons and run their league winning streak back up to 14 straight games. The Beavers (8-1) do still have their best record since 1970, and home-field advantage this week and should they advance to a Division 7 District Final. Click for more from the Mount Pleasant Morning Sun.
Also noted:
Ithaca 38, Carrollton 6 – It becomes easy to take for granted after so many years, but Ithaca (9-0) completed its eighth straight perfect regular season by downing playoff qualifier Carrollton (6-3); the Yellowjackets’ only losses since the start of 2010 were in the 2014 Division 6 Final and in a Division 5 Regional Final last season.
East Lansing 21, Okemos 7 – The Trojans (7-2) have come back from a 1-2 start to earn a home playoff game, while this victory kept Okemos (5-4) out of the postseason; the Chiefs still finished with more wins than their last two seasons combined.
Middleville Thornapple Kellogg 24, Grand Rapids Christian 20 – In easily one of the most massive upsets of the regular season, Middleville TK (2-7) won for the first time since opening night and avenged last season’s 54-0 loss to the Eagles (7-2).
Ovid-Elsie 23, Richmond 14 – The Marauders (7-2) continued their bounce-back from 4-5 a year ago with what likely would be considered an upset of the Blue Water Area Conference runner-up Blue Devils (7-2).
Northern Lower Peninsula
Boyne City 19, Traverse City St. Francis 13
Arguably the most dramatic play statewide this weekend gave Boyne City the go-ahead points during the final minute (click the link below for more). The Ramblers (9-0) broke a three-game losing streak against the rival Gladiators and clinched the Northern Michigan Football League Legends championship outright. Boyne City also completed its second perfect regular season in four years, its 19 points only the second-most St. Francis (8-1) has given up this season. Defense certainly prevailed – the Rambers’ 19 also tied their second-fewest scored this season. Click for more from the Petoskey News-Review.
Also noted:
Johannesburg-Lewiston 50, Harbor Springs 8 – The Cardinals (6-3) clinched a playoff berth after missing last season for the first time in six; Harbor Springs (4-5) fell shy of an at-large opportunity.
Grayling 50, Kalkaska 33 – The Vikings (6-3) clinched a third straight playoff berth and eighth in nine seasons, while Kalkaska also (4-5) missed out on a chance at an at-large bid.
Hillman 58, Indian River Inland Lakes 8 – The Tigers (5-4) got the needed win to extend their playoff streak to 12 straight seasons; Inland Lakes (2-7) did take a step this fall after going winless in 2016.
AuGres-Sims 50, Adrian Lenawee Christian 6 – The Wolverines (8-0) capped their first perfect regular season since 2006 and with a big win over another playoff team in Lenawee Christian (6-3), which qualified after missing the postseason in 2016.
Southeast & Border
Michigan Center 45, Reading 43
Michigan Center also has the argument for the most dramatic play of the weekend, scoring during the final minute to cap a fourth-quarter comeback and beat Reading in the crossover of champions from the Cascades and Big 8 conferences, respectively. The Rangers (7-2) suffered their first loss since Week 1 but still have more victories this season than the last two combined. Michigan Center (8-1) needs one more win to tie its program record. Click for more from the Jackson Citizen Patriot.
The Captains in tonight’s Cascades/Big 8 Conference Championship! Michigan Center hosts Reading! @JTV_Sports pic.twitter.com/WeVFL7TNPB
— Josh Burgett (@jburgett34) October 20, 2017
Also noted:
Union City 44, Addison 20 – The Chargers (7-2) have rebounded from two straight sub-.500 finishes to tie for second in the Big 8 Conference and earn this win over Cascades co-champion Addison (7-2).
Hudson 54, Blissfield 8 – The Tigers (8-1) locked up the Lenawee County Athletic Association championship, made more impressive as Blissfield (5-4) was one of six teams in the league, out of eight, to finish with overall winning records in the regular season.
Hillsdale 17, Brooklyn Columbia Central 10 – The Hornets (5-4) closed with three straight wins over playoff teams to earn an at-large berth after missing last season for the first time in 16; Columbia Central (6-3) is headed to the postseason for the third straight season.
Morenci 40, Petersburg Summerfield 28 – After opening this season 0-2, Morenci (6-3) won all but one of their Tri-County Conference games to finish second and secure their fourth straight playoff berth; Summerfield (6-3) finished third in the league and also qualified for the fourth straight season.
Southwest Corridor
Vicksburg 30, Three Rivers 20
Vicksburg (7-2) had only an outside chance Friday of gaining a share of the Wolverine B Conference championship. But the Bulldogs could prevent rival Three Rivers from claiming part of the league title – and this 30-20 win gave the outright championship to Edwardsburg, while Vicksburg, Three Rivers and Plainwell ended up tied for second place. Three Rivers (7-2) will have to wait only six days for a chance at vengeance; emotions surely will be running high when these two meet again in a Division 4 District opener Friday. Click for more from JoeInsider.com.
Also noted:
Coldwater 24, Traverse City West 9 – The Cardinals (6-3) took a long trip north needing a win to earn a fifth straight playoff appearance, and got it by holding the Titans (8-1) to 20 fewer points than they’d scored in any game over the first eight.
Dowagiac 21, Paw Paw 12 – The Chieftains (6-3) needed a third straight win over Paw Paw (4-5) to make the playoffs for the third straight year, and in the process took an at-large opportunity away from the Redskins.
Delton Kellogg 40, Constantine 7 – The Panthers (5-4) got what they needed to earn an at-large playoff bid for the second time in three seasons, and one more win would tie their most since 2001; Constantine (3-6) saw an 18-year playoff streak come to an end.
Battle Creek Pennfield 28, Olivet 21 – The Panthers (4-5) didn’t make the playoffs and were out of consideration after Week 8, but they rallied to give Olivet (8-1) its first loss.
Upper Peninsula
Kingsford 21, Escanaba 14
First a few weeks ago, it looked like Escanaba/Gladstone might be the matchup of the best in the Upper Peninsula. After the Eskymos won that game, Kingsford (6-2) emerged from an early schedule of Wisconsin opponents to become the next challenger. So it’s fair to call the Flivvers the best above the bridge after it finished a perfect run through the Great Northern Conference while suffering its only loss this season to Menasha, Wis., in Week 1. Escanaba (7-2) could host up to two playoff games, however, and its losses were by a combined 14 points. Kingsford is in line to host up to three playoff games. Click for more from the Iron Mountain Daily News.
Also noted:
Calumet 20, Gladstone 16 – The Copper Kings (6-3) needed a win to guarantee a fourth straight playoff appearance and 12th in 13 seasons, and had to get it against a Gladstone team that at 7-2 is enjoying its first winning season since 2009 and first playoff season since 2008.
Ishpeming Westwood 30, Negaunee 14 – The Patriots (8-1) set a program single-season record for wins and after going only 2-7 a year ago; in the process they also helped end Negaunee’s five-year playoff streak as the Miners finished 4-5.
Menominee 34, Marquette 17 – The Maroons (6-3) earned their 22nd straight playoff berth, good to tie for second-longest streak all-time, but only by getting past the rival Redmen (4-5) as they sought an at-large opportunity.
Hancock 21, Houghton 0 – The win over Houghton (1-8) wasn’t a huge surprise, but Hancock (7-2) obviously should celebrate its first playoff berth since 2006.
West Michigan
Montague 34, Muskegon Catholic Central 10
This meeting of league champions – Montague from the West Michigan Conference and MCC (7-1) from the Lakes 8 – was anticipated as well because both were undefeated and both are potential MHSAA champions, MCC in Division 8 and Montague in Division 6. This meeting was the first between the two Muskegon-area powers, and the Wildcats (9-0) were able to finish off a second perfect regular season in three years and end MCC’s 27-game winning streak. Click for more from the Local Sports Journal.
Also noted:
Holland West Ottawa 34, Grandville 18 – In the end, what looked a few weeks ago like an unpredictable Ottawa-Kent Conference Red race turned into an outright championship for West Ottawa (8-1); the title had been split three straight seasons, and a Grandville win would’ve earned the Bulldogs and Rockford shares.
Zeeland East 28, Zeeland West 8 – East (9-0) completed a perfect regular season for the first time since 2012 and claimed the outright O-K Green title, the Chix’ first league title since winning the O-K Black also in 2012. But East also must see West (6-3) again immediately in a Division 3 opener.
East Grand Rapids 13, Grand Rapids South Christian 7 – The Sailors (7-2) also had a chance to turn the O-K Gold into a three-team title share, but East Grand Rapids (9-0) held on not just for the outright championship but its first perfect regular season since 2010.
Fennville 40, Saugatuck 7 – Fennville (5-4) fell shy of the playoffs and Saugatuck (6-3) will play on, but this win gave the Blackhawks the outright Southwestern Athletic Conference Lakeshore title with one more league win than the Indians.
8-Player
Kinde-North Huron 56, Bay City All Saints 46
North Huron (8-1) finished its North Central Thumb League Stripes championship run against All Saints, who were tied with the Warriors for first place entering the weekend. It’s been an incredible turnaround for North Huron, which was 2-7 a year ago and last won a league title in 2006 (sharing it that year with Kingston). These teams could meet again; North Huron is home in their shared Division 2 Regional and All Saints (6-3) will open on the road at Marion. Click for more from the Huron Daily Tribune.
Also noted:
Pickford 53, Rudyard 14 – The Panthers (9-0) held off Rudyard’s attempt at creating a shared Bridge Alliance title, as the Bulldogs (7-2) instead fell into a three-way tie for second.
Bellaire 42, Onaway 20 – Although Onaway finished only 3-6, this was a key game because it was Bellaire’s fourth straight win and likely the playoff clincher after a 1-4 start to this season.
Powers North Central 32, Stephenson 20 – After the reigning MHSAA champion Jets (6-2) started 1-2, things looked dim; in retrospect, those losses were by only a combined 10 points and this win over Stephenson (7-2) was their fifth straight.
Eben Junction Superior Central 46, Rapid River 22 – Superior Central (4-5) fell short of the playoffs but closed with three straight wins for the second straight season, and this time dealt Western Eight Conference champion Rapid River (7-2) its only league loss.
Second Half’s weekly “Drive for Detroit” previews and reviews are powered by MI Student Aid, a part of the Student Financial Services Bureau located within the Michigan Department of Treasury. MI Student Aid encourages students to pursue postsecondary education by providing access to student financial resources and information, including various student financial assistance programs to help make college more affordable for Michigan students. MI Student Aid administers the state’s 529 savings programs (MET/MESP) and eight additional aid programs within its Student Scholarships and Grants division. Click for more information and connect with MI Student Aid on Facebook and Twitter @mistudentaid.
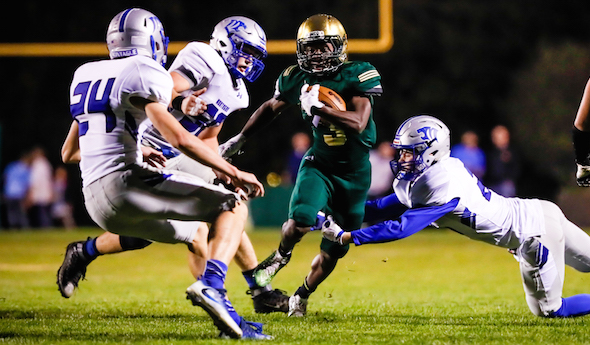
PHOTO: Montague, here on defense surrounding a ball carrier, won a meeting of undefeated teams Friday in its first game ever against Muskegon Catholic Central. (Photo by Tim Reilly.)