

2018 Week 5 Football Playoff Listing
September 18, 2018
By Geoff Kimmerly
Second Half editor
Here is a list of Michigan High School Athletic Association football playing schools, displaying their win-loss records and playoff averages through the fourth week of the season.
Schools on this list are in enrollment order for 11-player teams, with 8-player teams ordered by playoff average. An asterisk (*) beside a record indicates a team has eight or fewer games scheduled.
Those schools with 11-player teams with six or more wins playing nine-game schedules, or five or more wins playing eight games or fewer, will qualify for the MHSAA Football Playoffs beginning Oct. 26. Schools with 5-4, 4-3 or 4-4 records may qualify if the number of potential qualifiers by win total does not reach the 256 mark. Schools with six or more wins playing nine-game schedules or five or more wins playing eight games or fewer may be subtracted from the field based on playoff average if the number of potential qualifiers exceeds the 256 mark.
Once the 256 qualifying schools are determined, they will be divided by enrollment groups into eight equal divisions of 32 schools, and then drawn into regions of eight teams each and districts of four teams each. Those schools with 8-player teams will be ranked by playoff average at season’s end, and the top 32 programs will then be divided into two divisions of 16 each based on enrollment. The playoff in that division also begins Oct. 26.
To review a list of all football playoff schools, individual school playoff point details and to report errors, visit the Football page of the MHSAA Website.
The announcement of the qualifiers and first-round pairings for both the 11 and 8-player playoffs will take place Oct. 21 on the Selection Sunday Show on FOX Sports Detroit. The playoff qualifiers and pairings will be posted to the MHSAA Website following the Selection Sunday Show.
11-Player Playoff Listing
1. Macomb Dakota, 3114, 4-0, 90.000
2. Dearborn Fordson, 2795, 4-0, 88.000
3. East Kentwood, 2651, 3-1, 70.750
4. Grand Blanc, 2637, 4-0, 94.000
5. Clarkston, 2548, 4-0, 96.000
6. Clinton Township Chippewa Valley, 2462, 4-0, 98.000
7. Detroit Cass Tech, 2432, 4-0, 90.000
8. Canton, 2260, 3-1, 68.250
9. Brighton, 2202, 3-1, 70.750
10. Holland West Ottawa, 2190, 3-1, 66.500
11. Oxford, 2170, 3-1, 74.500
12. Ann Arbor Pioneer, 2115, 3-1, 80.667
13. Detroit Catholic Central, 2020, 3-1, 76.750
14. West Bloomfield, 2005, 3-1, 72.750
15. Macomb L'Anse Creuse North, 1994, 3-1, 66.500
16. Monroe, 1949, 3-1, 69.550
17. Hudsonville, 1879, 4-0, 90.667
18. Saline, 1834, 3-1, 70.750
19. Romeo, 1779, 3-1, 72.500
20. Detroit Western International, 1773, 3-1, 54.750
21. Lapeer, 1772, 4-0, 86.000
22. Davison, 1687, 4-0, 88.000
23. Belleville, 1642, 4-0, 98.000
24. Brownstown Woodhaven, 1628, 4-0, 94.000
25. Grosse Pointe South, 1593, 4-0, 92.000
26. Warren Mott, 1585, 3-1, 72.750
27. Waterford Mott, 1558, 3-1, 66.500
28. Warren DeLaSalle, 1474, 3-1, 66.750
29. Jenison, 1464, 3-1, 64.250
30. Livonia Franklin, 1443, 3-1, 64.000
31. Dearborn Heights Crestwood, 1424, 4-0, 76.000
32. Traverse City Central, 1391, 3-1, 70.250
33. Birmingham Seaholm, 1376, 3-1, 68.750
34. Oak Park, 1349, 4-0, 90.000
35. Portage Central, 1349, 3-1, 70.250
36. Roseville, 1303, 3-1, 56.750
37. Port Huron Northern, 1295, 3-1, 70.500
38. St. Clair Shores Lake Shore, 1276, 3-1, 64.500
39. Swartz Creek, 1262, 4-0, 92.000
40. Walled Lake Western, 1258, 3-1, 66.500
41. Jackson, 1229, 4-0, 88.000
42. Ypsilanti Lincoln, 1226, 3-1, 56.500
43. South Lyon, 1225, 4-0, 92.000
44. Muskegon Mona Shores, 1215, 4-0, 90.000
45. Birmingham Brother Rice, 1168, 3-1, 73.567
46. Fenton, 1160, 3-1, 68.500
47. Mattawan, 1153, 3-1, 64.250
48. Detroit Martin Luther King, 1149, 3-1, 54.750
49. Warren Woods Tower, 1126, 4-0, 78.000
50. Auburn Hills Avondale, 1115, 3-1, 64.250
51. Gibraltar Carlson, 1114, 3-1, 70.750
52. East Lansing, 1111, 4-0, 88.667
53. Farmington, 1111, 4-0, 90.000
54. Allen Park, 1105, 3-1, 68.500
55. Garden City, 1080, 3-1, 62.000
56. South Lyon East, 1063, 3-1, 64.500
57. Mt. Pleasant, 1053, 4-0, 84.000
58. Muskegon, 1022, 4-0, 98.000
59. Battle Creek Central, 1014, 3-1, 66.500
60. Gaylord, 1002, 4-0, 80.000
61. DeWitt, 1001, 4-0, 94.000
62. Zeeland West, 997, 3-1, 68.500
63. Cedar Springs, 992, 3-1, 68.750
64. Zeeland East, 955, 3-1, 58.500
65. Detroit Mumford, 943, 3-1, 60.500
66. Trenton, 914, 3-1, 70.500
67. Riverview, 913, 3-1, 58.500
68. Middleville Thornapple Kellogg, 903, 4-0, 80.000
69. River Rouge, 897, 3-1, 58.750
70. Haslett, 895, 4-0, 84.000
71. Ortonville-Brandon, 887, 3-1, 70.250
72. Grand Rapids Christian, 886, 3-1, 66.750
73. Parma Western, 870, 3-1, 56.750
74. Chelsea, 851, 3-1, 70.500
75. Farmington Hills Harrison, 849, 3-1, 66.750
76. Spring Lake, 845, 4-0, 74.000
77. Edwardsburg, 838, 4-0, 76.000
78. Wayland Union, 829, 3-1, 64.750
79. Plainwell, 825, 3-1, 52.750
80. Bloomfield Hills Cranbrook Kingswood, 809, 3-1, 62.917
81. Milan, 761, 3-1, 54.500
82. Goodrich, 758, 3-1, 62.500
83. Detroit Cody, 755, 4-0, 84.000
84. Allendale, 749, 3-1, 56.750
85. North Branch, 726, 3-1, 52.750
86. Croswell-Lexington, 724, 3-1, 56.500
87. Battle Creek Pennfield, 709, 3-1, 62.500
88. Pontiac Notre Dame Prep, 702, 3-1, 52.500
89. Detroit Country Day *, 687, 3-1, 67.050
90. Three Rivers, 682, 4-0, 82.000
91. Holland Christian, 672, 3-1, 58.750
92. Paw Paw, 670, 3-1, 56.750
93. Whitehall, 669, 3-1, 50.750
94. Grand Rapids Catholic Central, 662, 3-1, 54.500
95. Alma, 643, 4-0, 68.000
96. Lake Odessa Lakewood, 643, 3-1, 62.500
97. Williamston, 619, 3-1, 62.250
98. Grand Rapids South Christian, 615, 3-1, 63.167
99. Grosse Ile, 609, 4-0, 74.000
100. Dearborn Heights Robichaud, 608, 4-0, 74.000
101. Hudsonville Unity Christian, 602, 4-0, 86.000
102. Harper Woods, 594, 3-1, 44.750
103. Freeland, 584, 3-1, 52.750
104. Saginaw Swan Valley, 573, 4-0, 90.000
105. Belding, 572, 3-1, 54.500
106. Muskegon Oakridge, 571, 4-0, 68.000
107. Macomb Lutheran North, 560, 4-0, 70.000
108. Birch Run, 552, 3-1, 58.500
109. St. Clair Shores South Lake, 551, 3-1, 50.500
110. Portland, 550, 4-0, 74.000
111. Frankenmuth, 549, 3-1, 60.750
112. Olivet, 542, 4-0, 72.000
113. Detroit Osborn, 537, 3-1, 44.750
114. Lansing Catholic, 531, 4-0, 70.000
115. Richmond, 524, 3-1, 56.000
116. Ida, 512, 3-1, 58.500
117. Hopkins, 507, 3-1, 58.750
118. Benzie Central, 505, 3-1, 52.750
119. Detroit Denby, 504, 4-0, 66.667
120. Reed City, 504, 4-0, 80.000
121. Almont, 503, 4-0, 68.000
122. Marine City, 503, 3-1, 56.750
123. Berrien Springs, 500, 3-1, 54.750
124. Dundee, 485, 3-1, 52.500
125. Manistee, 472, 4-0, 64.000
126. Durand, 468, 3-1, 46.250
127. Coloma, 460, 3-1, 48.500
128. Ovid-Elsie, 453, 3-1, 50.750
129. Kalamazoo Hackett, 450, 4-0, 66.000
130. Clare, 449, 3-1, 48.500
131. Montague, 445, 3-1, 42.750
132. Kingsley, 443, 3-1, 54.750
133. Hillsdale, 441, 4-0, 66.000
134. Tawas *, 418, 3-1, 38.750
135. Michigan Center, 412, 4-0, 56.000
136. Brooklyn Columbia Central, 410, 3-1, 58.500
137. Constantine, 400, 4-0, 64.000
138. Fennville, 400, 3-1, 48.750
139. Calumet, 392, 4-0, 70.800
140. Warren Michigan Collegiate, 392, 4-0, 74.000
141. Ishpeming Westwood, 391, 2-2, 37.417
142. Millington, 390, 3-1, 54.000
143. Ithaca, 388, 3-1, 50.750
144. Ecorse, 387, 3-1, 46.750
145. Blissfield, 383, 3-1, 60.750
146. Delton Kellogg, 378, 4-0, 68.000
147. Hemlock, 374, 3-1, 42.500
148. Morley Stanwood, 369, 3-1, 48.250
149. Elk Rapids, 366, 3-1, 42.500
150. Napoleon, 365, 3-1, 42.500
151. Beaverton, 362, 3-1, 46.750
152. Grass Lake, 357, 4-0, 56.000
153. Jackson Lumen Christi *, 356, 4-0, 84.000
154. Traverse City St. Francis, 355, 4-0, 84.000
155. Flint Hamady, 353, 4-0, 58.000
156. Schoolcraft, 353, 3-1, 50.500
157. Kent City, 351, 4-0, 58.000
158. Lake City, 348, 4-0, 64.000
159. Leroy Pine River, 348, 4-0, 56.000
160. L'Anse, 344, 3-1, 48.250
161. Ravenna, 344, 3-1, 40.500
162. Grand Rapids NorthPointe Christian, 332, 3-1, 42.500
163. Monroe St. Mary Catholic Central, 331, 3-1, 63.167
164. St. Louis, 331, 3-1, 48.500
165. Oscoda, 329, 3-1, 28.000
166. Hartford, 322, 4-0, 52.000
167. Roscommon, 319, 3-1, 58.500
168. Madison Heights Madison, 316, 4-0, 80.000
169. Pewamo-Westphalia, 315, 4-0, 56.000
170. Clinton, 313, 3-1, 42.500
171. Detroit Community, 308, 4-0, 48.000
172. Madison Heights Bishop Foley, 306, 3-1, 48.750
173. New Lothrop, 302, 4-0, 66.000
174. Springport, 302, 4-0, 54.000
175. Allen Park Cabrini, 300, 3-1, 42.750
176. Sandusky, 300, 4-0, 62.000
177. Iron Mountain, 298, 3-1, 54.400
178. Cass City, 291, 3-1, 48.250
179. Elkton-Pigeon-Bay Port Laker, 282, 3-1, 48.500
180. Harbor Springs, 280, 4-0, 50.000
181. Manton, 280, 3-1, 42.750
182. Centreville, 279, 4-0, 56.000
183. Saugatuck, 273, 3-1, 50.500
184. Sand Creek, 266, 3-1, 37.417
185. Cassopolis, 261, 4-0, 56.000
186. Concord, 255, 3-1, 42.750
187. Royal Oak Shrine Catholic, 252, 3-1, 40.250
188. Ottawa Lake Whiteford, 250, 4-0, 58.000
189. Carson City-Crystal, 248, 4-0, 46.000
190. Gwinn, 246, 4-0, 54.000
191. Iron River West Iron County, 246, 3-1, 40.750
192. Dansville, 244, 3-1, 42.000
193. Reading, 244, 4-0, 66.000
194. Holton, 234, 3-1, 42.500
195. Ishpeming, 233, 4-0, 52.800
196. Ubly, 232, 3-1, 44.750
197. Johannesburg-Lewiston, 226, 3-1, 42.500
198. Breckenridge, 224, 4-0, 60.000
199. Harbor Beach, 222, 3-1, 44.250
200. Rogers City, 220, 4-0, 56.000
201. Sterling Heights Parkway Christian, 220, 4-0, 52.000
202. Detroit Public Safety Academy, 206, 3-1, 37.167
203. Mendon, 193, 3-1, 32.750
204. Saginaw Michigan Lutheran Seminary, 193, 4-0, 50.000
205. Pittsford, 186, 4-0, 52.000
206. Athens *, 185, 3-0, 57.333
207. Adrian Lenawee Christian, 183, 4-0, 52.000
208. Martin, 183, 3-1, 40.000
209. Fowler, 170, 3-1, 36.750
210. Clarkston Everest Collegiate, 115, 4-0, 51.333
8-Player Playoff Listing
1. Colon, 162, 4-0, 50.000
2. Pickford, 156, 4-0, 48.000
3. Onekama, 131, 4-0, 46.667
4. Morrice, 182, 4-0, 46.000
5. AuGres-Sims, 160, 4-0, 44.000
6. Posen, 78, 4-0, 42.000
7. Wyoming Tri-unity Christian, 173, 4-0, 40.000
8. Mt. Pleasant Sacred Heart, 122, 3-1, 38.500
9. Brethren, 143, 3-1, 36.250
10. Kingston, 187, 4-0, 36.000
11. Stephenson, 159, 3-1, 35.450
12. Engadine, 102, 3-1, 34.750
13. Hillman, 140, 3-1, 34.750
14. Camden-Frontier, 176, 3-1, 34.500
15. Powers North Central, 109, 3-1, 34.500
16. Battle Creek St. Philip, 178, 3-1, 32.750
17. Suttons Bay, 189, 3-1, 32.750
18. Cedarville, 151, 3-1, 32.500
19. Eben Junction Superior Central, 121, 3-1, 32.500
20. Portland St. Patrick, 102, 3-1, 32.500
21. Genesee, 169, 3-1, 32.250
22. Bellevue, 185, 3-1, 30.750
23. Kinde-North Huron, 130, 3-1, 28.500
24. Manistee Catholic Central, 181, 3-1, 28.500
25. Peck, 136, 3-1, 28.000
26. Mayville, 185, 3-1, 26.750
27. Fife Lake Forest Area, 183, 2-2, 25.250
28. Crystal Falls Forest Park, 125, 2-2, 23.250
29. Deckerville, 175, 2-2, 23.250
30. Webberville, 176, 2-2, 23.000
31. Bellaire, 131, 2-2, 21.917
32. Onaway, 187, 2-2, 21.417
33. Marion, 139, 2-2, 19.250
34. Rapid River, 127, 2-2, 19.250
35. Tekonsha, 121, 2-2, 19.250
36. Rudyard, 159, 2-2, 19.000
37. Waldron, 65, 2-2, 16.750
38. New Haven Merritt Academy, 154, 1-3, 15.500
39. Pellston, 167, 1-3, 13.750
40. Caseville *, 95, 1-2, 13.417
41. Bay City All Saints, 77, 1-3, 11.750
42. Hale, 122, 1-3, 11.750
43. Central Lake *, 190, 1-2, 11.667
44. Atlanta, 74, 1-3, 11.250
45. North Adams-Jerome, 146, 1-3, 11.000
46. Owendale-Gagetown, 57, 1-3, 11.000
47. St. Helen Charlton Heston Academy, 156, 1-3, 10.250
48. Ashley, 94, 1-3, 10.000
49. Big Rapids Crossroads Academy, 201, 1-3, 9.500
50. Mesick, 202, 1-3, 9.500
51. Brimley, 154, 1-3, 9.250
52. Burr Oak, 74, 1-3, 9.250
53. Ontonagon, 173, 1-3, 9.250
54. Burton Madison Academy, 163, 1-3, 8.750
55. Lawrence, 171, 0-4, 2.750
56. Flint International Academy, 171, 0-4, 1.750
57. Bear Lake *, 94, 0-3, 1.250
58. Carney-Nadeau, 133, 0-4, 1.250
59. Felch North Dickinson, 83, 0-4, 1.250
60. Litchfield, 81, 0-4, 1.250
61. St. Joseph Michigan Lutheran, 100, 0-4, 1.250
62. Baldwin, 120, 0-3, 0.500
Drive for Detroit: Week 9 in Review
October 22, 2018
By Geoff Kimmerly
Second Half editor
This week, 288 Michigan high school football teams are starting anew.
 But before we turn our focus entirely toward the playoffs, let’s say a final goodbye to another memorable regular season.
The last of available league championships were clinched Friday and Saturday, and more teams than we can mention won to get into the postseason. Sunday, of course, was highlighted by the announcement of playoff divisions and pairings – and we’ll jump into the most intriguing first-round matchups later this week.
But for now, let’s take an acknowledging glance at the storylines from Week 9, which in many cases set up some of what we’ll be watching the rest of the way.
“Drive for Detroit” is powered by MI Student Aid.
Bay & Thumb
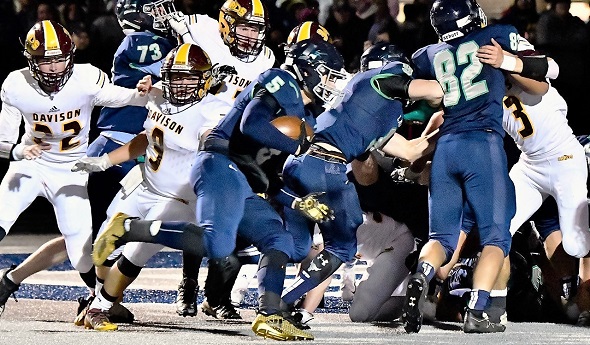
HEADLINER: Lapeer 28, Davison 6 The Saginaw Valley League Blue title went outright to the Lightning with this winner-take-all win. Lapeer (9-0) also capped its first perfect regular season since 2015 and third in five years since the former West and East high schools merged heading into fall 2014. Davison (7-2) finished league runner-up for the second straight season after winning it in 2016. Click for more from the Flint Journal and see below for highlights from WJRT.
.@LapeerFootball downs rival @DavCardFootball, claim SVL Red title @LapeerAthletics @Phoenixdickson @apple_brady @DavisonMade https://t.co/BwOFBEPAup
— ABC12WJRT (@ABC12WJRT) October 20, 2018
Also of note: Ortonville Brandon 34, Swartz Creek 27 The Blackhawks (8-1) held off Swartz Creek to cap their best regular season run since 2000 with a share of the Flint Metro League title (with Flushing), while dropping the Dragons (6-3) out of first place and into a tie for third.
Remember this one: Midland 14, Midland Dow 8 Players never forget this kind of rivalry game. Midland (6-3) made it two straight over the Chargers (5-4) and in the process earned an automatic playoff berth. Dow became an additional qualifier, and they could meet again in a Division 2 District Final.
More shoutouts: Millington 34, Warren Michigan Collegiate 26 The Cardinals’ 14-year playoff streak was on the line, but Millington (6-3) earned an automatic bid by handing Michigan Collegiate (8-1) its lone regular-season defeat. Byron 31, Flint Beecher 27 Croswell-Lexington 47, Goodrich 13 Both ended up in the playoffs, but the Pioneers (6-3) made sure this time after missing last year at 5-4; Goodrich (5-4) did qualify with that record this time despite the defeat.
Greater Detroit
HEADLINER: Detroit Cass Tech 42, Detroit Martin Luther King 8 The Technicians (9-0) will carry Detroit Public School League Green and now PSL A playoff titles into the postseason after avenging last year’s 10-point loss to King. The perfect regular season finish was the team’s second in three years and fourth in six. King, the PSL Black champ, fell to 7-2. Click for more from MLive-Detroit and see below for highlights from State Champs Sports Network.
??VIDEO: Check out the highlights of the Cass Tech (@Detroit_CTFB) vs. King football game from last night pic.twitter.com/9QN0kOYTpf
— STATE CHAMPS! (@statechampsnet) October 20, 2018
Also of note: Warren DeLaSalle 24, Detroit Catholic Central 6 A week after falling to the Shamrocks 10-7 in what created a shared Detroit Catholic League Central title between the two, DeLaSalle (7-2) came back to down DCC (6-3) in the Prep Bowl A-B championship game at Ford Field.
Remember this one: Farmington Hills Harrison 48, Farmington 7 The final regular-season game in Harrison’s illustrious football history saw the Hawks (6-3) earn an automatic playoff bid with a big win over Farmington (6-3), which also qualified for the first time since 2015.
More shoutouts: Oak Park 21, Clarkston 14 The Oakland Activities Association White champion Knights (8-1) bounced back from a Week 8 loss to gain a boost by beating the OAA Red champ Wolves (7-2). Belleville 32, Brighton 17 They met to open and close the regular season, but this Kensington Lakes Activities Association overall championship win for the Tigers (9-0) wasn’t as nail-biting as that five-point Week 1 victory over the Bulldogs (7-2).
Mid-Michigan
HEADLINER: Pewamo-Westphalia 28, Williamston 27 (OT) The Pirates (9-0) stopped a 2-point conversion try in overtime to win this matchup of league champions and finish their third straight perfect regular season in four years. The two-time reigning Division 7 champion hadn’t had a game closer than 28 points this fall before getting a valuable test from the Division 4 Hornets (7-2). Click for more from the Lansing State Journal and see highlights below from FOX 17.
Pewamo-Westphalia 28, Williamston 27 - OT https://t.co/XiISeK5umW
— FOX 17 Blitz (@FOX17Blitz) October 20, 2018
Also of note: Howard City Tri-County 48, Holton 16 The Vikings (5-4) made the playoffs for the first time since 2004 after giving themselves the opportunity with this win over Holton (5-4), which also was selected. Tri-County also guaranteed its first .500-or-better season since 2005 after going 1-8 a year ago.
Remember this one: East Lansing 20, Okemos 17 These neighbors already had qualified for the playoffs, Okemos (6-3) for the first time since 2014. But this might be another indication this rivalry is on its way back – East Lansing (8-1) has won four straight meetings, but four of the last six have been decided by seven points or fewer.
More shoutouts: Portland 27, Montague 20 The Raiders (9-0) look playoff-ready again after capping their third perfect regular season in four years by beating a Montague team that finished 7-2 with its only other defeat to also-unbeaten Reed City. Vermontville Maple Valley 42, Comstock 18 The Lions (5-4) struggled mightily through a 2-4 start, but finished with three straight wins to line up their second straight playoff appearance.
Northern Lower Peninsula
HEADLINER: Traverse City West 21, Petoskey 6 The Titans (7-2) entered this game with the possibility of falling into a three-way shared Big North Conference title. Instead, West won outright and finished a regular season where its two defeats were by a combined 10 points. Petoskey (5-4), meanwhile, earned its first playoff berth since 2015 after going a combined 5-14 over the last two seasons. Click for more from the Traverse City Record-Eagle.
Also of note: Benzie Central 42, Frankfort 6 The Huskies (6-3) clinched their first playoff berth since 2011 – and after not having a team in 2016. Benzie came back to go 1-8 last season before completing the turnaround. Frankfort finished 5-4 but was an additional qualifier after winning three of their last five games.
Remember this one: Traverse City St. Francis 35, New Lothrop 14 Remember it, because the Hornets (8-1) do not lose often during the regular season. This was just their second regular-season defeat in nine seasons, but came against a Gladiators team that at 9-0 finished its third perfect regular season in four years.
More shoutouts: Maple City Glen Lake 27, Grayling 19 The Lakers (5-4) won the Northern Michigan Football League Leaders championship but were in jeopardy of missing the playoffs; beating Grayling (3-6) made them eligible as an additional qualifier. Gaylord 41, Sault Ste. Marie 0 Gaylord’s Blue Devils (6-3) bounced back from two straight one-point defeats to clinch their first playoff berth since 2015 and leave Sault Ste. Marie (5-4) just short, although those Blue Devils more than doubled their 2-7 records of both last season and 2016.
Southwest Corridor
HEADLINER: Cassopolis 21, Centreville 0 It’s rare to luck out with two undefeated teams meeting for a league championship in their regular-season finale. Cassopolis (9-0) chipped away to claim the Southwest 10 Conference title with its sixth shutout this fall. Centreville (8-1) entered averaging nearly 44 points per game, and still has plenty to celebrate – the Bulldogs have their first playoff berth and winning season both since 2008. Click for more from the Cassopolis Vigilant.
Cassopolis 21, Centreville 0 https://t.co/B9D4g32MP9
— FOX 17 Blitz (@FOX17Blitz) October 20, 2018
Also of note: Kalamazoo United 21, Schoolcraft 20 The Southwestern Athletic Conference Valley championship was decided by a point as the Titans (9-0) edged Schoolcraft for the second straight season after beating the Eagles (7-2) last year by three.
Remember this one: Portage Northern 16, St. Joseph 7 The Southwestern Michigan Athletic Conference West sent five of its six teams to the playoffs, and the league race frequently is close. Portage Northern (7-2) with this win earned a share of the title while dropping the Bears (5-4) out of a possible share and into a tie for third place.
More shoutouts: Stevensville Lakeshore 18, Mattawan 13 The Lancers’ 20-year playoff streak was on the line, but this win put them at 5-4 and allowed them to be selected as an additional qualifier. Mattawan (5-4) was selected as well. Coloma 52, Watervliet 36 The Comets (5-4) beat Watervliet for the first time since 2009 (they didn’t play 2012-14) to finish 5-4 for the second straight regular season – but this time they were selected for the playoffs for the first time since 2008.
Southeast & Border
HEADLINER: Reading 55, Grass Lake 7 The Rangers (9-0) took their domination outside of the Big 8 Conference with this crossover win over the Cascades Conference champion. Grass Lake (8-1) also entered undefeated and scoring nearly 39 points per game. Click for more from the Hillsdale Daily News.
Also of note: Jackson 36, Lake Fenton 14 The dream season continued for the Vikings (9-0), who ended the regular season unbeaten for the first time perhaps ever (?). Someone surely will be doing some digging to confirm, but it will be well worth it to celebrate a historic accomplishment – and after Jackson went 4-5 a year ago.
Remember this one: Brooklyn Columbia Central 35, Hudson 16 The Eagles (8-1) broke a two-game losing streak to the Tigers (4-5) to clinch a share of the Lenawee County Athletic Association title with Hillsdale, which it defeated in Week 8.
More shoutouts: Hillsdale 30, Dundee 13 The Hornets (8-1) held on to their share of the LCAA title by avenging two straight defeats to Dundee (5-4), and by doing so kept the Vikings out of the playoffs. Michigan Center 25, Springport 16 The Cardinals finished the regular season 8-1 for the second straight as Springport (7-2) lost for the second straight week but only second time this season.
Upper Peninsula
HEADLINER: Escanaba 39, Kingsford 27 The Eskymos (7-2) probably didn’t anticipate ending the weekend with a share of the Great Northern Conference championship. But by beating the Flivvers (4-5), Escanaba was able to benefit from Menominee’s upset of first-place Marquette. The win over Kingsford held additional significance too – the Flivvers edged the Eskymos for the GNC title last season with a win in their Week 9 meeting. Click for more from the Escanaba Daily Press.
Also of note: Gwinn 20, Munising 16 The Modeltowners (6-3) flipped last season’s 3-6 record to earn an automatic playoff berth and keep Munising (4-5) from possible selection as an additional qualifier.
Remember this one: Menominee 32, Marquette 14 This ended an uncharacteristic down season for the Maroons (2-7) – they saw their 22-year playoff streak come to an end. But they did finish by adding to a seven-game winning streak over Marquette, denying the Redmen (4-5) an outright league title and possible additional qualifier bid for the playoffs.
More shoutouts: Ishpeming 54, Bark River-Harris 13 The Hematites (9-0) put together their fourth perfect regular season in six years and coming off back-to-back three-win finishes. St. Ignace 44, Gaylord St. Mary 0 The Saints missed the playoffs, but finishing 5-4 was a great jump from 1-8 in 2017.
West Michigan
HEADLINER: East Kentwood 28, Rockford 17 The Falcons (8-1) made their way through an Ottawa-Kent Conference Red that will send four of seven teams to the playoffs – and with Rockford making a bid Friday to grab a share of the league title. The win over the Rams was East Kentwood’s first since 2015 and put Rockford (5-4) in an unfamiliar spot of briefly not knowing if its season was done – although the Rams did make the playoffs as an additional qualifier for a record 24th straight season. Click for more from the Grand Rapids Press and see highlights below from WZZM.
GOTW: East Kentwood goes for league title against Rockford https://t.co/LfNw9tzVdS pic.twitter.com/RLlHOu4Vhh
— 13 On Your Sidelines (@13OYSL) October 20, 2018
Also of note: Zeeland East 36, Hudsonville Unity Christian 13 The Chix (8-1) completed a repeat O-K Green championship after Unity Christian (7-2) entered with an opportunity to create a three-way tie for the top spot.
Remember this one: Saugatuck 56, Fennville 20 The Indians (8-1) claimed the SAC Lakeshore title in this winner-take-all matchup, avenging the Week 9 loss to the Blackhawks (7-2) a year ago that gave Fennville the championship ahead of Saugatuck.
More shoutouts: Holland Christian 24, Spring Lake 17 Despite playing in an O-K Green with three other playoff teams, the Maroons (6-3) are headed back to the postseason for the first time since 2012 and with a guaranteed final winning record for the first time since 2009. Spring Lake (5-4) also made the playoffs as an additional qualifier after going 0-9 a year ago. Hudsonville 23, Holland West Ottawa 16 Two more of the O-K Red’s best met with playoffs on the line for the Eagles, who earned an automatic berth with the win. These two will settle things one more time with a Division 1 rematch this week.
8-Player
HEADLINER: Wyoming Tri-unity Christian 22, Colon 14 The Midwest Central Michigan Conference West champion Defenders (9-0) handed the Southern Central Athletic Association A champion Magi their only loss of the regular season, holding Colon (8-1) to almost 33 points under its average. The win also gave Tri-unity its second perfect regular season in three years. These teams could meet again in an 8-Player Division 1 Semifinal. Click for more from the Sturgis Journal.
Tri-Unity Christian 22, Colon 14 https://t.co/7UrJSCWRLt
— FOX 17 Blitz (@FOX17Blitz) October 20, 2018
Also of note: Morrice 32, Webberville 0 The Orioles finished 9-0 for the first time in program history and reached nine wins for the third time in four years. Webberville made the loss pay off getting enough bump to make the playoffs at 4-5 with a higher playoff-point average than other teams that finished 5-4.
Remember this one: Engadine 52, Crystal Falls Forest Park 42 The Eagles (8-1) edged the reigning 8-player Division 2 champ Trojans (5-4), but these teams could see each other again in a Regional Final.
More shoutouts: Pickford 48, Cedarville 8 The Pirates (9-0) completed their second straight perfect regular season and finished an outright title run in the Great Lakes Conference East. Cedarville (5-4) will join three others from the league in the playoffs. Deckerville 20, Peck 8 The Eagles (7-2) eluded a possible shared North Central Thumb League Blue title, holding on to the championship outright by holding off an upset bid by the Pirates (5-4).
Second Half’s weekly “Drive for Detroit” previews and reviews are powered by MI Student Aid, a part of the Student Financial Services Bureau located within the Michigan Department of Treasury. MI Student Aid encourages students to pursue postsecondary education by providing access to student financial resources and information, including various student financial assistance programs to help make college more affordable for Michigan students. MI Student Aid administers the state’s 529 savings programs (MET/MESP) and eight additional aid programs within its Student Scholarships and Grants division. Click for more information and connect with MI Student Aid on Facebook and Twitter @mistudentaid.
PHOTO: Lapeer pushes through for a touchdown during its league title-clinching win over Davison. (Photo by Terry Lyons.)