

2019 Week 5 Football Playoff Listing
September 24, 2019
By Geoff Kimmerly
Second Half editor
Here is a list of Michigan High School Athletic Association football playing schools, displaying their win-loss records and playoff averages through the fourth week of the season.
Schools on this list are in enrollment order for 11-player teams, with 8-player teams ordered by playoff average. An asterisk (*) beside a record indicates a team has eight or fewer games scheduled.
Those schools with 11-player teams with six or more wins playing nine-game schedules, or five or more wins playing eight games or fewer, will qualify for the MHSAA Football Playoffs beginning Nov. 1. Schools with 5-4, 4-3 or 4-4 records may qualify if the number of potential qualifiers by win total does not reach the 256 mark. Schools with six or more wins playing nine-game schedules or five or more wins playing eight games or fewer may be subtracted from the field based on playoff average if the number of potential qualifiers exceeds the 256 mark.
Once the 256 qualifying schools are determined, they will be divided by enrollment groups into eight equal divisions of 32 schools, and then drawn into regions of eight teams each and districts of four teams each. Those schools with 8-player teams will be ranked by playoff average at season’s end, and the top 32 programs will then be divided into two divisions of 16 each based on enrollment. The playoff in that division also begins Nov. 1
To review a list of all football playoff schools, individual school playoff point details and to report errors, visit the Football page of the MHSAA Website.
The announcement of the qualifiers and first-round pairings for both the 11 and 8-player playoffs will take place Oct. 27 on the Selection Sunday Show on FOX Sports Detroit. The playoff qualifiers and pairings will be posted to the MHSAA Website following the Selection Sunday Show.
11-Player Playoff Listing
1. Macomb Dakota, 3034, 3-1, 64.750
2. Dearborn Fordson, 2868, 4-0, 90.000
3. Grand Blanc, 2719, 4-0, 90.000
4. East Kentwood, 2673, 3-1, 64.500
5. Rockford, 2443, 4-0, 90.000
6. Lake Orion, 2416, 4-0, 98.000
7. Clinton Township Chippewa Valley, 2386, 4-0, 92.000
8. Brighton, 2224, 3-1, 68.750
9. Plymouth, 2090, 4-0, 94.000
10. West Bloomfield, 2042, 3-1, 72.500
11. Hudsonville, 1930, 3-1, 66.250
12. Detroit Western, 1888, 3-1, 54.000
13. Saline, 1861, 3-1, 64.083
14. Lapeer, 1792, 3-1, 72.750
15. Grandville, 1719, 4-0, 96.000
16. Rochester Adams, 1710, 3-1, 62.750
17. Davison, 1694, 4-0, 90.000
18. Belleville, 1692, 4-0, 86.000
19. Romeo, 1692, 3-1, 72.250
20. Waterford Mott, 1658, 3-1, 68.250
21. Rochester Hills Stoney Creek, 1638, 3-1, 68.750
22. Brownstown Woodhaven, 1623, 4-0, 90.000
23. Warren Mott, 1513, 3-1, 64.500
24. Grosse Pointe South, 1510, 3-1, 74.500
25. Temperance Bedford, 1466, 3-1, 62.250
26. Sterling Heights, 1464, 3-1, 64.750
27. Farmington *, 1444, 4-0, 90.000
28. Livonia Franklin, 1435, 4-0, 92.000
29. Harrison Township L'Anse Creuse, 1434, 3-1, 66.250
30. Traverse City Central, 1404, 3-1, 70.500
31. Lansing Everett, 1388, 3-1, 62.500
32. Wyandotte Roosevelt, 1386, 3-1, 68.750
33. North Farmington, 1371, 4-0, 84.000
34. Birmingham Seaholm, 1370, 4-0, 88.000
35. Battle Creek Lakeview, 1350, 4-0, 84.000
36. Birmingham Groves, 1310, 3-1, 72.500
37. Midland, 1309, 4-0, 90.000
38. Port Huron, 1309, 4-0, 82.000
39. Port Huron Northern, 1284, 3-1, 68.500
40. Oak Park, 1276, 3-1, 68.500
41. South Lyon, 1276, 4-0, 90.000
42. Portage Northern, 1274, 3-1, 68.500
43. Jackson *, 1231, 3-1, 58.500
44. Walled Lake Western, 1228, 3-1, 68.750
45. Muskegon Mona Shores, 1227, 3-1, 68.750
46. Grand Rapids Forest Hills Central, 1219, 3-1, 66.750
47. Dexter, 1214, 3-1, 68.750
48. Fenton, 1168, 3-1, 66.750
49. Byron Center, 1145, 4-0, 86.000
50. Auburn Hills Avondale, 1133, 3-1, 62.250
51. Grand Rapids Northview, 1130, 3-1, 62.500
52. Bloomfield Hills Brother Rice, 1128, 4-0, 94.667
53. Allen Park, 1127, 3-1, 64.250
54. East Lansing, 1119, 3-1, 74.750
55. Redford Thurston, 1084, 3-1, 66.750
56. Zeeland West, 1054, 4-0, 90.000
57. Pinckney, 1053, 3-1, 58.750
58. Mount Pleasant, 1048, 4-0, 84.000
59. St. Joseph, 1019, 4-0, 86.000
60. Cedar Springs, 1018, 3-1, 68.000
61. DeWitt, 1013, 3-1, 72.750
62. Detroit Mumford, 1007, 3-1, 54.750
63. River Rouge, 992, 3-1, 62.500
64. Mason, 964, 4-0, 78.000
65. Muskegon, 954, 4-0, 96.000
66. Flint Kearsley, 951, 4-0, 88.000
67. Zeeland East, 943, 3-1, 59.167
68. Orchard Lake St. Mary's, 942, 4-0, 93.600
69. Coldwater, 940, 3-1, 58.750
70. St. Johns, 938, 3-1, 62.500
71. Riverview, 915, 3-1, 60.500
72. Dearborn Divine Child, 878, 3-1, 60.750
73. Parma Western, 870, 3-1, 62.750
74. Edwardsburg, 856, 4-0, 86.000
75. Chelsea, 847, 4-0, 100.000
76. Fowlerville, 834, 4-0, 74.000
77. Marshall, 825, 3-1, 58.500
78. Ortonville Brandon, 825, 4-0, 74.000
79. Carleton Airport, 815, 3-1, 58.500
80. Sparta, 780, 3-1, 66.500
81. St. Clair, 780, 4-0, 74.000
82. Vicksburg, 764, 3-1, 58.750
83. Allendale, 756, 3-1, 54.500
84. Goodrich, 741, 3-1, 54.500
85. Milan, 738, 4-0, 68.000
86. North Branch, 736, 3-1, 54.750
87. Escanaba, 708, 3-1, 65.583
88. Pontiac Notre Dame Prep, 705, 4-0, 84.000
89. Otsego, 683, 3-1, 50.750
90. Romulus Summit Academy North, 681, 3-1, 62.750
91. Sault Ste. Marie, 679, 3-1, 64.250
92. Detroit Country Day, 677, 4-0, 82.000
93. Paw Paw, 662, 4-0, 74.000
94. Ludington, 656, 3-1, 54.250
95. Flint Powers Catholic, 652, 3-1, 62.750
96. Grand Rapids Catholic Central, 628, 3-1, 74.750
97. Hudsonville Unity Christian, 618, 3-1, 62.250
98. Livonia Clarenceville, 602, 3-1, 36.250
99. Muskegon Orchard View, 602, 4-0, 72.000
100. Grand Rapids South Christian, 599, 3-1, 58.000
101. Ogemaw Heights, 588, 3-1, 46.750
102. Portland, 580, 4-0, 80.000
103. Freeland, 579, 3-1, 64.750
104. Hancock, 579, 3-1, 46.250
105. Muskegon Oakridge, 574, 4-0, 66.000
106. Essexville Garber, 561, 3-1, 56.500
107. Frankenmuth, 547, 4-0, 78.000
108. Saginaw Swan Valley, 544, 3-1, 52.500
109. Dearborn Heights Robichaud, 542, 4-0, 80.000
110. Ann Arbor Father Gabriel Richard, 536, 3-1, 52.250
111. Marine City, 521, 4-0, 74.000
112. Lansing Catholic, 520, 4-0, 78.000
113. Whitmore Lake, 520, 3-1, 32.750
114. Almont, 514, 4-0, 70.000
115. Hopkins, 514, 4-0, 70.000
116. Detroit Denby, 508, 4-0, 68.000
117. Berrien Springs *, 505, 4-0, 76.000
118. Olivet, 505, 4-0, 66.000
119. Dundee, 497, 3-1, 50.500
120. Detroit Henry Ford, 492, 3-1, 60.750
121. Manistee, 487, 3-1, 42.500
122. Richmond, 476, 4-0, 80.000
123. Central Montcalm, 457, 4-0, 72.000
124. Kingsley, 454, 4-0, 70.000
125. Montague, 446, 4-0, 68.000
126. Hillsdale, 445, 4-0, 78.000
127. Clare, 442, 4-0, 70.000
128. Menominee, 425, 3-1, 53.400
129. Tawas *, 421, 3-1, 42.000
130. Flint Hamady *, 420, 4-0, 68.000
131. Brooklyn Columbia Central, 414, 3-1, 48.500
132. Constantine, 412, 3-1, 46.750
133. Jonesville, 395, 3-1, 44.750
134. Clinton Township Clintondale, 392, 3-1, 46.250
135. Maple City Glen Lake, 389, 4-0, 58.000
136. Sanford Meridian, 386, 4-0, 68.000
137. Harrison, 382, 3-1, 44.750
138. Blissfield, 381, 3-1, 58.750
139. Niles Brandywine, 378, 4-0, 68.000
140. Calumet, 377, 4-0, 74.000
141. Warren Michigan Collegiate, 375, 3-1, 52.750
142. Montrose, 374, 3-1, 58.750
143. Ithaca, 362, 4-0, 64.000
144. Delton Kellogg, 358, 3-1, 50.750
145. Grass Lake, 347, 4-0, 54.000
146. Monroe St. Mary Catholic Central *, 347, 3-1, 60.750
147. Ravenna, 347, 3-1, 46.750
148. LeRoy Pine River, 345, 3-1, 40.500
149. Kent City, 340, 3-1, 44.750
150. Laingsburg, 338, 3-1, 48.750
151. Pewamo-Westphalia, 335, 4-0, 54.000
152. Grand Rapids NorthPointe Christian, 333, 4-0, 50.000
153. Clinton, 328, 4-0, 64.000
154. Schoolcraft, 328, 4-0, 64.000
155. L'Anse, 324, 3-1, 44.500
156. Detroit Leadership Academy, 322, 4-0, 70.000
157. Beaverton, 318, 4-0, 66.000
158. Charlevoix, 318, 3-1, 48.250
159. Madison Heights Bishop Foley, 316, 3-1, 36.667
160. Springport, 316, 3-1, 36.250
161. Jackson Lumen Christi *, 314, 4-0, 92.000
162. Riverview Gabriel Richard, 313, 3-1, 48.250
163. New Lothrop, 307, 4-0, 70.000
164. Iron Mountain, 303, 4-0, 70.000
165. Detroit Central, 299, 3-1, 50.250
166. Oscoda, 295, 4-0, 58.000
167. Detroit Community, 283, 3-1, 38.250
168. Elkton-Pigeon-Bay Port Laker, 279, 3-1, 50.500
169. Harbor Springs, 279, 3-1, 36.250
170. Lawton, 275, 4-0, 60.000
171. Evart, 271, 3-1, 42.750
172. Cass City, 269, 3-1, 48.500
173. Cassopolis, 268, 4-0, 58.000
174. Sand Creek, 256, 3-1, 52.750
175. Beal City, 249, 4-0, 64.000
176. Royal Oak Shrine Catholic, 249, 4-0, 76.000
177. Addison, 238, 3-1, 48.500
178. West Iron County, 235, 3-1, 44.750
179. Gobles, 233, 3-1, 36.750
180. Reading, 232, 3-1, 48.750
181. Mount Clemens, 225, 3-1, 38.500
182. Bark River-Harris, 223, 3-1, 40.500
183. Ishpeming, 217, 3-1, 42.250
184. White Pigeon, 213, 4-0, 62.000
185. Johannesburg-Lewiston, 212, 4-0, 56.000
186. Harbor Beach, 207, 4-0, 56.000
187. Adrian Lenawee Christian, 199, 3-1, 45.300
188. Ubly, 198, 4-0, 60.000
189. Breckenridge, 197, 3-1, 40.750
190. Merrill, 197, 3-1, 46.250
191. Saginaw Michigan Lutheran Seminary, 189, 4-0, 52.000
192. Britton Deerfield, 188, 3-1, 46.250
193. Saginaw Nouvel, 188, 3-1, 48.750
194. Mendon, 184, 3-1, 44.750
195. Fowler, 180, 4-0, 56.000
196. Auburn Hills Oakland Christian, 175, 3-1, 46.667
197. Lake Linden-Hubbell, 131, 3-1, 42.500
198. Clarkston Everest Collegiate *, 121, 3-0, 56.667
8-Player Playoff Listing
1. Morrice, 182, 4-0, 48.000
2. Climax-Scotts, 145, 4-0, 46.000
3. Deckerville, 195, 4-0, 44.000
4. Hillman, 124, 4-0, 44.000
5. Powers North Central, 107, 4-0, 44.000
6. Gaylord St. Mary, 162, 4-0, 42.000
7. Pellston, 173, 4-0, 42.000
8. Pickford, 138, 3-1, 40.750
9. Colon, 160, 4-0, 40.667
10. Suttons Bay, 205, 4-0, 40.000
11. Martin, 187, 4-0, 40.000
12. Brimley, 166, 4-0, 40.000
13. Peck, 119, 4-0, 40.000
14. Portland St. Patrick, 99, 4-0, 40.000
15. Crystal Falls Forest Park, 121, 3-1, 38.500
16. Kinde North Huron, 126, 4-0, 36.000
17. Vestaburg, 186, 4-0, 34.000
18. Camden-Frontier, 175, 3-1, 32.750
19. Mio, 168, 3-1, 32.750
20. New Haven Merritt Academy, 174, 3-1, 32.750
21. Kingston, 197, 3-1, 30.750
22. Onekama *, 142, 3-1, 30.750
23. Mesick, 193, 3-1, 30.500
24. Brethren, 141, 3-1, 30.000
25. Mayville, 193, 3-1, 28.750
26. Litchfield, 179, 3-1, 28.250
27. Hale, 113, 3-1, 26.750
28. Engadine, 108, 3-1, 26.500
29. Newberry, 186, 3-1, 24.500
30. Posen, 71, 2-2, 23.500
31. Tekonsha, 159, 2-2, 23.000
32. Bellevue, 171, 2-2, 21.500
33. Mount Pleasant Sacred Heart, 113, 2-2, 21.500
34. Wyoming Tri-unity Christian, 100, 2-2, 21.500
35. Eben Junction Superior Central, 177, 2-2, 21.000
36. Cedarville, 154, 2-2, 20.750
37. Rudyard, 164, 2-2, 19.250
38. Onaway, 182, 2-2, 19.000
39. International Academy of Flint, 185, 2-2, 18.750
40. Burr Oak, 70, 2-2, 17.250
41. Burton Madison Academy, 164, 2-2, 17.000
42. Marion, 133, 2-2, 17.000
43. Fife Lake Forest Area *, 175, 1-3, 16.050
44. Rapid River, 131, 1-3, 13.750
45. Bay City All Saints, 136, 1-3, 13.500
46. Carney-Nadeau, 132, 1-3, 12.200
47. Au Gres-Sims, 129, 1-3, 12.000
48. Ashley, 90, 1-3, 12.000
49. Genesee, 179, 1-3, 11.750
50. Central Lake, 169, 1-3, 11.500
51. St. Joseph Michigan Lutheran, 103, 1-3, 11.500
52. Manistee Catholic Central, 177, 1-3, 9.750
53. Webberville, 182, 1-3, 9.750
54. Battle Creek St. Philip, 179, 1-3, 9.750
55. Felch North Dickinson, 86, 1-3, 9.250
56. Baldwin, 106, 1-3, 9.000
57. Waldron, 77, 1-3, 9.000
58. Atlanta, 74, 1-3, 8.750
59. Akron-Fairgrove, 90, 1-3, 8.250
60. Bellaire, 122, 0-4, 2.750
61. Lawrence, 180, 0-4, 2.500
62. Ontonagon, 165, 0-4, 2.500
63. North Adams-Jerome, 145, 0-4, 2.000
64. Carsonville-Port Sanilac, 92, 0-4, 2.000
65. Caseville, 79, 0-4, 1.750
66. Owendale-Gagetown, 49, 0-4, 1.750
67. St. Helen Charlton Heston Academy, 181, 0-4, 1.250
68. Stephenson, 175, 0-4, 1.250
69. Big Rapids Crossroads Academy, 188, 0-4, 1.000
70. Bear Lake, 98, 0-4, 1.000
71. New Buffalo *, 178, 0-3, 0.750
Drive for Detroit: Week 9 in Review
October 28, 2019
By Geoff Kimmerly
Second Half editor
Just like that, nine weeks of Michigan high school football have come and gone this fall, and more than half the state’s 600+ teams are turning in their helmets and pads as we turn our attention toward the final 288 playing for MHSAA championships.
 But let’s not skip by Week 9 just yet. It definitely deserves a few more minutes of our time and attention.
The regular season made plenty of noise on its way out this weekend, with a few surprise conclusions to league title races and plenty of teams with plenty to celebrate. Some of those achievements were obvious, some not, and below we tried to cover many in both categories.
"Drive for Detroit" is sponsored by MI Student Aid.
Bay & Thumb
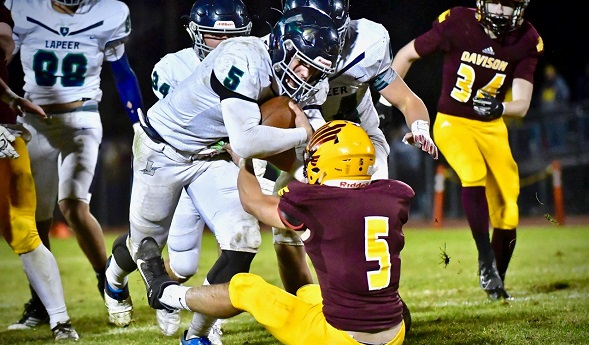
HEADLINER Lapeer 24, Davison 21 (2OT) For the second-straight year, the Saginaw Valley League Blue title came down to these two in a regular-season finale. And this one came down to a pair of field goal attempts in double overtime – Lapeer (8-1) made its kick and then blocked Davison’s to lock up the win and the repeat championship after also defeating the Cardinals (7-2) in the clincher a year ago. Click for more from the Flint Journal and see highlights below from State Champs Sports Network.
VIDEO: Check out the highlights of the Lapeer (@LapeerFootball) at Davison football game from tonight. @LapeerAthletics
Brought to you by @LTUAthletics, @MHSAA, @hungryhowies & @DACathlete pic.twitter.com/WzyOS5FZIi— STATE CHAMPS! (@statechampsnet) October 26, 2019
Watch list Midland Dow 42, Midland 7 The Chargers (6-3) started this season 2-3 and lost a Week 5 league game to Saginaw Heritage, which finished 4-5. But they battled all the way back and clinched a shared league title with the Chemics (8-1) by breaking a three-game losing streak against their rivals.
Remember this one Millington 41, Central Montcalm 18 The Cardinals (5-4) needed to close with a significant win to extend their playoff streak to 16 years, and they made it as an additional qualifier after defeating a league champion in Central Montcalm (7-2).
More shoutouts Harbor Beach 21, Elkton-Pigeon-Bay Port Laker 6 The Pirates (9-0) finished their third undefeated regular season this decade and first since 2014, with Laker (6-3) one of four opponents that also made the playoffs. Flint Hamady 56, Flint Southwestern 18 The Hawks (7-1) locked up the Genesee Area Conference title outright to go with their win in the old GAC Blue a year ago.
Greater Detroit
HEADLINER Orchard Lake St. Mary's 13, Detroit Catholic Central 0 The co-champions of the Detroit Catholic League Central met again two weeks after DCC’s 20-14 win sealed the shared title. The Eaglets (8-1) avenged as well as any team could hope, not only claiming the Prep Bowl Bishop championship but also keeping the Shamrocks (4-5) from advancing to the playoffs for the first time since 2014. Click for more from the Detroit News.
Watch list Belleville 41, Plymouth 14 The Tigers (9-0) capped a third-straight undefeated regular season with another Kensington Lakes Activities Association overall title, in this KLAA final handing Plymouth (8-1) its only loss.
Remember this one Detroit Martin Luther King 27, Detroit Denby 6 The Crusaders (7-2) have rebounded from losses to DCC and Muskegon to open this season to win a third straight league championship and this PSL 1/2 final. Denby also is 7-2, with its losses both to King.
More shoutouts Brownstown Woodhaven 49, Birmingham Groves 28 The Warriors (9-0) locked up their second perfect regular season over the last six with a season-high scoring output against Groves (7-2). West Bloomfield 16, Warren De La Salle Collegiate 8 The Lakers (8-1) brought their average points allowed down to 12 with a near-shutout of the two-time reigning Division 2 champion Pilots (5-4), whose last three defeats have been by a combined 12 points.
Mid-Michigan
HEADLINER New Lothrop 42, Frankenmuth 22 Three games this weekend matched undefeated teams, and reigning Division 7 champion New Lothrop (9-0) made a statement handing a loss to Division 5 Frankenmuth (8-1). The Hornets completed their eighth unbeaten regular season over the last 10 years, locking it up by scoring more than double the number of points the Eagles allowed in any other game going back to Week 2 of 2018. Click for more from the Saginaw News and see highlights below from WJRT.
New Lothrop stings Frankenmuth with its first loss of the year in battle of state powers@NLAPS @FMuthAthletics @adm168 @CoachGalvas @JacobGr58140536 https://t.co/p4exVlIWcu
— ABC12WJRT (@ABC12WJRT) October 26, 2019
Watch list Pewamo-Westphalia 41, Williamston 0 Last year the Pirates got past the Hornets by a point in Week 9 on the way to the Division 7 Regional Finals. This time, P-W (9-0) earned its sixth shutout of the season, impressive even more considering the Hornets (5-4) are headed back to the Division 4 playoffs.
Remember this one Mason 48, Eaton Rapids 6 The Bulldogs, 5-4 last season and 2-7 in 2017, finished their first 9-0 regular season – an accomplishment made more impressive considering Mason had finished with one regular-season loss nine times over the last 35 years.
More shoutouts Holt 42, Grand Ledge 37 The Rams (7-2) held on against the rival Comets (2-7) to clinch a share of the Capital Area Activities Conference Blue title (with East Lansing and DeWitt) and guarantee their winningest season since 2010. St. Johns 21, Alpena 20 (OT) The Redwings (6-3) went to overtime to guarantee a playoff berth in coach Andy Schmitt’s first season and in the process ended any hopes for Alpena (4-5), which was hoping to make the playoffs for the first time since 2004.
Northern Lower Peninsula
HEADLINER Traverse City Central 41, Cadillac 13 The Trojans (8-1) finished an outright championship run through the Big North Conference with their fifth straight win over Cadillac. Central hasn’t lost since Week 1 against DeWitt, which also went on to share a league title this fall. There’s a consolation, however, for the Vikings (5-4) – they’re back in the playoffs for the first time since 2016 and after going a combined 3-15 over the last two seasons. Click for more from the Traverse City Record-Eagle.
Watch list Ogemaw Heights 30, Houghton Lake 18 The Falcons improved to 7-2, their best and also first winning record since 2013, and this win over Houghton Lake (6-3) arguably was the best of the run so far. The Falcons’ losses were to two other playoff teams, Kingsley and Sault Ste. Marie.
Remember this one Lake City 14, Sanford Meridian 10 Lake City’s streak of two straight undefeated regular seasons ended opening night. But the Trojans won four straight to get back to the playoffs for the third-straight year, with this win over Meridian (6-3) arguably their best this fall.
More shoutouts Johannesburg-Lewiston 47, Indian River Inland Lakes 0 The Cardinals finished the regular season 9-0 for the first time since 1998 and finished an outright championship run through the Northern Michigan Football League Legacy division. Kingsley 44, Boyne City 16 The Stags (9-0) had a similar story in the NMFL Legends, with this win completing a run to an outright title and their first perfect regular season since 2005.
Southeast & Border
HEADLINER Reading 51, Addison 6 The reigning Division 8 champion Rangers appear to be in postseason form after winning this crossover of winners from the Big 8 and Cascades conferences. Reading was the Big 8’s best for the third straight season and hasn’t scored fewer than 44 points in a game since being shut out opening night by still-undefeated Division 7 contender Pewamo-Westphalia. Cascades champion Addison (7-2) could see Reading again in the Regional Final. Click for more from the Hillsdale Daily News.
Watch list Saline 45, Grand Blanc 27 The Hornets are headed into arguably the toughest District in the state, regardless of division, but not without some momentum. Saline (8-1) is unbeaten since falling opening night to reigning Division 1 champion Clinton Township Chippewa Valley. Grand Blanc (5-4) scored the second-most points the Hornets have given up this fall, but Saline reached 400 points for the season – 40 more over nine games than the Hornets scored over 13 last season when they made the Semifinals.
Remember this one Whitmore Lake 41, Livonia Clarenceville 6 The Trojans’ first season in the Michigan Independent Athletic Conference now includes the outright league title, a first playoff berth since 2013 and at 7-2 its most wins since 2008. Clarenceville did miss the playoffs, but at 5-4 posted its first winning season since 2013.
More shoutouts Concord 51, Hanover-Horton 49 The Yellow Jackets (5-4) pushed back into the playoffs for the first time since 2016 with their first winning record since that year, while also dashing the hopes for Hanover-Horton (4-5) as it sought its first playoff berth since 2014. Grass Lake 26, Jonesville 24 The Cascades took this matchup of runners-up as Grass Lake (8-1) received one of its toughest challenges from the Comets (6-3), who have a winning record and made the playoffs both for the first time since 2013.
Southwest Corridor
HEADLINER Edwardsburg 44, Paw Paw 14 This decade now has included eight league championships for the Eddies, who locked up another in the Wolverine Conference as well as their fourth perfect regular season over the last five years. This matchup was for the outright title as Paw Paw (8-1) also hadn’t lost heading into the weekend. But Edwardsburg put up nearly half of the 92 points the Redskins have given up all season.
VIDEO: Check out the highlights of the Edwardsburg (@EddiesAthletics) at Paw Paw football game from last night. @jhutt5 reporting
Brought to you by @LTUAthletics, @MHSAA, @hungryhowies & @DACathlete pic.twitter.com/EcjBi0UucN— STATE CHAMPS! (@statechampsnet) October 26, 2019
Watch list Portage Northern 49, St. Joseph 26 The co-leaders of the Southwestern Michigan Athletic Conference West also played for that outright championship, with Portage Northern (8-1) claiming it after sharing the title with Portage Central a year ago. St. Joseph (6-3) will try to bounce back from three straight losses as it heads into the playoffs for the fifth straight season.
Remember this one Kalamazoo United 35, Schoolcraft 27 Perhaps this shouldn’t be considered a stunner – the Titans won the Southwestern Athletic Conference Valley a year ago. But United (5-4) also bounced back from an 0-3 start and a loss in Week 8 to Constantine to deliver Schoolcraft (8-1) its only defeat – and turn the league title into a three-team share between the Titans, Eagles and Falcons.
More shoutouts Mattawan 32, Stevensville Lakeshore 6 The Wildcats (5-4) won four straight to get back to the playoffs for the third-straight year, and in the process ended Lakeshore’s bid to make the playoffs for the 22nd straight season by sending the Lancers to 4-5. Niles Brandywine 52, Buchanan 38 The Bobcats are 9-0 for the first time since 1995 after putting up 50 points for the fifth time this season to increase their scoring average to 50.3 points per game.
Upper Peninsula
HEADLINER Marquette 31, Kingsford 7 The Redmen (5-4) did it all in their regular-season finale, clinching the Great Northern Conference title outright while locking up their first winning regular-season record and playoff berth both since 2014. In the process they ended the postseason hopes for Kingsford, which at 4-5 fell a win shy of consideration for the second straight year. Click for more from the Marquette Mining Journal.
Watch list Menominee 48, Hopkins 38 The Maroons may have had a chance to get back to the playoffs at 5-4, but guaranteed a spot finishing 6-3 with this win over the Vikings (8-1), winners of the Ottawa-Kent Conference Silver this fall.
Remember this one Ishpeming Westwood 42, Negaunee 14 The Patriots (7-2) have beaten Negaunee in three straight, but the Miners (6-3) can earn a rematch as they line up on opposite sides of the same Division 6 District.
More shoutouts Ishpeming 54, Bark River-Harris 8 The Hematites (7-2) finished a perfect run through the Western Peninsula Athletic Conference Iron – and will see Bark River-Harris (5-4) again this week in a Division 8 opener. Iron Mountain 42, Gogebic 14 The Mountaineers (9-0) claimed the outright West PAC Copper title and finished the regular season unbeaten for the first time since 2011.
West Michigan
HEADLINER Rockford 17, East Kentwood 7 The last two weeks in the O-K Red have been unpredictable to say the least. Week 8 saw Grandville down Rockford 30-3 to move into a first-place tie with a game to play for both. Rockford (8-1) took care of its end of winning the league title with this victory over East Kentwood. And the Rams finished the weekend outright champs after Caledonia upset the Bulldogs 56-35. Rockford’s win avenged a loss last season to the Falcons – and the Rams can double up as they face East Kentwood (5-4) again in a Division 1 opener this week. See below for highlights from FOX 17.
Rockford wins the OK Red outright with win over East Kentwood and Grandville's loss to Caledonia. https://t.co/L0KyoREBr4
— FOX 17 Blitz (@FOX17Blitz) October 26, 2019
Watch list Hudsonville Unity Christian 55, Zeeland East 28 The Crusaders (6-3) needed a victory to guarantee returning to the playoffs after winning Division 5 a year ago – and they got it by avenging last season’s defeat to Zeeland East (5-4), one of two teams to beat Unity during the 2018 title run.
Remember this one Grand Haven 37, Grand Rapids Union 6 The Buccaneers (5-4) finished the regular season with a winning record and earned a playoff spot both for the first time since 2011 after closing with four straight victories.
More shoutouts Muskegon Oakridge 25, Traverse City St. Francis 20 The Eagles (9-0) finished their first perfect regular season since 2012 with a final defensive stand against another annual power in St. Francis (6-3). Montague 18, Portland 14 Downing last season’s Division 5 runner-up Portland (7-2) was a huge way to ride into the playoffs for Montague, which was runner-up in Division 6 last year.
8-Player
HEADLINER Gaylord St. Mary 53, Brethren 14 Prospects turned dim when St. Mary had to forfeit four wins three weeks ago. But the Snowbirds (4-5) did everything possible to get into the playoffs, with this victory over Brethen (5-4) joining a Week 8 win over Mio that helped them accumulate enough points to earn a spot in the Division 1 bracket. Click for more from the Gaylord Herald Times.
Watch list Martin 26, Climax-Scotts 24 The Clippers (9-0) just continue to impress, this weekend getting past Climax-Scotts (7-2) to lock up their first perfect regular season since 1987, in this their first season of 8-player football.
Remember this one Sutton Bay 27, Mesick 18 The Norsemen (9-0) closed the regular season winning this matchup of league champions over Mesick (7-2), which still finished with its best regular-season record since 1995.
More shoutouts Engadine 54, Cedarville 20 The Eagles (8-1) ran their winning streak over Cedarville (5-4) to five; Engadine’s only regular-season losses the last two seasons have come to Pickford, this week’s playoff opponent. Deckerville 48, Peck 0 The Eagles (9-0) finished their second straight North Central Thumb League Blue outright title and third perfect regular season this decade with their sixth-straight win over Peck (5-4).
Second Half’s weekly “Drive for Detroit” previews are powered by MI Student Aid, a part of the Office of Postsecondary Financial Planning located within the Michigan Department of Treasury. MI Student Aid encourages students to pursue postsecondary education by providing access to student financial resources and information. MI Student Aid administers the state’s 529 college savings programs (MET/MESP), as well as scholarship and grant programs that help make college Accessible, Affordable and Attainable for you. Connect with MI Student Aid at www.michigan.gov/mistudentaid and find more information on Facebook and Twitter @mistudentaid.
PHOTO: Lapeer rumbled to a 24-21 double overtime win over Davison in Week 9 to lock up the Saginaw Valley League Blue championship. (Photo by Terry Lyons.)