
Inside Selection Sunday: Mapnalysis '14
October 26, 2014
By Geoff Kimmerly
Second Half editor
The pictures we drew Sunday morning at the MHSAA office won’t be found hanging on anyone’s walls.
But we worked toward something suitable for framing, designing this season’s football playoff brackets while considering the months and years of work put in by our schools and their teams, parents and fans to earn an opportunity to continue their seasons this weekend.
The work completed today to draw up the 2014 MHSAA Football Playoffs began long before opening night in August. Our football tournament is like none other sponsored by the MHSAA – it’s the only team tournament in which every team doesn’t qualify – and we began talking about this tournament not long after last season’s champions were decided.
Then came April and May and tracking down schedules for 613 MHSAA varsity football teams, plus 45 out-of-state opponents our Michigan schools were set to play including 14 from Ontario and one from Minnesota.
The fun part was monitoring the scores and standings for all of these teams over the nine weeks of the regular season, each Friday night a stream of chatter from kickoff into our weekly highlights show on Fox Sports Detroit.
And then came Sunday – and navigating the most difficult maps to draw in my four seasons assisting in the process.
We often have versions “a” and “b” and on occasion “c” when considering which best accomplishes our goal – to create the correct geographical picture for each of eight 11-player divisions and our 8-player bracket.
Sunday morning, we saw a version “e” for the first time I can remember and some shapes that didn’t make much sense without explanation.
Some of those explanations are below – the stories behind how we made some of the toughest decisions. I start with a quick history lesson you can skip if you’re familiar with this annual report or our playoff selection process in general, then move into some of the specifics many will be discussing this week as they begin focusing on their Pre-District opponents. (Click for the full schedule.)
The process
Our past: The MHSAA playoff structure – with 256 teams in eight divisions, and six wins equaling an automatic berth (or five wins for teams playing eight or fewer games) – debuted in 1999. An 8-player tournament was added in 2011, resulting in nine champions total each season.
The first playoffs were conducted in 1975 with four champions. Four more football classes were added in 1990 for a total of eight champions each fall. Through 1998, only 128 teams made the postseason, based on their playoff point averages within regions (four for each class) that were drawn before the beginning of the season. The drawing of Districts and Regions after the end of the regular season did not begin until the most recent playoff expansion.
In early years of the current process, lines were drawn by hand. Dots representing qualifying schools were pasted on maps, one map for each division, and those maps were then covered by plastic sheets. Districts and Regionals literally were drawn with dry-erase markers.
Our present: After a late Saturday night tracking scores, we file in as the sun rises Sunday morning for a final round of gathering results we may still need (which can include making a few early a.m. calls to athletic directors). Re-checking and triple-checking of enrollments, what schools played in co-ops and opted to play as a higher class start a week in advance, and more numbers are crunched Sunday morning as the fields are set.
This season, there were 229 automatic qualifiers by win total – with the final 27 at-large then selected, by playoff-point average, one from each class in order (A, B, C, D) until the field is filled.
Those 256 11-player teams are then split into eight equal divisions based on enrollment, and their locations are marked on digital maps that are projected on wall-size screens and then discussed by nearly half of the MHSAA staff plus a representative from the Michigan High School Football Coaches Association. Only the locations themselves are marked (by yellow dots) – not records, playoff point averages or names of the schools or towns. In fact, mentions of those are strictly prohibited. Records and playoff points are not part of the criteria. Matchups, rivalries, previous playoff pairings, etc. also DO NOT come into play.
The same process is followed for organizing the 8-player bracket, with the difference that the 16 teams are selected purely on playoff-point average.
Geography rules: This long has been rule number one for drawing MHSAA brackets in any sport, and is a repeat as well for those who have read this report the last three Octobers. Travel distance and ease DO come into play. Jumping on a major highway clearly is easier than driving across county-wide back roads, and that’s taken into consideration. Also, remember there’s only one Mackinac Bridge and hence only one way to cross between peninsulas – and boats are not considered a possible form of transportation. When opponents from both peninsulas will be in the same District, distance to the bridge is far more important than as the bird flies.
Tradition doesn’t reign: Every group of 32 dots is a new group – these 32 teams have not been placed in a bracket together before. That said, how maps have been drawn in the past isn’t considered – it’s hard to say a division has been drawn in a certain way traditionally when this set of 32 teams is making up a division for the first time.
Observations and answers: 2014
Class A ripple: A total of 80 Class A teams qualified for the playoffs in 2013 after three seasons of 79 each. But 89 Class A teams are part of the 2014 field, and that increase in turn shifted a number of smaller schools into different divisions – including some annual favorites. Muskegon, Division 2 runner-up the last two seasons, is in Division 3. Marine City, last season’s Division 4 champion, will play in Division 5. Five-time Division 5 champ Jackson Lumen Christi moved into Division 6, where it could be the toughest obstacle as Ithaca attempts to win that division for the fifth straight season.
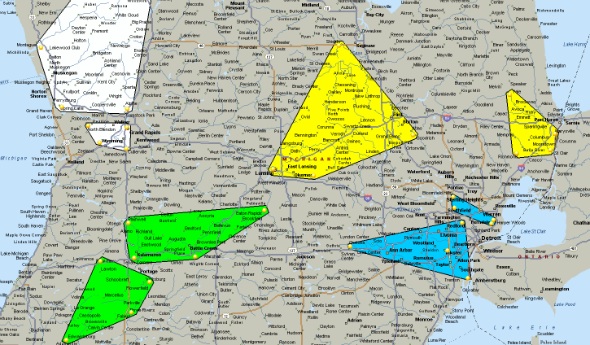
Stranger on paper: Yes, Division 1’s District 2 stretches from Grandville to Hartland. This isn’t a desirable outcome, but was necessary with this field. Six districts are filled with teams all east of U.S. 23, and a seventh is completely north and west of Grand Rapids. That left the four teams in the middle – Grandville, East Kentwood, Grand Ledge and Hartland.
Something similar came down in the 8-player bracket – why would we break up four teams in the Thumb to include three with Big Rapids Crossroads Academy all the way west of U.S. 127? It had to do with creating the appropriate semifinal matchup for whichever team emerges from the Rapid River/Cedarville/Engadine/Bellaire regional; keeping the Thumb teams together might’ve meant Lawrence or Waldron from near the Indiana border going all the way to Rapid River instead of Thumb teams that are still far away but closer to the convenient highways.
Line falls through Warren: Division 2 presented a few challenges. There are five districts made up of schools predominantly in the Greater Detroit and Port Huron areas, so one was going to end up potentially matching up farther from home. At first we drew a region across the bottom of the Lower Peninsula that connected teams from the Kalamazoo/Battle Creek area with a district from Ypsilanti and south of Detroit. But rearranging districts to draw a line between Warren DeLaSalle and Warren Counsino, although they’re nearly neighbors, helped make the rest of the map much cleaner – and eliminated that I-94 Regional we didn’t prefer.
Deconstructing D3: This was another toughie given the locations of teams involved. Three districts are all east of U.S. 23 and south of Pontiac, and four more are all west and/or north of Greater Lansing. Usually the Lansing area has a large share of Division 3 qualifiers – but not this season. So that left five schools somewhat without a sure home – St. Johns, DeWitt, Mason, Tecumseh and Linden. DeWitt is much closer to Mason and even Tecumseh, with the differences between St. Johns and DeWitt to Linden and St. Johns and DeWitt to Grand Rapids small enough to cancel out in the big picture.
Stretching Division 6: In the end, this map looks good – but there was a lot of conversation. The tough part was finding the fairest possible situation for whichever district champ might end up playing Negaunee – Bad Axe in the Thumb, Madison Heights Madison or Warren Michigan Collegiate as possibilities coming out of northern Detroit, or even Fennville near Lake Michigan south of Holland. Proximity to I-75 helped make this decision.
Crisscrossing Division 8: Figuring out this bracket started out easy enough with eight teams in the Upper Peninsula or just south of Mackinac Bridge and with the southwest and southeast Lower Peninsula set. But a group of 10 across the top of the Lower Peninsula – including neighbors Mount Pleasant Sacred Heart, Beal City and Coleman – made this interesting. A rule of thumb is we don’t want a team passing through a different district or regional to reach its opponent – and with three teams so closely bunched, that was a challenge in drawing this one out.
At the end of the day ...
What you see is what our committee decided upon after multiple discussions among multiple groups that broke down every sensible possibility we could muster. There are certainly points open to argument – and we likely made those arguments as well.
In the end, we present a group of dots on a map – as stated above, we don’t identify the schools until after the groupings are drawn. Part of the fun is then finding out what first-round matchups we’ve created: Muskegon Mona Shores vs. Caledonia and Detroit Martin Luther King vs. Southfield should be incredible, as well as the Ishpeming/Westwood and Iron Mountain/West Iron County rivalry games in the Upper Peninsula.
And no doubt, those who play for and support Burton Atherton, Ypsilanti Community, first-year Lapeer High School, Big Rapids Crossroads and New Haven Merritt Academy are ready to enjoy the playoff ride for the first time.
We’re excited to watch them all – and see which end up in Detroit with us to finish the fall over Thanksgiving weekend. We hope to see you there as well.
PHOTO: The Division 4 map for 11-player football has each region shaded; champion of the white plays green in a semifinal with yellow facing blue in the other.
Drive for Detroit: Week 5 in Review
September 24, 2018
By Geoff Kimmerly
Second Half editor
Friday night football this past week gave us improbable scores like 6-4 and 6-2.
 But they only foreshadowed some of the unexpected we’re celebrating in this week’s Drive for Detroit review – including big-time performances by Jenison, Houghton and newly-clinched league champion Manistee, to name just a few.
See below for our look at 45 results from the weekend that particularly stood out. Some are as you’d expect – significant tilts like Davison/Grand Blanc, Clinton Township Chippewa Valley/Macomb Dakota and Brighton/Canton. But many more will become more noteworthy as well as these next four weeks determine league champions and 288 teams that continue into the playoffs.
“Drive for Detroit” is powered by MI Student Aid.
Bay & Thumb
HEADLINER Davison 49, Grand Blanc 7 The Saginaw Valley League Blue race, at least for now, is down to Davison and Lapeer after the Cardinals (5-0) came up big in a matchup of previously undefeated teams. It was Davison’s first regular-season matchup with the Bobcats (4-1) since 2011, but extended a winning streak over the new league foe to two including a 2016 playoff victory. Click for more from the Flint Journal and see below for highlights from WJRT.
Davison scores 49 straight points to shock Grand Blanc in the battle of unbeatens in the Saginaw Valley League. @DavisonMade @DavCardFootball @DavisonSchools @grandblancath @GB_Bobcat_FB @cannonbhall14 @MichaelJamers17 @caleb_smith17)https://t.co/0GJcxqSPwk
— ABC12WJRT (@ABC12WJRT) September 22, 2018
Also of note: Flint Hamady 46, Swartz Creek 28 The Hawks (5-0) earned some pride for the Genesee Area Conference Blue with a nice win over the Flint Metro League-leading Dragons (4-1).
Remember this one: Beaverton 21, Harrison 0 The Beavers (4-1) held on to first place in the Jack Pine Conference with second-place Clare coming up in two weeks; Harrison (2-3) must win out to guarantee a fifth straight playoff berth.
More shoutouts: Almont 60, Croswell-Lexington 26 The Raiders (5-0) remain tied for first in the Blue Water Area Conference with Richmond after a nice win over the playoff-hopeful Pioneers (3-2). Harbor Beach 36, Ubly 28 The Pirates (4-1) beat Ubly (3-2) for the third time in two seasons (they also met in a playoff opener a year ago) to stay within striking distance of Greater Thumb Conference East leader Sandusky, which they’ll see in Week 8.
Greater Detroit
HEADLINER: Clinton Township Chippewa Valley 24, Macomb Dakota 17 The Big Reds (5-0) are holding down a first-place tie in the Macomb Area Conference Red with Romeo after handing Dakota (4-1) its first defeat. Chippewa Valley broke free in the third quarter and held off the Cougars in the fourth. Click for more from the Macomb Daily and see highlights below from State Champs Sports Network.
??VIDEO: Check out the highlights of the Chippewa Valley (@CVBigReds - @ChippewaSports) vs. Macomb Dakota game from last night pic.twitter.com/gxg9kXmk1n
— STATE CHAMPS! (@statechampsnet) September 22, 2018
Also of note: Detroit Catholic Central 21, Birmingham Brother Rice 0 It looks like the Shamrocks (4-1) and Warren DeLaSalle will determine the Detroit Catholic League Central title with a solid Brother Rice team taking losses from both in back-to-back weeks to fall to 3-2.
Remember this one: Riverview Gabriel Richard 57, Macomb Lutheran North 54 (4OT) The Pioneers (3-2) set themselves up to play for the Catholic League Intersectional 1 title by outlasting the Mustangs (4-1), who already have more wins than all of last year.
More shoutouts: Detroit Mumford 28, Detroit Cody 22 The Mustangs (3-2) stayed atop the Detroit Public School League Green with a Week 7 matchup with Cass Tech likely to decide the champ – but Cody (4-1) gets a chance against the Technicians first next week. Livonia Churchill 41, Livonia Franklin 35 The Chargers (3-2) avenged last season’s playoff loss to Franklin (3-2), which eventually went on to the Division 2 Semifinals after winning that District title meeting by two.
Mid-Michigan
HEADLINER: Brighton 23, Canton 17 (OT) Brighton quarterback Will Jontz (also a member of the MHSAA Student Advisory Council) is piling up highlights this season, and a few Friday might eventually lead to his team locking down the Kensington Lakes Activities Association West title. Jontz threw a touchdown pass to put the Bulldogs (4-1) ahead in the fourth quarter and another one in overtime as Brighton stayed atop the league and sent Canton (3-2) into a tie for second. Click for more from the Observer & Eccentric.
Also of note: Portland 16, Lansing Catholic 8 The Capital Area Activities Conference White lead belongs to the Raiders (5-0), who followed Jacob Veale’s 200 yards rushing and a defense that is giving up four points per game. Lansing Catholic (4-1) was strong defensively as well – a great sign especially if these teams meet again in the playoffs for the third time in four seasons.
Remember this one: DeWitt 37, East Lansing 0 The potential “game of the year” in the Lansing area didn’t turn into a titanic battle this time. DeWitt (5-0) moved into first place alone in the CAAC Blue, but East Lansing (4-1) could have another opportunity if these teams meet in the playoffs as was the case in 2016.
More shoutouts: New Lothrop 28, Ovid-Elsie 10 The Hornets (5-0) have solid footing in the first-year Mid-Michigan Activities Conference after sending the Marauders (3-2) into a tie for second, and having already defeated the other second-place team, Byron. Williamston 28, Haslett 14 The Hornets (4-1) seemed on the outside of the CAAC Red race after falling to St. Johns in Week 4, but might be back in after handing Haslett (4-1) its first loss and with the Vikings taking on the Redwings this week.
Northern Lower Peninsula
HEADLINER: Manistee 35, Muskegon Orchard View 20 The Chippewas (5-0) clinched a share of the Lakes 8 Conference title as they continue to reverse from last season’s 2-7 finish. The title is Manistee's first in reportedly decades. Click for more from the Manistee News Advocate and see highlights below from MI Sports Now.
Manistee holds off Orchard View to lock up share of Lakes 8 Conference title https://t.co/isgcpB8Mv9 pic.twitter.com/SedR0aJAJe
— MISportsNow (@MISportsNow) September 22, 2018
Also of note: McBain 12, Leroy Pine River 7 The Ramblers (3-2) fell to reigning champion Lake City 14-12 in Week 3, but are still affecting the Highland Conference race. With this win, McBain knocked Pine River (4-1) out of a tie with Lake City for first place, but the Bucks can take back a share of the top spot this week against the Trojans.
Remember this one: Oscoda 16, Rogers City 0 Since falling to Houghton Lake 30-22 in Week 1, Oscoda hasn’t given up more than eight points in game – and shutting out Rogers City (4-1) put the Owls (4-1) in first place alone in the North Star League.
More shoutouts: Cheboygan 40, Benzie Central 36 The Chiefs (3-2) have won three straight as they seek their first winning record since 2013, and tripping up improved Benzie Central (3-2) should provide additional boost. Traverse City Central 28, Gaylord 0 The Trojans (4-1) bounced back from a seven-point Week 4 loss to Traverse City West by handing Gaylord (4-1) its first defeat.
Southeast & Border
HEADLINER: Adrian Lenawee Christian 14, Athens 12 The Indians (3-1) still have given up only 14 points this season. But the Cougars (5-0) will take posting a season low to earn a key win in a Southern Central Athletic Association that is particularly strong defensively this fall – three teams are giving up fewer than six points per game and the fourth a respectable 22. Click for more from the Adrian Daily Telegram.
Also of note: Jackson 29, Chelsea 20 The Vikings (5-0) are off to their best start at least in modern history, with more wins already than all of last season and now one of their best over reigning Southeastern Conference White champion Chelsea (3-2). Jackson plays league co-leader Ypsilanti Lincoln this week.
Remember this one: Clinton 28, Sand Creek 27 The Redskins (4-1) are back in Tri-County Conference contention for the first time since winning the league four straight seasons from 2012-15. Sand Creek (3-2) can still make some noise as well as both have undefeated Ottawa Lake Whiteford coming up.
More shoutouts: Blissfield 14, Dundee 9 The Royals (4-1) have won four straight to move into a first-place tie in the Lenawee County Athletic Association with Hillsdale, this week’s opponent. Dundee (3-2), however, continued to look capable of earning its first playoff berth since 2012 despite tough competition over the next four weeks. Pittsford 17, Climax-Scotts 16 The other SCAA matchup this week saw Pittsford (5-0) also gain a valuable win against a Panthers team that is 1-3 but with two defeats by a touchdown or less.
Southwest Corridor
HEADLINER: Schoolcraft 45, Delton Kellogg 21 Five of six teams in the Southwestern Athletic Conference Valley have winning records, but Schoolcraft (4-1) knocked Delton Kellogg (4-1) from among the undefeated in their league opener. The Panthers were averaging 42 points per game before Schoolcraft held them to half that. Click for more from FOX 17.
Schoolcraft 45, Delton-Kellogg 21 @SCSEagles1 https://t.co/EPcvy809NC
— FOX 17 Blitz (@FOX17Blitz) September 22, 2018
Also of note: Battle Creek Central, 27, Benton Harbor 26 The Bearcats (4-1) bounced back from a tough Week 4 loss to guarantee their best finish since 2015 and edge closer to their first playoff berth since 2008. Benton Harbor fell to 1-3 but can earn a fourth straight playoff berth by winning their last four regular-season games.
Remember this one: Decatur 6, Hartford 0 The Raiders (3-2) avenged a one-point loss from last year and made this one particularly painful as Hartford (4-1) was looking like one of the new contenders in the Southwest 10 Conference.
More shoutouts: Kalamazoo United 77, Watervliet 20 Kalamazoo (5-0) upped its scoring average to nearly 64 points per game in this big win over reigning Valley champ Watervliet (2-3). White Pigeon 18, Mendon 8 White Pigeon (3-2) defeated the Hornets (3-2) for the first time since 1998.
Upper Peninsula
HEADLINER: Houghton 38, Gwinn 0 This might have caught some off-guard; Gwinn (4-1) was undefeated and Houghton opened this fall 0-3. But with two straight wins, the Gremlins have one more than all of last season – and a chance to keep building heading into the second half of their league schedule. Click for more from the Houghton Daily Mining Gazette.
Also of note: Gladstone 28, Maple City Glen Lake 8 The Braves (3-2) broke through last season for their first playoff berth since 2008, and to earn a return needs wins like this one over Glen Lake (2-3). With only eight games on the regular-season schedule this fall, Gladstone must win two of the next three to secure a repeat bid.
Remember this one: Munising 24, Hancock 21 The Mustangs (2-3) looked headed toward a third straight season without playoffs, but started a potential bounce back by handing Hancock (2-3) another tough defeat. The Bulldogs’ three losses came over the last three weeks and by a combined six points.
More shoutouts: Lake Linden-Hubbell 34, L’Anse 8 It’s been a tough start for the Lakes (1-4), but breaking L’Anse’s three-game winning streak was a nice way to begin a rebound. Ishpeming 36, Negaunee 26 The Hematites (5-0) broke a two-game losing streak against the longtime rival Miners (2-3).
West Michigan
HEADLINER: Jenison 20, Hudsonville 12 This wasn’t a league game – but it was a massive win for the Wildcats (4-1). After two straight 5-4 finishes, Jenison is two wins from earning its first playoff berth since 2003 – and after handing a first loss this season to Ottawa-Kent Conference Red contender Hudsonville, the first time Jenison has defeated the Eagles since 2003 as well. Click for more from WOOD TV and see additional highlights below from WZZM.
Jenison erases early deficit to beat Hudsonville https://t.co/sH1bqXpllp pic.twitter.com/LumEuF50mK
— 13 On Your Sidelines (@13OYSL) September 22, 2018
Also of note: East Kentwood 37, Grandville 30 Back in the O-K Red, the Falcons (4-1) continued to look like the other team to beat in edging Grandville (2-3). East Kentwood faces Hudsonville in Week 8.
Remember this one: Grand Rapids Northview 33, Grand Rapids Forest Hills Central 0 This was among the weekend’s surprises as Forest Hills Central (2-3) had won the last two meetings between these teams by 28 and 35 points. Northview (3-2) has more wins this fall than in its last two seasons combined.
More shoutouts: Hopkins 58, Grand Rapids NorthPointe Christian 21 The Vikings (4-1) sit atop the O-K Silver after avenging last season’s 14-point loss to NorthPointe (3-2). Hudsonville Unity Christian 38, Grand Rapids South Christian 14 Also a nonleague game, but downing the Sailors (3-2) was a great way for the Crusaders (5-0) to get ready for the toughest of their O-K Green matchups.
8-Player
HEADLINER: Wyoming Tri-unity Christian 28, Onekama 26 If Tri-unity Christian wins the Midwest Central Michigan Conference West, this one will be looked back upon frequently. The Defenders (5-0) have handed first losses of the season in back-to-back weeks to Suttons Bay and now Onekama (4-1), respectively, and next up get reigning 8-player Division 1 champion Central Lake. Click for more from the Manistee News Advocate.
Also of note: Deckerville 38, Kingston 20 The North Central Thumb League Blue has five teams with winning records out of six total, and Deckerville (3-2) is tied for first after handing Kingston (4-1) its lone defeat.
Remember this one: Engadine 39, Cedarville 26 The Eagles (4-1) already have lost to Great Lakes Conference East leader Pickford, but will be waiting if the undefeated Panthers trip up – especially against the Trojans (3-2) in Week 9.
More shoutouts: Bellevue 48, Portland St. Patrick 35 The Broncos (4-1) made it two straight over the Shamrocks (3-2), last season’s 8-player Division 2 runners-up. Camden-Frontier 42, Battle Creek St. Phillip 20 The Redskins (4-1) had little time to be disappointed after a Week 4 loss to Bellevue, and came back quickly to hand the Tigers (3-2) their second straight defeat.
Second Half’s weekly “Drive for Detroit” previews and reviews are powered by MI Student Aid, a part of the Student Financial Services Bureau located within the Michigan Department of Treasury. MI Student Aid encourages students to pursue postsecondary education by providing access to student financial resources and information, including various student financial assistance programs to help make college more affordable for Michigan students. MI Student Aid administers the state’s 529 savings programs (MET/MESP) and eight additional aid programs within its Student Scholarships and Grants division. Click for more information and connect with MI Student Aid on Facebook and Twitter @mistudentaid.
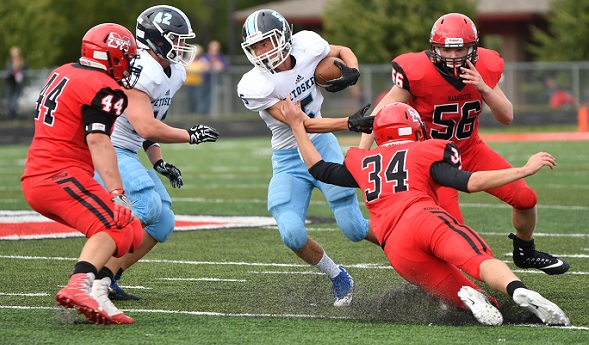
PHOTO: Petoskey's Mason Doe-Nimphie (5) is surrounded by Marquette’s Brady Wright (34), Ethan Hayes (44), and Beau Zorza (56) during the Northmen’s win Saturday. (Photo by Cara Kamps.)