
Inside Selection Sunday: Mapnalysis '14
October 26, 2014
By Geoff Kimmerly
Second Half editor
The pictures we drew Sunday morning at the MHSAA office won’t be found hanging on anyone’s walls.
But we worked toward something suitable for framing, designing this season’s football playoff brackets while considering the months and years of work put in by our schools and their teams, parents and fans to earn an opportunity to continue their seasons this weekend.
The work completed today to draw up the 2014 MHSAA Football Playoffs began long before opening night in August. Our football tournament is like none other sponsored by the MHSAA – it’s the only team tournament in which every team doesn’t qualify – and we began talking about this tournament not long after last season’s champions were decided.
Then came April and May and tracking down schedules for 613 MHSAA varsity football teams, plus 45 out-of-state opponents our Michigan schools were set to play including 14 from Ontario and one from Minnesota.
The fun part was monitoring the scores and standings for all of these teams over the nine weeks of the regular season, each Friday night a stream of chatter from kickoff into our weekly highlights show on Fox Sports Detroit.
And then came Sunday – and navigating the most difficult maps to draw in my four seasons assisting in the process.
We often have versions “a” and “b” and on occasion “c” when considering which best accomplishes our goal – to create the correct geographical picture for each of eight 11-player divisions and our 8-player bracket.
Sunday morning, we saw a version “e” for the first time I can remember and some shapes that didn’t make much sense without explanation.
Some of those explanations are below – the stories behind how we made some of the toughest decisions. I start with a quick history lesson you can skip if you’re familiar with this annual report or our playoff selection process in general, then move into some of the specifics many will be discussing this week as they begin focusing on their Pre-District opponents. (Click for the full schedule.)
The process
Our past: The MHSAA playoff structure – with 256 teams in eight divisions, and six wins equaling an automatic berth (or five wins for teams playing eight or fewer games) – debuted in 1999. An 8-player tournament was added in 2011, resulting in nine champions total each season.
The first playoffs were conducted in 1975 with four champions. Four more football classes were added in 1990 for a total of eight champions each fall. Through 1998, only 128 teams made the postseason, based on their playoff point averages within regions (four for each class) that were drawn before the beginning of the season. The drawing of Districts and Regions after the end of the regular season did not begin until the most recent playoff expansion.
In early years of the current process, lines were drawn by hand. Dots representing qualifying schools were pasted on maps, one map for each division, and those maps were then covered by plastic sheets. Districts and Regionals literally were drawn with dry-erase markers.
Our present: After a late Saturday night tracking scores, we file in as the sun rises Sunday morning for a final round of gathering results we may still need (which can include making a few early a.m. calls to athletic directors). Re-checking and triple-checking of enrollments, what schools played in co-ops and opted to play as a higher class start a week in advance, and more numbers are crunched Sunday morning as the fields are set.
This season, there were 229 automatic qualifiers by win total – with the final 27 at-large then selected, by playoff-point average, one from each class in order (A, B, C, D) until the field is filled.
Those 256 11-player teams are then split into eight equal divisions based on enrollment, and their locations are marked on digital maps that are projected on wall-size screens and then discussed by nearly half of the MHSAA staff plus a representative from the Michigan High School Football Coaches Association. Only the locations themselves are marked (by yellow dots) – not records, playoff point averages or names of the schools or towns. In fact, mentions of those are strictly prohibited. Records and playoff points are not part of the criteria. Matchups, rivalries, previous playoff pairings, etc. also DO NOT come into play.
The same process is followed for organizing the 8-player bracket, with the difference that the 16 teams are selected purely on playoff-point average.
Geography rules: This long has been rule number one for drawing MHSAA brackets in any sport, and is a repeat as well for those who have read this report the last three Octobers. Travel distance and ease DO come into play. Jumping on a major highway clearly is easier than driving across county-wide back roads, and that’s taken into consideration. Also, remember there’s only one Mackinac Bridge and hence only one way to cross between peninsulas – and boats are not considered a possible form of transportation. When opponents from both peninsulas will be in the same District, distance to the bridge is far more important than as the bird flies.
Tradition doesn’t reign: Every group of 32 dots is a new group – these 32 teams have not been placed in a bracket together before. That said, how maps have been drawn in the past isn’t considered – it’s hard to say a division has been drawn in a certain way traditionally when this set of 32 teams is making up a division for the first time.
Observations and answers: 2014
Class A ripple: A total of 80 Class A teams qualified for the playoffs in 2013 after three seasons of 79 each. But 89 Class A teams are part of the 2014 field, and that increase in turn shifted a number of smaller schools into different divisions – including some annual favorites. Muskegon, Division 2 runner-up the last two seasons, is in Division 3. Marine City, last season’s Division 4 champion, will play in Division 5. Five-time Division 5 champ Jackson Lumen Christi moved into Division 6, where it could be the toughest obstacle as Ithaca attempts to win that division for the fifth straight season.
Stranger on paper: Yes, Division 1’s District 2 stretches from Grandville to Hartland. This isn’t a desirable outcome, but was necessary with this field. Six districts are filled with teams all east of U.S. 23, and a seventh is completely north and west of Grand Rapids. That left the four teams in the middle – Grandville, East Kentwood, Grand Ledge and Hartland.
Something similar came down in the 8-player bracket – why would we break up four teams in the Thumb to include three with Big Rapids Crossroads Academy all the way west of U.S. 127? It had to do with creating the appropriate semifinal matchup for whichever team emerges from the Rapid River/Cedarville/Engadine/Bellaire regional; keeping the Thumb teams together might’ve meant Lawrence or Waldron from near the Indiana border going all the way to Rapid River instead of Thumb teams that are still far away but closer to the convenient highways.
Line falls through Warren: Division 2 presented a few challenges. There are five districts made up of schools predominantly in the Greater Detroit and Port Huron areas, so one was going to end up potentially matching up farther from home. At first we drew a region across the bottom of the Lower Peninsula that connected teams from the Kalamazoo/Battle Creek area with a district from Ypsilanti and south of Detroit. But rearranging districts to draw a line between Warren DeLaSalle and Warren Counsino, although they’re nearly neighbors, helped make the rest of the map much cleaner – and eliminated that I-94 Regional we didn’t prefer.
Deconstructing D3: This was another toughie given the locations of teams involved. Three districts are all east of U.S. 23 and south of Pontiac, and four more are all west and/or north of Greater Lansing. Usually the Lansing area has a large share of Division 3 qualifiers – but not this season. So that left five schools somewhat without a sure home – St. Johns, DeWitt, Mason, Tecumseh and Linden. DeWitt is much closer to Mason and even Tecumseh, with the differences between St. Johns and DeWitt to Linden and St. Johns and DeWitt to Grand Rapids small enough to cancel out in the big picture.
Stretching Division 6: In the end, this map looks good – but there was a lot of conversation. The tough part was finding the fairest possible situation for whichever district champ might end up playing Negaunee – Bad Axe in the Thumb, Madison Heights Madison or Warren Michigan Collegiate as possibilities coming out of northern Detroit, or even Fennville near Lake Michigan south of Holland. Proximity to I-75 helped make this decision.
Crisscrossing Division 8: Figuring out this bracket started out easy enough with eight teams in the Upper Peninsula or just south of Mackinac Bridge and with the southwest and southeast Lower Peninsula set. But a group of 10 across the top of the Lower Peninsula – including neighbors Mount Pleasant Sacred Heart, Beal City and Coleman – made this interesting. A rule of thumb is we don’t want a team passing through a different district or regional to reach its opponent – and with three teams so closely bunched, that was a challenge in drawing this one out.
At the end of the day ...
What you see is what our committee decided upon after multiple discussions among multiple groups that broke down every sensible possibility we could muster. There are certainly points open to argument – and we likely made those arguments as well.
In the end, we present a group of dots on a map – as stated above, we don’t identify the schools until after the groupings are drawn. Part of the fun is then finding out what first-round matchups we’ve created: Muskegon Mona Shores vs. Caledonia and Detroit Martin Luther King vs. Southfield should be incredible, as well as the Ishpeming/Westwood and Iron Mountain/West Iron County rivalry games in the Upper Peninsula.
And no doubt, those who play for and support Burton Atherton, Ypsilanti Community, first-year Lapeer High School, Big Rapids Crossroads and New Haven Merritt Academy are ready to enjoy the playoff ride for the first time.
We’re excited to watch them all – and see which end up in Detroit with us to finish the fall over Thanksgiving weekend. We hope to see you there as well.
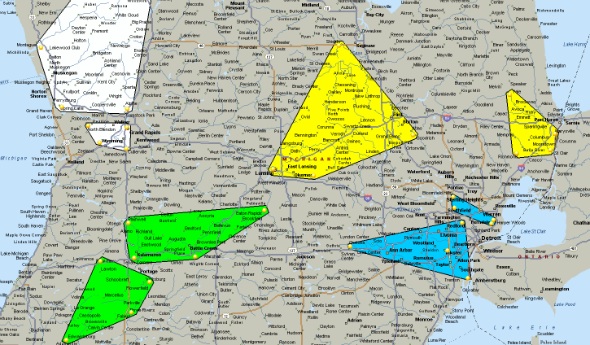
PHOTO: The Division 4 map for 11-player football has each region shaded; champion of the white plays green in a semifinal with yellow facing blue in the other.

Muskegon's Quest: 800 Wins & Counting
By
Ron Pesch
MHSAA historian
September 24, 2015
Editor's note: The Muskegon High School football program became the first in Michigan high school history to win 800 games when it defeated Grandville 39-12 on Sept. 11.
Longtime MHSAA historian Ron Pesch is the foremost expert on Muskegon Big Reds football; he even wrote the book celebrating the program's first 100 years in 1994. Below, he recounts his start in uncovering Muskegon's rich past and notes many of the highlights on the way to this season's milestone victory – as well as his "journey" starting with instructor's criticisms and finishing with the publishing of "Muskegon Big Reds: 100 Years of Football."
“This is all very interesting, but what good is it? What can you tell from all this data? Are there any patterns you can ascertain? Changes in size of the schools played?”
So began the journey to 800.
The newest version of a high school in Muskegon opened in the fall of 1893. Two years later, in the fall of 1895, the Muskegon High Athletic Association was organized with the goal of assembling a football team “fully capable of sustaining Muskegon’s reputation in athletics.”
Under the guidance of Mr. Edward Taylor, a teacher at the high school, whose influence led to the creation of the organization, the club was formed, with Louis Udell named to serve as president, while John Miller acted as vice-president, Louis Brock as secretary and Vernor Page as treasurer. “A committee of three … was appointed to select from pupils of the High School a sufficient number to form a Foot Ball Team.”
Practices were scheduled and challenges quickly came from teams in Grand Rapids, Ann Arbor, Big Rapids, Ionia, and the Ferris Business College in Muskegon. The first game was scheduled against the Business College for Saturday, November 2 at the baseball grounds, at the terminus of the Pine Street railway line.
A stiff breeze had to be contended with, but good straight play was a feature of the game. The high school was defeated by the heavier squad assembled by Business College, 12-8. It was a start.
 The next two contests were cancelled due to weather. On November 23, 1895 at 12:35 p.m., Muskegon boarded a train for Grand Haven. At 3 p.m., the contest, featuring two halves of 30 minutes each, was played. When the final whistle blew, MHS had its first-ever victory.
The details of what occurred over the next 80 or so years were then buried in yearbooks, newspaper accounts and in the memories of hundreds of Muskegon athletes.
As it turned out, no one was compiling the wins. No one had tried to see the forest through the trees.
“A disappointing paper. Very little narrative and practically no analysis or insight. I realize it must have been difficult to put together the team records, but what use are they?”
Like most schools, Muskegon did produce a yearbook, and, in the early days, a monthly magazine that detailed the success and failures of individual games and seasons. Unfortunately, there were years where magazines or annuals simply didn’t exist, or results weren’t listed.
For 11 seasons, I couldn’t find the scores. Scanning the forest of newsprint on microfilm from those early years, when the results of sporting events were mixed in with the news of the day, often proved of little help.
“You do not even total them up for an overall record. Services are not understood.”
Larry Harp inherited a talented squad from his predecessor, after head coach Roger Chiaverini opted to jump across town to lead the Crusaders of Muskegon Catholic in the fall of 1971. In Harp’s first year as head varsity coach, the Big Reds won a huge victory over previously unbeaten Traverse City before 10,000 fans at Hackley Stadium, ended the year undefeated, and were proclaimed Michigan’s Class A football state champions by the statewide media at season’s end. I was as proud as a 10-year-old could be that the high school that would be mine had won the crown.
But while I loved the game, I never played a down of football at Muskegon High School. Coach Harp was my gym teacher, but he understood, as a 4-foot-11 senior, I was as far as one could be from being all-state material.
Instead, fate had a different role for me. As a college student, I enrolled in a local history class. There I was assigned a term paper that would alter my path in life.
My paper would focus on football at Muskegon. By all accounts, the delivered product was limited in scope, comprised of hundreds of scores and some details on important people, games and interesting notes I found along the way.
I had 15 weeks, start to finish, molding a paper that was enlightening to me, but a major disappointment to my professors.
"What about comparing trends in Muskegon sports to trends elsewhere? Distance traveled to play opponents as roads improved, etc. Changes in Strategy? Use of specialized teams? What about even a listing of all-staters from Muskegon? Anything to make it worth your trouble."
I learned that in 1901, Dr. J.L. Williams was hired as the school’s first coach. Prior to that time, the team’s captain, fullback, or a volunteer served in the role. A parade of others followed Williams, including Robert Walker, a player on that first team who led Muskegon to its first undefeated season in 1904, and Mortimer Jones, a star in Muskegon’s backfield before the turn of the century, who in all likelihood was the first African-American to coach a high school team in Michigan, and perhaps beyond.
Within the collection of coaches was Robert Zuppke, who had accepted his first coaching job at Muskegon. His success led to a move to Oak Park High School in the suburbs of Chicago, where he won a pair of mythical national gridiron crowns before moving to the University of Illinois where his football squads totaled 131 victories, seven Big Ten titles and four mythical national championships over 29 seasons. With players like Harold "Red" Grange, George Halas and Potsy Clark, his innovative mind is credited with creating the screen pass and the “flea flicker” that advanced the game.
 As a sophomore at Muskegon, I had led tours through the school’s newly opened gymnasium building. Thanks to the research, I now better understood why the district had named the complex the Redmond/Potter gymnasium. Coach C. Leo Redmond guided Muskegon to seven mythical state football titles and a basketball crown, while his longtime assistant and successor, Harry Potter, led Muskegon to a gridiron championship in 1951. The quarterback of that team was Earl Morrall, later an All-American at Michigan State University and a 21-year veteran in the NFL.
The 1920s were Muskegon’s most successful decade, as the team won more than 85 percent of its games thanks to the leadership of J. Francis Jacks, who guided Muskegon to its first mythical state football title in 1920, then additional titles in 1921 and 1923. Like Potter years later, Jacks’ team in 1923 featured the skill of a future University of Michigan All-American, Bennie Oosterbaan, who is considered the greatest all-around athlete in the long rich history of the university. Following the sudden passing of Coach Jacks in the spring of 1924, the school hired Redmond, who would compile a 156-29-13 record as head coach over 22 seasons before retiring in 1946. Muskegon posted 28 straight winning seasons between 1919 and 1946.
The first instructor completed his assessment and graded the paper with a "C” ... The second added his note, tacked on a minus sign to the “C” and altered the score. Final grade – 70. Unlike most assignments from high school and college, when the semester ended, I did not toss this one out.
The final entry in the paper noted that Muskegon had finished the 1979 season with a 7-2-0 record and a Lake Michigan Athletic Conference championship. It was Coach Harp’s final year. He stepped down to become the school’s athletic director.
On the gridiron, Muskegon’s fortunes had begun to slip. Over the next three years, the team set school passing records galore, but posted a disappointing 8-19 record. A lone highlight was a 19-15 regular-season win over cross-town rival Muskegon Catholic Central in 1980. The Crusaders would go on to win the MHSAA Class B championship that year. It was Muskegon Catholic’s single loss during an otherwise flawless season, and Muskegon’s single victory that year.
 I continued digging into microfilm, and researching the history of football at Muskegon. Coach Harp cheered me on during my research, assisting where possible. Staff at our local library knew me by name.
As I neared completion of the list of scores, a pair of phone calls would lead to a startling discovery.
A call to Kalamazoo Central High School designed to cross-check scores of games played against the Maroon Giants guided me to a resident of the Kalamazoo area. My second call was to Dick Kishpaugh. Unknown to me, I had reached the state authority on high school sports.
Kishpaugh quickly recognized that Muskegon’s win total topped Michigan in all-time football wins and ranked among the top teams in the nation.
In the fall of 1983, Dave Taylor was named head coach at Muskegon, and quickly righted the ship. In 1985, I was presented with a chance to write a series of articles, based on my research, covering the history of high school football at Muskegon for the local newspaper.
The timing was remarkable, as the Big Reds scored their first appearance in the MHSAA football playoffs that same season. A year later, Taylor’s team won the school’s first playoff title. Led by an undersized defense, Muskegon upset Sterling Heights Stevenson 10-0 for the Class A title – its first since the MHSAA began a playoff system in 1975.
Taylor’s Big Reds won a second title in 1989. He spent 17 years at the helm, second in longevity to only Redmond, and compiled a 112-51-1 mark over the span.
In the fall of 1994, the project that began as a term paper hit the press. A fundraiser for the school’s Athletic Association, 100 Years of Muskegon Big Red Football, told the story of Muskegon’s gridiron past. Still offering little analysis, it did contain much more narrative, and a comprehensive look at the names and faces that guided the teams to success.
Taylor retired from teaching, but at the request of school administrators, remained in charge as the district sought a replacement. In 2000, Tony Annese, took the reins and, to the astonishment of many across the state, pushed the program to an even higher level. In nine seasons, his squads won three MHSAA Division 2 titles and totaled 92 victories in 107 games.
Perhaps the most surprising aspect of the road to 800 is the fact that a single school district has been able to sustain success on the football field for so long. In an environment of constant economic, demographic and personnel change, where the number of school districts serving students in the Muskegon area has ballooned in size beginning in the 1950s, the Big Reds continue to rack up victories against strong opponents.
 Matt Koziak took charge of the Muskegon program for a year before moving over to Mona Shores, where he has put together a squad that has emerged as a playoff contender after years of silence. Shane Fairfield was named head coach of the Big Reds beginning in 2010, and hasn’t missed a beat. His teams have earned three straight trips to Detroit’s Ford Field, where all three finished as runners-up to the MHSAA crown. Entering the season, Fairfield’s Big Reds have scored 52 victories against 13 defeats.
In the state of Michigan, Muskegon entered the 2015 season with a 798-273-43 record over 120 seasons of football. Ann Arbor Pioneer first started playing in 1891 and ranked second in wins, with a 714-422-38 record, while Menominee began the current season tops in the Upper Peninsula and third in the state with a 634-283-40 mark dating back to its start in 1894.
Muskegon picked up win number 800 on Friday, Sept. 11, with a 39-12 victory over Grandville, making the school only the 10th in the nation to reach the landmark. Victory 700 came in 2005, with Annese in charge, while victory 600 was earned by Taylor’s 1991 squad versus cross-town rival Mona Shores. Unbeknown at the time, Harp’s 1975 team scored the school’s 500th win. Redmond’s 1935 team tallied the school’s 250th, while Louis Gudelsky’s 1912 team was the one that grabbed win number 100. In total, the school has won 17 state titles, 12 mythical when a team with an unblemished season-ending record could lay claim, and five MHSAA crowns.
In the end, they are only games, but the educational value and impact on lives can be far reaching. Certainly for those who play and coach the game, and sometimes, even for those who simply play witness.
 Ron Pesch has taken an active role in researching the history of MHSAA events since 1985 and began writing for MHSAA Finals programs in 1986, adding additional features and "flashbacks" in 1992. He inherited the title of MHSAA historian from the late Dick Kishpaugh following the 1993-94 school year, and resides in Muskegon. Contact him at [email protected] with ideas for historical articles.
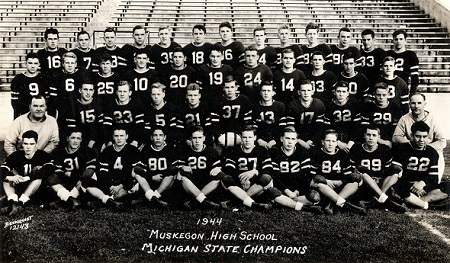
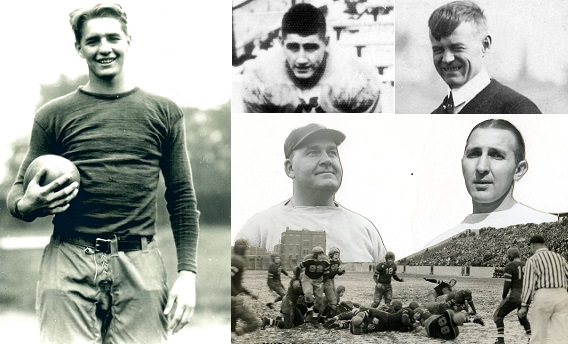
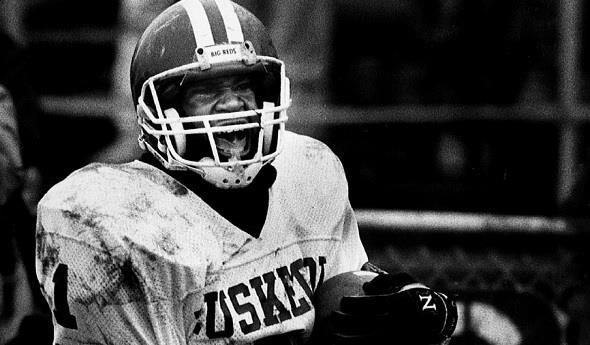
PHOTOS: (Top) The Muskegon football team readies for its entrance at Ford Field before last season's MHSAA Division 3 Final. (Middle top) The 1944 team was among those considered a "mythical state champion" before the introduction of MHSAA playoffs in 1975. (Middle) A number of Big Reds legends, clockwise from left: Bennie Oosterbaan, Earl Morrall, coach Robert Zuppke, coaches C. Leo Redmond and his rival, to the right, Muskegon Heights' Oscar E. "Okie" Johnson, over an action shot from their 1943 game. (Middle below) Marcus Longmire celebrates a touchdown during the 1989 playoff against Escanaba. (Below) Pesch's book, co-authored with Marc Okkonen, detailed the first 100 years of Muskegon football.