

Inside Selection Sunday: Mapnalysis '15
October 26, 2015
By Geoff Kimmerly
Second Half editor
Consider that one hour Sunday night was the product of nine weeks of games on top of two more weeks of practice, hours of lifting weights, conditioning and camps and a total of six months of work at the MHSAA office, in addition to hours upon hours put in by athletic directors scheduling years in advance.
The anticipation for the release of another year's MHSAA Football Playoff pairings is matched by a giant exhale only after the results are broadcast on Fox Sports Detroit, streamed online and posted on locker room doors and Facebook walls all over our state.
 And then the fun begins again.
But the Selection Sunday Show is the favorite hour of the season for many fans across our state. And that’s why, for the fifth year, we’ll explain our most difficult decisions in this Mapnalysis 2015 breakdown of how we paired 272 teams that will play next month for championships across nine divisions.
For those familiar with our playoff selection process, or who have read this report in the past and don’t want a refresher on how we do what we do, skip the next section and go directly to the “Observations & Answers: 2015.” For the rest, what follows is an explanation of how we selected the playoff pairings during the morning hours Sunday, followed by how we made some of the toughest decisions and a few thoughts on the breakdown of the field.
Ground Rules
Our past: The MHSAA 11-player playoff structure – with 256 teams in eight divisions, and six wins equaling an automatic berth (or five wins for teams playing eight or fewer games) – debuted in 1999. An 8-player tournament was added in 2011, resulting in nine champions total each season.
The first playoffs were conducted in 1975 with four champions. Four more football classes were added in 1990 for a total of eight champions each fall. Through 1998, only 128 teams made the postseason, based on their playoff point averages within regions (four for each class) that were drawn before the beginning of the season. The drawing of Districts and Regionals after the end of the regular season did not begin until the most recent playoff expansion.
In early years of the current process, lines were drawn by hand. Dots representing qualifying schools were pasted on maps, one map for each division, and those maps were then covered by plastic sheets. Districts and Regionals literally were drawn with dry-erase markers.
Our present: After a late Saturday night tracking scores, we file in as the sun rises Sunday morning for a final round of gathering results we may still need (which can include making a few early a.m. calls to athletic directors). Re-checking and triple-checking of enrollments, what schools played in co-ops and opted to play as a higher class start a week in advance, and more numbers are crunched Sunday morning as the fields are set.
This season, there were a record-low 216 automatic qualifiers by win total – with the final 40 at-large then selected, by playoff-point average, one from each class in order (A, B, C, D) until the field was filled. There were only four Class D additional qualifiers with 5-4 or 4-4 (playing eight games) records from which we could choose – so after those four we added 12 teams each from Class A, Class B and Class C.
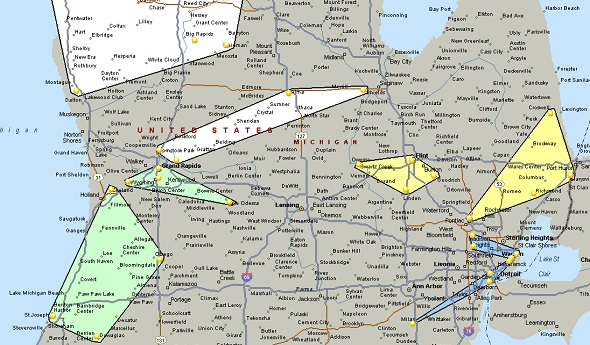
Those 256 11-player teams are then split into eight equal divisions based on enrollment, and their locations are marked on digital maps that are projected on wall-size screens and then discussed by nearly half of the MHSAA staff plus a representative from the Michigan High School Football Coaches Association. Only the locations themselves are marked (by yellow dots) – not records, playoff point averages or names of the schools or towns. In fact, mentions of those are strictly prohibited. Records and playoff points are not part of the criteria. Matchups, rivalries, previous playoff pairings, etc. also DO NOT come into play.
The same process is followed for organizing the 8-player bracket, with the difference that the 16 teams are selected purely on playoff-point average.
Geography rules: This long has been rule number one for drawing MHSAA brackets in any sport. Travel distance and ease DO come into play. Jumping on a major highway clearly is easier than driving across county-wide back roads, and that’s taken into consideration. Also, remember there’s only one Mackinac Bridge and hence only one way to cross between peninsulas – and boats are not considered a possible form of transportation. When opponents from both peninsulas will be in the same District, distance to the bridge is far more important than as the bird flies.
Tradition doesn’t reign: Every group of 32 dots is a new group – these 32 teams have not been placed in a bracket together before. How maps have been drawn in the past isn’t considered – it’s hard to say a division has been drawn in a certain way traditionally when this set of 32 teams is making up a division for the first time.
Observations & Answers: 2015
Go north with ease: For the most part, most Regional pairings were easier to draw than in past years. For the most part. Divisions 2 and 4 were not easy, specifically when it came to deciding which teams would be paired with an Upper Peninsula qualifier or a team from the Traverse City area. Keep in mind, distance on these maps isn’t based on how the bird flies, but how a bus would drive. In Division 2, that meant putting Muskegon, Muskegon Mona Shores and Grand Rapids Forest Hills Northern – near U.S. 31 and U.S. 131 – with Traverse City Central instead of sending Midland and Midland Dow west, up I-75 and then east-to-west again on more non-highway roads. In Division 4, we considered pairing Alma and Saginaw Swan Valley with Escanaba instead of Big Rapids and Remus Chippewa Hills. That decision came down to Big Rapids being about 14 miles closer to Escanaba than Swan Valley (Whitehall would go with Big Rapids and Chippewa Hills regardless.).
Four counties wide: Yes, on first glance it looks a little odd that Bay City John Glenn and Orchard Lake St. Mary’s would be in the same Division 3 District – but look at the map as a whole. Eight Division 3 teams are located south and mostly east of St. Mary’s, and John Glenn is the only team that could be considered in the northeastern quarter of the Lower Peninsula (Mount Pleasant and Gaylord are right down the middle and naturals to go with Sault Ste. Marie and Petoskey.). With the thumb playoff qualifiers of near-similar size in Division 4, there were no other options than to create this four-county trip between the Eaglets and Bobcats.
Semifinal selection: When all the Regional lines are drawn for a division, we also must figure out which Regionals will meet for Semifinals. This annually provides some challenges. Do we match east vs. west or north vs. south? If something seems iffy in four weeks when those games are played, again, keep in mind the entire map and entire Regionals that are matched up.
Scheduled strong: Because we’re looking only at dots on a map, we don’t see the matchups until everything is drawn – and in that way, we’re like everyone else. It wasn’t lost on us that two 9-0 teams will have road games this week or three 5-4 at-large qualifiers will be at home. For those 9-0 teams, it’s true: there’s nothing more they could’ve done on the field. But here’s why they will travel.
- Clinton, in Division 6, hasn’t lost a regular-season game since 2011, and in fact plays in a strong Tri-County Conference made up of Class C schools and one Class D. Four of eight from the league made the playoffs, and the competition was so strong that Morenci and Petersburg-Summerfield will host games in Division 8. But Clinton’s opponent, Monroe St. Mary Catholic Central, while it did have one loss, fell to one-loss Class B Lansing Catholic – and the Falcons played eight Class B and one Class A school this season. Beating a Class B team is worth 16 points more than beating a Class C and 32 more than beating a Class D (with those points then divided over the number of games a team plays that season) – and all of that made the difference in St. Mary’s final eight-point playoff average edge over Clinton.
- Saugatuck in Division 7 is a similar story. The Indians are one of three undefeated teams in their District, and did play a pair of Class B opponents. But by no fault of their own, especially in league play where the schedule is set, Saugatuck didn’t face a team this season that won more than five games. Hesperia played three Class B opponents including one that finished 6-3 – enough for the slim 1.8 points more in playoff average that earned the Panthers homefield advantage. Pewamo-Westphalia has the highest average in the District and didn’t play a Class B – the Pirates actually played three Class D teams. But they also beat four teams that made the playoffs including two that finished 8-1 – giving them a 2.7-point edge on Hesperia and 4.5 edge on Saugatuck.
- The 5-4 teams that will host – Redford Thurston in Division 3 and Escanaba and Benton Harbor in Division 4, all earned their spots. Escanaba faced six playoff teams and beat three, Class B Benton Harbor played eight Class A teams, and Thurston played five playoff teams and a sixth that just missed an at-large bid.
At the end of the day ...
What you see is what our committee decided upon after multiple discussions among multiple groups that broke down every sensible possibility we could muster. There are certainly points open to argument – and we likely made those arguments as well.
Those who would like to see the playoff selection process changed are in favor of a larger strength-of-schedule component, and it’s interesting to see how strength of schedule inadvertently made a larger impact this season than in the recent past – especially given the examples above of undefeated teams going on the road and at-large teams hosting.
Why were there fewer automatic qualifiers than ever before? Here's one theory. There were 11 fewer teams in 11-player football this season than in 2014 (most moved to 8-player). An argument can be made that there were fewer wins to be gained against teams that last season might have struggled to field 11-player teams, shifting the balance to fewer automatic qualifiers and more parity with stronger teams facing each other to fill their schedules.
Meanwhile, the 8-player field grew by nine teams this fall and has its strongest ever, with seven teams that finished 5-4 missing the postseason after a team with a sub-.500 record got in just a year ago.
Given how some matchups shook out this fall, the next argument by those seeking change likely will center on seeding entire Regionals instead of just Districts. But keep this in mind as well: if Regionals were seeded with this year's groupings, it would create possibilities of first-week trips like Battle Creek to Traverse City and Cedar Springs to Sault Ste. Marie. We're fairly sure most coaches and players would dread such journeys for a first-round game.
It's a lot to digest, and the scrutinizing will surely continue long after these playoffs are done as we all work to conduct the best tournament possible.
But at the end of the day – and the end of these next five weeks – to be the best, teams will need to beat the best no matter the matchups. And we’ve got plenty to look forward to starting this weekend and all the way through the 11-player Division 3 Final on Nov. 28 at Ford Field.
The MHSAA Football Playoffs are sponsored by the Michigan National Guard.
PHOTO: The Division 4 map was among the most difficult to draw during this year's selection process.

Eagles Stone-wall Bellaire in 8 Final
November 16, 2012
By Dean Holzwarth
Special to Second Half
GREENVILLE – Deckerville sophomore Ryan Stone had serious doubts about playing on the varsity team this year.
Stone thought he was better suited for the junior varsity. But following Friday night's MHSAA 8-player football championship game, everyone in the city of Deckerville is glad he opted for the jump to the next level.
The scrawny 5-foot-8, 140-pound Stone made perhaps the biggest play of the game as the Eagles survived a late rally from Bellaire to pull out a 14-12 victory at Greenville High School's Legacy Field.
Stone stopped Bellaire's two-point conversion run try short of the goal line with 49 seconds remaining to prevent a tie score and possible overtime.
“I was lined up and saw him coming around the corner,” Stone said. “I was hustling to him, hoping I could get him before he crossed the line. I just got to him.”
And doing so gave Deckerville its first MHSAA championship in its first Final appearance, to cap its first season in 8-player football. Bellaire made the switch to 8-player three seasons ago, and also made its first MHSAA Final appearance. The first 8-Player Final was last season.
On Friday’s game-saving play, Stone popped out his right shoulder and laid on the turf for several minutes while athletic trainers tended to him.
He eventually stood up and walked gingerly to the sidelines.
“I thought that was amazing,” said Deckerville senior fullback Chris Wolfe, who rushed for 108 yards on 20 carries and scored a touchdown.
“To put his body at risk to stop a two-point conversion for us not to go into overtime – I thought that was amazing to help our team like that.”
Deckerville coach Bill Brown wasn't surprised to see Stone put himself in harm's way for the benefit of his team.
“He has made big plays for us all year, and it takes a lot of heart and guts to make that happen,” he said. “This whole team is just like him, and what a heck of a play. He's one of those kids who thought he might not want to come up as a sophomore, but he came up, and what a great addition to our team.”
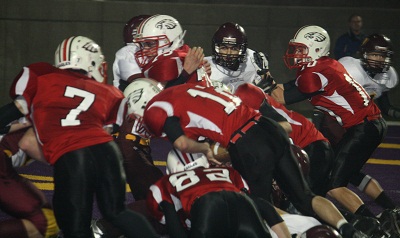 Stone also came up with a key interception in the third quarter, and scampered 23 yards for a touchdown on the Eagles' ensuing possession that put them ahead 14-6.
“It's my sophomore year, and to already win a state championship is pretty amazing,” Stone said. “I wanted to stay on the junior varsity this year because I didn't think I could make it on the varsity very well, but I think I did pretty good.”
Stone's effort was almost for naught, as Bellaire recovered an onside kick and threatened in the final seconds.
A 31-yard pass from quarterback Zach Smith to Wes Villafane put Bellaire at the Deckerville 4-yard line.
But Deckerville's defense smothered the run on the game's final play to preserve the win.
“We didn't spike it down there because I live by the philosophy of, let's catch them so the defense can't get set,” Bellaire coach Ron Bindi said. “We hit a big play earlier with that running play, and it just didn't work out.
“The kids have played like this all year. With only 13 of them, they are always outnumbered, but there is no quit in them. We just didn't get it done at the end this time.”
Trailing 14-6 late, Smith tossed a long bomb to Villafane, who hauled in the 52-yard score and trimmed the deficit to14-12.
Bellaire (9-4) failed multiple times to capitalize on scoring opportunities.
The Eagles were inside Deckerville's 30-yard line five times, but only scored once on a 1-yard quarterback keeper by Smith in the final minute of the second quarter.
“We came out ready to play, but our offense did things that we haven't done all year,” Bindi said. “We made mistake, after mistake, after mistake, and you can't win football games like that.”
Deckerville closed with a 12-1 record en route to the title. Its lone loss came in Week 2 against Cedarville.
“Ever since Week 1, it has been a great ride,” Wolfe said. “We learned a lot of things. We learned responsibility, dedication and how to become a team.”
Said Brown: “It means a lot to the program, our community and all the alumni who have played before us and busted their tails. We just happened to have a great year with a great group.”
PHOTOS: (Top) Deckerville running back Christopher Wolfe prepares for an oncoming tackler during Friday's 8-Player Final. (Middle) Bellaire's Zach Smith (12) dives for his team's first touchdown. (Click to see more from the Regional Final at HighSchoolSportsScene.com.)