
Inside Selection Sunday: Mapping the Football Playoffs
October 24, 2011
Sitting on the other side of this process for a number of years, I can admit to occasionally scratching my cynical head over some of the matchups that have come out of Selection Sunday.
How could teams so far from each other play in the same district? Why would two schools in the same town play in different regionals? Are they picking out of a hat at 1661 Ramblewood Drive?
Now, I have answers.
Sunday morning, we filed into headquarters for what might be the most important non-game day on the MHSAA calendar. “We” were made up of half of the MHSAA staff, plus a representative from the Michigan High School Football Coaches Association.
Here’s some of what I learned from being a part of the process:
? First, a brief history lesson. In early years (or until the middle of the last decade), lines were drawn by hand. Dots representing qualifying schools were pasted on maps, one map for each division, and those maps were then covered by plastic sheets. Districts and regionals literally were drawn with dry-erase markers. No longer. Using a variety of spreadsheets and mapping software, we’ve gone digital. Staff is split into two teams, each considering four divisions (and the 8-player map) before we reconvene and look at all nine divisions together.
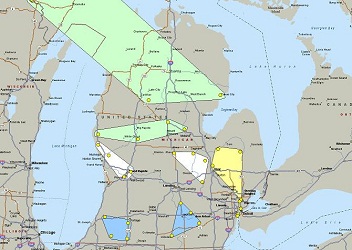
? We are presented digital maps of the state covered in dots. That’s about it. The rule of the day, simply, is “geography rules.” Which teams are represented by the dots is not considered, much less discussed, until lines are drawn. While considering my group’s first map, I began to bring up teams – and immediately was shot down (with good reason). Teams, matchups, rivalries, previous playoff pairings, etc. DO NOT come into play. We draw boxes in what we figure are the most logical ways of making districts and regions work.
? Travel distance and ease DO come into play. This especially is true when considering which districts will include teams from the Upper Peninsula. An example: Marquette is closer to the schools we placed in its district – Fenton, Bay City Western and Okemos – than some other options because those schools are closer to I-75. Schools further north on the map but farther from a main highway would’ve created longer trips.
? Sometimes, maps get ugly. And sometimes, it was a matter of choosing the least ugly situation. Of course, a D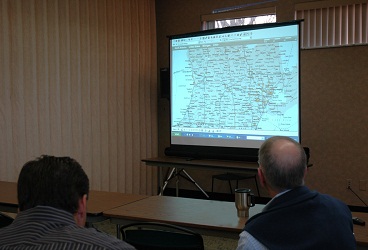 ivision 4 District of Lansing Sexton, Dearborn Heights Robichaud, Battle Creek Pennfield and Vicksburg isn’t ideal. But with no other Division 4 schools within 35 miles of Lansing, we were put in a tough spot. Add in that there were 13 teams in the Detroit area, leaving one as the odd team out of three districts based there. Something had to give, and drawing things up as we did caused the fewest messes.
? Considering how to set up the entire state is different than figuring out what teams make the most sense for just one school or area. And shifting just one dot on a map can change things for all 32.
? Back to “geography rules.” The Division 8 district including Saugatuck, Muskegon Catholic, Mendon and St. Joseph Lake Michigan Catholic might be the most competitive, on paper, in the state. Saugatuck is the reigning MHSAA runner-up in the division, and Muskegon Catholic and Mendon were ranked Nos. 1 and 2, respectively, in the most recent Association Press poll. Seeing that after we’d drawn the line caused a collective “ouch.” But again, the line was drawn based on dots on a map.
I thought back on some of the matchups I’d questioned in the past, and came back to what I’d ask people now: How would you do things differently?
I imagine there would be some creative answers, but I also would guess we considered those scenarios too.
And remember, determining the playoff schedule is just one step in many. Eight state champions must survive it, regardless of which opponents they face along the way.
A Game for Every Fan: District Openers
October 31, 2013
By Geoff Kimmerly
Second Half editor
A handful of MHSAA football teams always are safe to expect at Ford Field when we finish the annual five-week Finals run into Thanksgiving weekend.
But if the record number of at-large qualifiers – 31 – or the difficulty in picking the best first-round matchups are indications, this weekend could be ripe for plenty of the unexpected.
A total of 38 teams enter the playoffs perfect for the regular season. Ithaca is riding a national-record 51-game winning streak and seeking its fourth straight Division 6 title, while Detroit Cass Tech and Birmingham Brother Rice are going for their third straight each in Divisions 1 and 2, respectively.
How they might fare this time will be easier to predict over the next few weeks. But first things first, and in this case it’s our forecast of the best District openers all over the state this weekend. (Click to see the entire schedule, with dates, times and locations.)
Division 1
Detroit Catholic Central (7-2) at Northville (8-1)
Arguably the most competitive District in any division also includes Canton and Walled Lake Western, but Northville finished ahead of both to win the Kensington Lakes Activities Association. That doesn’t necessarily make the Mustangs favored. DCC’s only marks against came against reigning Division 2 champion Birmingham Brother Rice, and the Shamrocks have plenty of know-how in the postseason – they’ve finished Division 1 runner-up the last two seasons.
Others that caught my eye: East Kentwood (5-4) at Hudsonville (6-3), Rochester Hills Stoney Creek (6-3) at Rochester Adams (6-3), Belleville (6-3) at Saline (8-1), Canton (8-1) at Walled Lake Western (8-1).
Division 2
Southfield (7-2) at Birmingham Seaholm (8-1)
This is a meeting of Oakland Activities Association champions, with OAA White winner Southfield hoping to bounce back after last week’s loss to Red champ Clarkston. Blue champ Seaholm also lost in Week 9, to Detroit U-D Jesuit. The Bluejays have been considered MHSAA contenders since the preseason, but the Maples quietly are 16-3 over the last two years and poised to take the next step.
Others that caught my eye: Midland Dow (7-2) at Fenton (8-1), Muskegon Reeths-Puffer (7-2) at Muskegon (8-1), Ypsilanti Lincoln (7-2) at Wyandotte Roosevelt (9-0), Taylor Truman (7-2) at Allen Park (7-2).
Division 3
Zeeland East (5-4) at Zeeland West (8-1)
It’s fair to assume this won’t be much of a game – East got in with an at-large bid and its worst record since 2009. But there’s too much history to ignore. East did win their first matchup this season, in Week 2, 50-44. And after the Chix cruised to a 9-0 regular season in 2012, West upset them during the District opener. More payback would be the best way to end a four-game losing streak for East – although West hasn’t lost again this fall since that early defeat.
Others that caught my eye: Detroit Denby (7-2) at Detroit Mumford (7-2), Eaton Rapids (5-4) at Charlotte (7-2), Haslett (6-3) at DeWitt (9-0), Riverview (7-2) at Melvindale (7-2).
Division 4
Battle Creek Pennfield (8-1) at Paw Paw (8-1)
League champions clash in the best Division 4 game of opening night, Paw Paw from the Wolverine B Conference East and Pennfield from the Kalamazoo Valley Association. Pennfield has made the playoffs every season under the current format, which began in 1999 – but enters this run with perhaps its best defense of the bunch after giving up seven or fewer points in six games. Paw Paw is coming off a disappointing loss to Edwardsburg last week, but has been similarly sturdy stopping opponents – Week 9 was the first the Redskins gave up more than 14 points in a game.
Others that caught my eye: Harper Woods Chandler Park (7-2) at Richmond (8-1), Dowagiac (6-3) at Edwardsburg (9-0), Dearborn Heights Robichaud (6-3) at Pontiac Notre Dame Prep (7-2), Yale (6-3) at Saginaw Swan Valley (9-0).
Division 5
Grand Rapids West Catholic (5-4) at Portland (7-1)
Just as this matchup was tough to predict when these teams met for the Division 5 championship last season, it’s hard to read again this fall. The Raiders rebuilt quickly, with their lone loss two weeks ago to Division 3 contender DeWitt, 13-7. West Catholic made the playoffs with an at-large bid after a one-point win in Week 9 – but has won four straight after opening 0-3.
Others that caught my eye: Kingsford (7-2) at Grayling (8-1), Clare (7-2) at Reed City (9-0), Olivet (8-1) at Hopkins (7-2), River Rouge (8-1) at Monroe St. Mary Catholic Central (8-1).
Division 6
Reese (8-1) at Montrose (9-0)
Judging by last week’s Genesee Area Conference Blue deciding game, it's fair to guess this might not be much of a contest – Montrose ran past second-place Lake Fenton 37-0 to claim the title outright and also beat Reese 38-8 on opening night. But the Rockets haven’t loss since or scored fewer than 41 points since the first week of October.
Others that caught my eye: Elk Rapids (6-3) at Boyne City (7-2), Marlette (8-1) at Saginaw Nouvel (8-1), Schoolcraft (8-1) at Niles Brandywine (8-1), Manchester (7-2 at Grass Lake (8-1).
Division 7
Saugatuck (8-1) at Pewamo-Westphalia (8-1)
One of these teams has reached MHSAA semifinals each of the last three seasons and both have advanced to Ford Field once during that time. And each has prepared well this season against similar or bigger foes – Saugatuck’s lone loss was to playoff qualifier Decatur and it beat Division 6 qualifier Hartford. Pewamo-Westphalia beat Division 5 qualifier Lansing Catholic and lost only to Division 8 powerhouse New Lothrop.
Others that caught my eye: Traverse City St. Francis (5-4) at Iron River West Iron County (9-0), Royal Oak Shrine (6-3) at Madison Height Bishop Foley (6-3), St. Joseph Lake Michigan Catholic (6-2) at Cassopolis (6-3), Whittemore-Prescott (6-3) at Lake City (8-1).
Division 8
Bessemer (6-3) at Crystal Falls Forest Park (9-0)
We discussed this game at length when these teams met only two weeks ago and Forest Park celebrated avenging a 2012 loss to the Miners to this time clinch the Great Western Conference title outright. A win for Bessemer in this game would be even bigger as the Trojans are attempting to bounce back after failing to reach the District Finals last season for the first time since 2002.
Others that caught my eye: Munising (6-3) at Powers North Central (7-2), Mio (7-2) at Beal City (9-0), Clarkston Everest Collegiate (7-2) at Waterford Our Lady (7-2), Mount Pleasant Sacred Heart (6-3) at Coleman (7-2).
8-Player
Deckerville (5-4) at Peck (9-0)
Last season’s champion opens these playoffs against one of the favorites according to playoff points average. Deckerville won the MHSAA championship in 2012, the team's first season of 8-player, and won two of its final three regular season games this fall. Peck is one of three 9-0 teams in 8-player and owns the third-highest playoff point average in the division. The Pirates beat Deckerville 56-8 only two weeks ago.
Others that caught my eye: Akron-Fairgrove (7-2) at Owendale-Gagetown (8-1), Casonville Port-Sanilac (6-3) at Portland St. Patrick (7-2), Bellaire (5-4) at Kinde-North Huron (6-3), Engadine (5-4) at Cedarville (8-1).
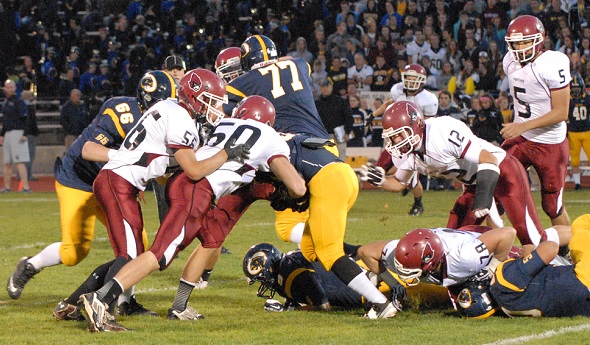
PHOTO: DeWitt (blue helmets) and Portland met in a Week 7 battle of undefeated teams, and both are considered Ford Field possibilities – DeWitt in Division 3 and Portland in Division 5. (Click to see more from High School Sports Scene.)