
Inside Selection Sunday: Mapping the Football Playoffs
October 24, 2011
Sitting on the other side of this process for a number of years, I can admit to occasionally scratching my cynical head over some of the matchups that have come out of Selection Sunday.
How could teams so far from each other play in the same district? Why would two schools in the same town play in different regionals? Are they picking out of a hat at 1661 Ramblewood Drive?
Now, I have answers.
Sunday morning, we filed into headquarters for what might be the most important non-game day on the MHSAA calendar. “We” were made up of half of the MHSAA staff, plus a representative from the Michigan High School Football Coaches Association.
Here’s some of what I learned from being a part of the process:
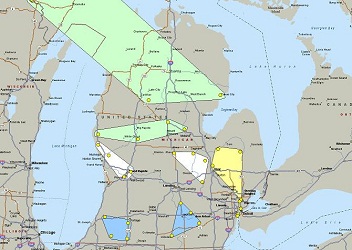
? First, a brief history lesson. In early years (or until the middle of the last decade), lines were drawn by hand. Dots representing qualifying schools were pasted on maps, one map for each division, and those maps were then covered by plastic sheets. Districts and regionals literally were drawn with dry-erase markers. No longer. Using a variety of spreadsheets and mapping software, we’ve gone digital. Staff is split into two teams, each considering four divisions (and the 8-player map) before we reconvene and look at all nine divisions together.
? We are presented digital maps of the state covered in dots. That’s about it. The rule of the day, simply, is “geography rules.” Which teams are represented by the dots is not considered, much less discussed, until lines are drawn. While considering my group’s first map, I began to bring up teams – and immediately was shot down (with good reason). Teams, matchups, rivalries, previous playoff pairings, etc. DO NOT come into play. We draw boxes in what we figure are the most logical ways of making districts and regions work.
? Travel distance and ease DO come into play. This especially is true when considering which districts will include teams from the Upper Peninsula. An example: Marquette is closer to the schools we placed in its district – Fenton, Bay City Western and Okemos – than some other options because those schools are closer to I-75. Schools further north on the map but farther from a main highway would’ve created longer trips.
? Sometimes, maps get ugly. And sometimes, it was a matter of choosing the least ugly situation. Of course, a D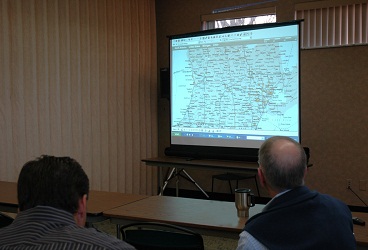 ivision 4 District of Lansing Sexton, Dearborn Heights Robichaud, Battle Creek Pennfield and Vicksburg isn’t ideal. But with no other Division 4 schools within 35 miles of Lansing, we were put in a tough spot. Add in that there were 13 teams in the Detroit area, leaving one as the odd team out of three districts based there. Something had to give, and drawing things up as we did caused the fewest messes.
? Considering how to set up the entire state is different than figuring out what teams make the most sense for just one school or area. And shifting just one dot on a map can change things for all 32.
? Back to “geography rules.” The Division 8 district including Saugatuck, Muskegon Catholic, Mendon and St. Joseph Lake Michigan Catholic might be the most competitive, on paper, in the state. Saugatuck is the reigning MHSAA runner-up in the division, and Muskegon Catholic and Mendon were ranked Nos. 1 and 2, respectively, in the most recent Association Press poll. Seeing that after we’d drawn the line caused a collective “ouch.” But again, the line was drawn based on dots on a map.
I thought back on some of the matchups I’d questioned in the past, and came back to what I’d ask people now: How would you do things differently?
I imagine there would be some creative answers, but I also would guess we considered those scenarios too.
And remember, determining the playoff schedule is just one step in many. Eight state champions must survive it, regardless of which opponents they face along the way.
A Game for Every Fan: Week 9
October 25, 2013
By Geoff Kimmerly
Second Half editor
The final Friday of the MHSAA football regular season always is one of the most celebratory and at the same time heart-breaking days of the entire school year.
For many, practice will continue Monday. But for the majority, tonight will mark the end of another season – or a high school career.
Fortunately for a number of those athletes, they and their teams still have control over how they'll be feeling when this night, and this weekend, is done. A total of 187 teams have qualified for the 256-team 11-player playoff field – including six teams that won their sixth games Thursday night – and 76 more can clinch a berth with a win tonight or Saturday. The 8-player field is more set, although movement could still occur among those in contention for the final spots in that 16-team field.
Here's a look at some of the games to keep an eye on this weekend, including league title games in the Detroit Public School League, Catholic League and Kensington Lakes Activities Association. And make sure to check in throughout the weekend to Score Center and then Sunday when playoff pairings are posted at 8 p.m.
Detroit and Southeast
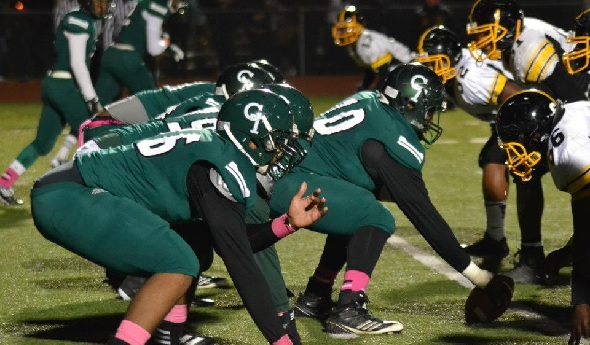
Detroit Martin Luther King (7-0) vs. Detroit Cass Tech (8-0), Ford Field
This title decider at Ford Field has been among the most highly-anticipated games in Detroit since before the first kickoff of this season. Although this was the second since the 1990s that these schools played in different divisions of the Detroit PSL, that separation arguably has made the rivalry even bigger – especially with King stunning the reigning MHSAA Division 1 champ with a 44-13 win during last season’s PSL semifinals. Neither has come to losing since the early weeks of this season; Cass Tech hasn't given up more than six points in a game since opening night, and King hasn't let an opponent come closer than 28 points since Week 2.
Others that caught my eye: Birmingham Brother Rice (8-0) vs. Detroit Catholic Central (7-1), Saturday at Ford Field; Southfield (7-1) at Clarkston (7-1), Britton Deerfield (6-2) at Clinton (8-0), Walled Lake Western (8-0) at Northville (7-1).
West Michigan
Muskegon Reeths-Puffer (7-1) at Muskegon (7-1)
This isn't as annual a scenario for Muskegon as most might think: The Big Reds did fall to Zeeland East by a point in Week 9 last season to finish second to the Chix in the O-K Black standings, but are still seeking their first league title since 2008. This is the first time Reeths-Puffer has posted a winning record since 2007, and it’s done so in impressive fashion with victories over one playoff qualifier and three more that can earn bids tonight. Still, Reeths-Puffer is seeking its first win over the Big Reds since 1999.
Others that caught my eye: Grand Rapids Ottawa Hills (5-3) at Grand Rapids Catholic Central (5-3), Holland West Ottawa (5-3) at Hudsonville (5-3), East Kentwood (5-3) at Rockford (7-1), Zeeland West (7-1) at Byron Center (6-2).
Upper Peninsula
Menominee (8-0) at Marquette (5-2)
Marquette fell big to Menominee in 2012, but has won two of the last three between the Greater Northern UP Conference rivals – and can force a three-way tie for the league title by beating the Maroons tonight. Menominee has yet to be challenged significantly – only reigning Division 8 champion Harbor Beach has gotten within 20 points of the Maroons this season as they've built the second-highest playoff point average among teams expected to fall into Division 5.
Others that caught my eye: St. Ignace (7-1) at Cheboygan (6-2), L'Anse (7-1) at Munising (5-3), Crystal Falls Forest Park (8-0) at Lake Linden-Hubbell (5-3), Newberry (3-5) at Sault Ste. Marie (5-3).
Bay and Thumb
Fenton (8-0) at Lapeer West (7-1)
Beating second-place Lapeer West tonight would give Fenton 20 straight Flint Metro League victories and make outright another league title, the Tigers’ third straight. But Lapeer West also has a fine football tradition stretching back into the late 1980s, and the Panthers would love nothing more in their final regular season game than to win a share of one more league title. Lapeer West will combine with Lapeer East next fall.
Others that caught my eye: Lake Fenton (7-1) at Montrose (8-0), Davison (4-4) at Flint Carman-Ainsworth (7-1), Sanford Meridian (7-1) at Clare (6-2), Plymouth (5-3) at Grand Blanc (6-2).
Southwest and Border
Watervliet (8-0) at Lawton (8-0)
This trumps Edwardsburg/Paw Paw as the top game from the southwest and border areas because a league title is on the line. Watervliet and Lawton split the Southwestern Athletic Conference South title last season, and one of the two has won the league the last four seasons – with Lawton also finishing second the two times Watervliet finished first. The Panthers survived a three-point scare last week against Decatur and can finish their first perfect regular season since 1999.
Others that caught my eye: Edwardsburg (8-0) at Paw Paw (8-0), Battle Creek Pennfield (7-1) at Constantine (5-3), Saugatuck (7-1) at Gobles (5-3), Battle Creek St. Philip (8-0) at Lawrence (6-1).
Lower Up North
Boyne City (7-1) at Grayling (7-1)
This highly-anticipated Lake Michigan Conference deciding game has come to fruition thanks to some close calls including two Grayling wins by a touchdown or less and Boyne City’s victory last week over motivated Elk Rapids. This is a repeat of the 2012 scenario; both also entered that Week 9 game undefeated before Grayling won 21-0.
Others that caught my eye: Mio (7-1) at Lincoln Alcona (8-0), Kalkaska (6-2) at Elk Rapids (5-3), Cadillac (8-0) at Traverse City Central (5-3), Petoskey (5-3) at Ogemaw Heights (5-3).
Mid-Michigan
Homer (8-0) at Grass Lake (7-1)
This is the showcase game of the Cascades/Big 8 Conference crossover series, with Grass Lake one of three that shared the Cascades title and Homer the outright champion in the Big 8. The Trojans also are attempting to finish their first perfect regular season since 2005. The last time these teams met was in 2004.
Others that caught my eye: Jackson Lumen Christi (8-0) at Howell (5-3), Grand Ledge (4-4) at Holt (4-4), New Lothrop (8-0) vs. Pewamo-Westphalia (8-0) at Alma College, Chelsea (2-6) at Haslett (5-3).
PHOTO: Detroit Cass Tech (green jerseys) will attempt to avenge last season's Detroit Public School League playoff loss to Martin Luther King when those teams meet tonight in this season's championship game. (Photo courtesy of Detroit PSL.)