

Week 5 Football Playoff Listing
September 18, 2012
Here is a list of Michigan High School Athletic Association football playing schools, displaying their win-loss records and playoff averages through the fourth week of the season.
Schools on this list are in enrollment order. An asterisk (*) beside a record indicates that a team has eight or fewer games scheduled. A carrot (^) beside a school’s name indicates that a team is one win away from playoff qualification.
Those schools with 11-player teams with six or more wins playing nine-game schedules, or five or more wins playing eight games or fewer, will qualify for the MHSAA Football Playoffs beginning Oct. 26-27. Schools with 5-4, 4-3 or 4-4 records may qualify if the number of potential qualifiers by win total does not reach the 256 mark. Schools with six or more wins playing nine-game schedules or five or more wins playing eight games or fewer may be subtracted from the field based on playoff average if the number of potential qualifiers exceeds the 256 mark.
Once the 256 qualifying schools are determined, they will be divided by enrollment groups into eight equal divisions of 32 schools, and then drawn into regions of eight teams each and districts of four teams each.
Those schools with 8-player teams will be ranked by playoff average at season’s end, and the top 16 programs will be drawn into regions of eight teams each for the playoff in that division, which also begins Oct. 26-27.
To review a list of all football playoff schools, individual school playoff point details and to report errors, visit the Football page of the MHSAA Website.
The announcement of the qualifiers and first round pairings for both the 11 and 8-player playoffs will take place on Oct. 21 on the Selection Sunday Show on FOX Sports Detroit at 7 p.m. The playoff qualifiers and pairings will be posted to the MHSAA Website following the Selection Sunday Show.
----------------------------------------------------------------------------------------------------------------------------
11-Player Playoff Listing
1. Utica Eisenhower, 2772, 3-1, 72.500
2. Sterling Heights Stevenson, 2766, 3-1, 68.500
3. Clarkston, 2721, 4-0, 90.000
4. Macomb Dakota, 2608, 3-1, 72.500
5. Lake Orion, 2565, 4-0, 90.000
6. Troy, 2502, 3-1, 70.500
7. Clinton Township Chippewa Valley, 2462, 3-1, 74.250
8. Dearborn Fordson, 2442, 3-1, 76.250
9. Holland West Ottawa, 2262, 3-1, 66.500
10. Detroit Cass Tech, 2200, 4-0, 92.000
11. Canton, 2166, 3-1, 62.750
12. Monroe, 2154, 4-0, 82.000
13. Plymouth, 2050, 3-1, 62.750
14. Salem, 2039, 4-0, 88.000
15. Livonia Stevenson, 2005, 4-0, 92.000
16. Hartland, 1932, 4-0, 88.000
17. Warren Mott, 1879, 4-0, 84.000
18. Livonia Churchill, 1877, 4-0, 94.000
19. Walled Lake Central, 1857, 3-1, 64.750
20. Saline, 1849, 3-1, 62.250
21. Grandville, 1846, 3-1, 64.750
22. Flint Carman-Ainsworth, 1772, 4-0, 82.000
23. Grand Ledge, 1743, 3-1, 64.250
24. Rochester, 1725, 3-1, 68.750
25. Traverse City West, 1720, 3-1, 62.250
26. White Lake Lakeland, 1700, 3-1, 64.250
27. Davison, 1664, 3-1, 64.750
28. Grosse Pointe South, 1648, 3-1, 70.500
29. Temperance Bedford, 1581, 3-1, 58.750
30. Brownstown Woodhaven, 1520, 3-1, 64.750
31. Ypsilanti Lincoln, 1520, 3-1, 66.750
32. Midland, 1485, 4-0, 94.000
33. Port Huron, 1473, 3-1, 66.500
34. Traverse City Central, 1429, 3-1, 64.000
35. Oak Park, 1391, 4-0, 94.000
36. Lansing Everett, 1359, 4-0, 96.000
37. Birmingham Seaholm, 1349, 3-1, 62.500
38. Garden City, 1344, 3-1, 64.250
39. Portage Central, 1340, 3-1, 66.750
40. Muskegon Mona Shores, 1337, 3-1, 52.750
41. Birmingham Brother Rice, 1336, 3-1, 70.750
42. Portage Northern, 1328, 3-1, 70.750
43. Caledonia, 1308, 4-0, 90.000
44. Wyandotte Roosevelt, 1304, 4-0, 78.000
45. Farmington Hills Harrison, 1302, 3-1, 68.250
46. Farmington, 1278, 4-0, 90.000
47. Grand Rapids Forest Hills Central, 1278, 3-1, 64.750
48. Taylor Truman, 1253, 4-0, 88.000
49. Swartz Creek, 1223, 4-0, 90.000
50. Fenton, 1202, 3-1, 60.750
51. Grand Rapids Northview, 1180, 3-1, 62.000
52. Lowell, 1177, 3-1, 66.750
53. Bay City Western, 1171, 4-0, 72.000
54. Gibraltar Carlson, 1160, 4-0, 78.000
55. Muskegon, 1144, 4-0, 98.000
56. East Lansing, 1142, 4-0, 76.000
57. Mattawan, 1124, 4-0, 82.000
58. Marquette*, 1112, 3-1, 68.250
59. Redford Thurston, 1088, 3-1, 52.500
60. Auburn Hills Avondale, 1080, 4-0, 82.000
61. St. Johns, 1068, 4-0, 82.000
62. Zeeland East, 1067, 4-0, 88.000
63. Detroit East English, 1030, 3-1, 60.750
64. Lansing Waverly, 1011, 3-1, 54.750
65. St. Joseph, 974, 3-1, 58.500
66. Mason, 969, 4-0, 76.000
67. Milan, 959, 4-0, 78.000
68. Grand Rapids Christian, 954, 3-1, 68.750
69. Cedar Springs, 950, 3-1, 50.250
70. DeWitt, 931, 3-1, 62.750
71. Fruitport, 929, 4-0, 76.000
72. Orchard Lake St. Mary's, 926, 3-1, 66.750
73. Bloomfield Hills Lahser, 925, 4-0, 78.000
74. Linden, 923, 4-0, 92.000
75. Niles, 920, 3-1, 66.750
76. Hazel Park, 909, 3-1, 58.750
77. Stevensville Lakeshore, 906, 4-0, 94.000
78. St. Clair, 901, 4-0, 74.000
79. Tecumseh, 887, 4-0, 82.000
80. Carleton Airport, 868, 3-1, 60.500
81. Detroit Central Collegiate, 868, 3-1, 60.250
82. Hastings, 850, 3-1, 54.750
83. Plainwell, 832, 3-1, 62.750
84. Cadillac, 820, 4-0, 80.000
85. Madison Heights Lamphere, 814, 3-1, 60.750
86. Edwardsburg, 805, 3-1, 52.500
87. North Branch, 803, 3-1, 56.500
88. Hamilton, 801, 4-0, 80.000
89. Marysville, 794, 4-0, 84.000
90. Three Rivers, 760, 3-1, 52.500
91. Goodrich, 748, 3-1, 56.500
92. Dearborn Heights Robichaud, 720, 4-0, 82.000
93. Big Rapids, 706, 3-1, 48.750
94. Croswell-Lexington, 704, 4-0, 82.000
95. St. Clair Shores South Lake, 704, 3-1, 62.500
96. Pontiac Notre Dame Prep, 701, 4-0, 78.000
97. Otsego, 698, 3-1, 54.500
98. Detroit Country Day, 685, 3-1, 66.250
99. Comstock Park, 678, 3-1, 60.000
100. Grand Rapids Catholic Central, 674, 4-0, 76.000
101. Grand Rapids South Christian, 660, 3-1, 56.500
102. Battle Creek Pennfield, 656, 4-0, 56.000
103. Grosse Ile, 649, 3-1, 52.750
104. Saginaw Swan Valley, 642, 4-0, 72.000
105. Paw Paw, 639, 4-0, 68.000
106. Allendale, 636, 3-1, 66.500
107. Williamston, 636, 3-1, 56.750
108. Cheboygan, 631, 3-1, 58.500
109. Marine City, 629, 3-1, 66.250
110. Alma, 614, 3-1, 60.750
111. Saginaw Valley Lutheran, 608, 3-1, 36.750
112. Dowagiac, 605, 4-0, 74.000
113. Livonia Clarenceville, 597, 3-1, 57.417
114. Clawson, 582, 3-1, 46.500
115. Remus Chippewa Hills, 581, 3-1, 50.500
116. Essexville Garber, 572, 3-1, 54.500
117. Clinton Township Clintondale, 570, 4-0, 78.000
118. Lake Fenton, 564, 3-1, 54.500
119. Freeland, 561, 3-1, 54.500
120. Kingsford, 559, 3-1, 50.750
121. Portland, 555, 4-0, 72.000
122. Flint Powers Catholic, 542, 4-0, 78.000
123. Menominee, 539, 4-0, 82.000
124. Macomb Lutheran North, 537, 4-0, 74.000
125. Hopkins, 531, 4-0, 64.000
126. Detroit University Prep, 528, 4-0, 72.667
127. Grayling, 516, 4-0, 66.000
128. Ann Arbor Gabriel Richard, 515, 3-1, 48.750
129. Allen Park Cabrini, 512, 3-1, 42.750
130. Olivet, 509, 3-1, 48.750
131. Frankenmuth, 507, 4-0, 72.000
132. Newaygo, 507, 3-1, 54.750
133. Ida, 503, 4-0, 64.000
134. River Rouge, 495, 4-0, 66.667
135. Carrollton, 492, 4-0, 56.000
136. Lansing Catholic, 487, 3-1, 52.500
137. Reed City, 480, 4-0, 70.000
138. Muskegon Oakridge, 474, 4-0, 68.000
139. Kingsley, 473, 3-1, 40.250
140. Jackson Lumen Christi, 472, 4-0, 74.000
141. Buchanan, 467, 3-1, 50.500
142. Leslie, 467, 4-0, 66.000
143. Roscommon, 461, 3-1, 46.750
144. Kalkaska, 459, 3-1, 38.750
145. Millington*, 459, 3-1, 58.750
146. Warren Michigan Collegiate, 446, 4-0, 66.000
147. Boyne City, 437, 4-0, 66.000
148. Monroe St. Mary Catholic Central, 437, 3-1, 52.500
149. Negaunee, 433, 4-0, 66.000
150. Beaverton, 422, 3-1, 40.250
151. Hemlock, 421, 3-1, 56.750
152. Shelby, 417, 4-0, 78.000
153. Vassar, 416, 4-0, 50.000
154. Clinton, 413, 4-0, 68.000
155. Maple City Glen Lake, 409, 4-0, 54.000
156. Michigan Center, 406, 4-0, 64.000
157. Manchester, 404, 3-1, 44.750
158. Ithaca, 402, 4-0, 76.000
159. Montrose Hill-McCloy, 400, 3-1, 58.750
160. Niles Brandywine, 396, 3-1, 38.917
161. Grass Lake, 395, 3-1, 48.750
162. Hillsdale, 391, 4-0, 70.000
163. Madison Heights Madison, 391, 3-1, 58.000
164. Ecorse, 390, 3-1, 42.500
165. Montague, 390, 3-1, 50.750
166. Sanford Meridian, 388, 3-1, 48.250
167. Saranac, 383, 3-1, 50.250
168. Constantine, 371, 3-1, 44.750
169. Grandville Calvin Christian, 371, 3-1, 46.750
170. Watervliet, 369, 4-0, 48.000
171. Schoolcraft, 366, 4-0, 68.000
172. Byron Area, 364, 3-1, 40.750
173. Reese, 350, 4-0, 54.000
174. Union City, 350, 4-0, 54.000
175. Burton Bendle, 348, 3-1, 40.750
176. Pellston, 347, 4-0, 32.000
177. Saginaw Nouvel, 344, 3-1, 64.750
178. Carson City-Crystal, 337, 3-1, 34.250
179. Hartford, 337, 4-0, 62.667
180. Marlette, 336, 4-0, 56.000
181. Whittemore-Prescott, 328, 3-1, 40.750
182. Lawton, 317, 4-0, 60.000
183. Lake City, 316, 4-0, 48.000
184. Pewamo-Westphalia, 316, 3-1, 46.500
185. Hesperia, 309, 3-1, 38.500
186. Ishpeming, 307, 4-0, 62.000
187. Unionville-Sebewaing, 303, 3-1, 38.500
188. Evart, 302, 3-1, 34.750
189. Homer, 302, 3-1, 36.750
190. Detroit Loyola, 298, 4-0, 76.000
191. Lincoln Alcona, 292, 3-1, 30.500
192. Genesee, 288, 3-1, 34.000
193. Mancelona, 288, 4-0, 50.000
194. Royal Oak Shrine Catholic, 284, 3-1, 56.750
195. Grosse Pointe Woods University Liggett, 283, 3-1, 36.500
196. Reading, 283, 3-1, 38.500
197. Decatur, 277, 4-0, 50.000
198. Gobles, 271, 3-1, 38.750
199. Ottawa Lake Whiteford, 268, 3-1, 40.750
200. Waterford Our Lady, 263, 4-0, 64.000
201. Newberry, 260, 3-1, 26.750
202. Mayville, 258, 3-1, 50.500
203. Melvindale Academy for Business & Tech, 254, 3-1, 52.500
204. Marcellus, 249, 4-0, 44.000
205. Harbor Beach, 245, 3-1, 38.750
206. Vestaburg, 242, 3-1, 36.500
207. Coleman, 239, 3-1, 38.250
208. New Lothrop, 237, 4-0, 64.000
209. Bessemer*, 233, 3-1, 38.750
210. L'Anse, 233, 4-0, 54.000
211. Petersburg-Summerfield, 232, 3-1, 40.750
212. Atlanta, 224, 3-1, 30.917
213. Mendon, 216, 4-0, 50.000
214. Beal City, 213, 4-0, 68.000
215. Pittsford, 213, 3-1, 36.250
216. Morenci, 207, 3-1, 40.000
217. St. Ignace La Salle, 207, 4-0, 46.000
218. Pickford, 197, 4-0, 48.000
219. Onaway, 194, 4-0, 38.000
220. Powers North Central, 194, 3-1, 26.250
221. Fowler, 186, 3-1, 48.750
222. Climax-Scotts, 183, 4-0, 44.000
223. Morrice, 171, 4-0, 48.000
224. St. Joseph Lake Michigan Catholic*, 171, 3-0, 46.667
225. Colon, 164, 3-1, 30.750
226. Crystal Falls Forest Park, 164, 4-0, 48.000
227. Mt. Pleasant Sacred Heart, 121, 3-1, 42.750
228. Iron Mountain North Dickinson*^, 112, 4-0, 54.000
229. Ashley, 99, 3-1, 28.500
---------------------------------------------------------------------------------
8-Player Playoff Listing
1. Deckerville, 194, 3-1, 36.750
2. Battle Creek St. Philip, 182, 3-1, 34.750
3. Kingston, 175, 3-1, 30.500
4. Cedarville, 169, 4-0, 45.333
5. Peck, 156, 4-0, 40.000
6. Eben Junction Superior Central, 132, 4-0, 42.000
7. Rapid River, 115, 4-0, 34.000
8. Portland St. Patrick, 104, 4-0, 46.000
9. Owendale-Gagetown, 60, 3-1, 32.250
A Game for Every Fan: District Finals
November 1, 2012
By Geoff Kimmerly
Second Half editor
Time is running out on the 2012 MHSAA football season.
And that's why it's the favorite time of year for fans all over the state.
The field that began with 272 teams has been cut in half. Seven teams that entered the postseason undefeated suffered their first and only losses last week. And for a number of other contenders, things are about to get much more serious as the matchups get tougher and the first playoff trophies are handed out.
Four games again will be streamed live on FoxSportsDetroit.com's Prep Zone: Constantine at Schoolcraft, Traverse City Central at Midland, Macomb L'Anse Creuse North at Macomb Dakota and Plymouth at Livonia Churchill.
Below are some of the District Finals that could have the most bearing on championship races in each division. Visit the MHSAA Score Center for game times and dates, and all weekend for updated scores and standings.
Division 1
Plymouth (8-2) at Livonia Churchill (10-0)
This is a rematch of the deciding game in the Kensington Lakes Activities Association South, although Livonia Churchill’s 35-31 win came all the way back in Week 3. The Wildcats rebounded nicely off a Week 9 loss to Grand Blanc with a 40-28 win over Canton last week, while the Chargers, with their 10th win, extended their best season in program history.
Others that caught my eye: Holland West Ottawa (8-2) at Rockford (8-2), Utica Eisenhower (8-2) at Lake Orion (9-1), Grand Blanc (6-4) at Clarkston (10-0).
Division 2
Lowell (8-2) at Muskegon (9-1)
When these two met in Week 4, they were considered the top two teams in Division 2. They’re still among the elite despite a few bumps since, but Lowell might have an upward battle to keep its string of three straight MHSAA championship game appearances alive. The reigning Division 2 runner-up fell to the Big Reds 36-21 in that earlier meeting.
Others that caught my eye: Traverse City Central (9-1) at Midland (10-0), Walled Lake Western (7-3) at Mattawan (9-1), Wyandotte Roosevelt (9-1) at Taylor Truman (9-1).
Division 3
Auburn Hills Avondale (9-1) at Orchard Lake St. Mary (8-2)
Avondale has its most wins since 1995 and won the Oakland Activities Association Blue championship before surviving with a two-point rematch win over Bloomfield Hills Lahser last week. The last time these two met turned into one of the wildest games of the 2010 playoffs – a 71-44 Eaglets win in the District Final. Beating St. Mary this time would give Avondale arguably its best playoff victory ever.
Others that caught my eye: DeWitt (8-2) at Linden (9-1), Zeeland West (7-3) at Grand Rapids Christian (9-1), Detroit East English (8-2) at St. Clair (9-1).
Division 4
Richmond (7-3) at Croswell-Lexington (10-0)
Richmond has come back after two straight losing seasons to return to the playoffs, but has to be smarting a bit after missing out on the Blue Water Conference title by a combined 11 points over three losses. The first was to Croswell-Lexington, 27-24 in Week 2, and the Pioneers have won every game but one since by at least 15 points.
Others that caught my eye: Comstock Park (9-1) at Grand Rapids Catholic Central (10-0), Grand Rapids South Christian (7-3) at Dowagiac (10-0), Detroit Country Day (8-2) at Pontiac Notre Dame Prep (9-1).
Division 5
Frankenmuth (10-0) at Flint Powers Catholic (10-0)
This is the Eagles’ best run since making a Class B Semifinal in 1997 and has included its first league title since 2007. Frankenmuth is outscoring opponents by an average of 34-7. But reigning MHSAA champion Powers has won 18 straight games and has been one of the most impressive teams in the state all season.
Others that caught my eye: Kingsford (9-1) at Menominee (9-1), Grand Rapids West Catholic (7-3) at Muskegon Oakridge (10-0), Lake Fenton (8-2) at Ann Arbor Gabriel Richard (9-1).
Division 6
Millington (9-1) at Montrose (9-1)
Montrose got the scare of its season in the District Semifinal before edging Vassar 7-6. Millington had a much better time last week, cruising to a 66-18 win over Byron, the Cardinals' fourth straight game scoring at least 60 points. That sounds like bad news for the Rams, but consider: Montrose is giving up 14 points per game, and has faced five playoff teams including a pair still alive in Divisions 4 and 5.
Others that caught my eye: Constantine (8-2) at Schoolcraft (10-0), Detroit Consortium (7-3) at Monroe St. Mary Catholic Central (8-2), Hemlock (9-1) at Ithaca (10-0).
Division 7
Saginaw Nouvel (8-2) at Reese (10-0)
The Rockets have a strong football tradition, and this is their fourth season with at least 10 wins over the last 13. But beating the reigning MHSAA champion would add another degree of credibility to an already impressive run. The Panthers played teams from all over the Lower Peninsula again this fall, with their only losses to Flint Powers and Traverse City St. Francis.
Others that caught my eye: Mancelona (10-0) at Ishpeming (9-1), Decatur (8-2) at Lawton (9-1), Grosse Pointe Woods University Liggett (8-2) at Detroit Loyola (10-0).
Division 8
Climax-Scotts (10-0) at Mendon (10-0)
This might be the most anticipated game in the state this weekend. Mendon has been untouchable the last two seasons and is riding a 24-game winning streak. There were two close calls over the last three weeks, and Climax-Scotts is built to provide another. This is the Panthers’ fourth straight season with at least 10 wins, and their ninth over the last decade. But Mendon beat Climax-Scotts 35-10 in last season’s Regional Final.
Others that caught my eye: Mount Pleasant Sacred Heart (9-1) at Beal City (10-0), Muskegon Catholic Central (7-3) at Fowler (9-1), Harbor Beach (9-1) at New Lothrop (10-0).
8-Player
Rapid River (9-1) at Cedarville (10-0)
Cedarville entered the postseason with the highest playoff point average in this division, and this game will be a big step regardless of what happened the first time these teams met this fall. Rapid River finished runner-up in last season’s inaugural Final, and should give the Trojans a much better game than the Cedarville's 72-12 win on Sept. 28.
Other Regional Finals: Owendale-Gagetown (8-2) at Bellaire (7-3), Kinde-North Huron (6-4) at Deckerville (9-1), Battle Creek St. Philip (7-3) at Portland St. Patrick (10-0).
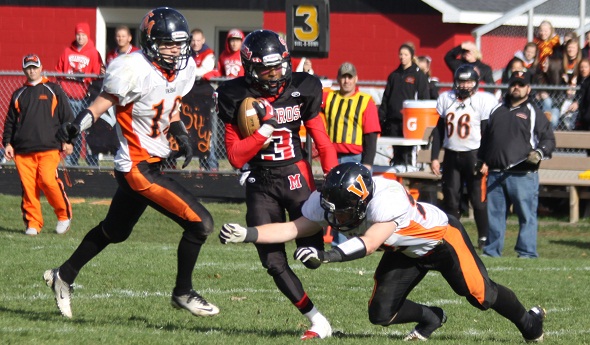
PHOTO: Montrose survived a tough challenge from Vassar to win last week's District Semifinal, 7-6. (Click to see more from HighSchoolSportsScene.com).