

Week 5 Football Playoff Listing
September 18, 2012
Here is a list of Michigan High School Athletic Association football playing schools, displaying their win-loss records and playoff averages through the fourth week of the season.
Schools on this list are in enrollment order. An asterisk (*) beside a record indicates that a team has eight or fewer games scheduled. A carrot (^) beside a school’s name indicates that a team is one win away from playoff qualification.
Those schools with 11-player teams with six or more wins playing nine-game schedules, or five or more wins playing eight games or fewer, will qualify for the MHSAA Football Playoffs beginning Oct. 26-27. Schools with 5-4, 4-3 or 4-4 records may qualify if the number of potential qualifiers by win total does not reach the 256 mark. Schools with six or more wins playing nine-game schedules or five or more wins playing eight games or fewer may be subtracted from the field based on playoff average if the number of potential qualifiers exceeds the 256 mark.
Once the 256 qualifying schools are determined, they will be divided by enrollment groups into eight equal divisions of 32 schools, and then drawn into regions of eight teams each and districts of four teams each.
Those schools with 8-player teams will be ranked by playoff average at season’s end, and the top 16 programs will be drawn into regions of eight teams each for the playoff in that division, which also begins Oct. 26-27.
To review a list of all football playoff schools, individual school playoff point details and to report errors, visit the Football page of the MHSAA Website.
The announcement of the qualifiers and first round pairings for both the 11 and 8-player playoffs will take place on Oct. 21 on the Selection Sunday Show on FOX Sports Detroit at 7 p.m. The playoff qualifiers and pairings will be posted to the MHSAA Website following the Selection Sunday Show.
----------------------------------------------------------------------------------------------------------------------------
11-Player Playoff Listing
1. Utica Eisenhower, 2772, 3-1, 72.500
2. Sterling Heights Stevenson, 2766, 3-1, 68.500
3. Clarkston, 2721, 4-0, 90.000
4. Macomb Dakota, 2608, 3-1, 72.500
5. Lake Orion, 2565, 4-0, 90.000
6. Troy, 2502, 3-1, 70.500
7. Clinton Township Chippewa Valley, 2462, 3-1, 74.250
8. Dearborn Fordson, 2442, 3-1, 76.250
9. Holland West Ottawa, 2262, 3-1, 66.500
10. Detroit Cass Tech, 2200, 4-0, 92.000
11. Canton, 2166, 3-1, 62.750
12. Monroe, 2154, 4-0, 82.000
13. Plymouth, 2050, 3-1, 62.750
14. Salem, 2039, 4-0, 88.000
15. Livonia Stevenson, 2005, 4-0, 92.000
16. Hartland, 1932, 4-0, 88.000
17. Warren Mott, 1879, 4-0, 84.000
18. Livonia Churchill, 1877, 4-0, 94.000
19. Walled Lake Central, 1857, 3-1, 64.750
20. Saline, 1849, 3-1, 62.250
21. Grandville, 1846, 3-1, 64.750
22. Flint Carman-Ainsworth, 1772, 4-0, 82.000
23. Grand Ledge, 1743, 3-1, 64.250
24. Rochester, 1725, 3-1, 68.750
25. Traverse City West, 1720, 3-1, 62.250
26. White Lake Lakeland, 1700, 3-1, 64.250
27. Davison, 1664, 3-1, 64.750
28. Grosse Pointe South, 1648, 3-1, 70.500
29. Temperance Bedford, 1581, 3-1, 58.750
30. Brownstown Woodhaven, 1520, 3-1, 64.750
31. Ypsilanti Lincoln, 1520, 3-1, 66.750
32. Midland, 1485, 4-0, 94.000
33. Port Huron, 1473, 3-1, 66.500
34. Traverse City Central, 1429, 3-1, 64.000
35. Oak Park, 1391, 4-0, 94.000
36. Lansing Everett, 1359, 4-0, 96.000
37. Birmingham Seaholm, 1349, 3-1, 62.500
38. Garden City, 1344, 3-1, 64.250
39. Portage Central, 1340, 3-1, 66.750
40. Muskegon Mona Shores, 1337, 3-1, 52.750
41. Birmingham Brother Rice, 1336, 3-1, 70.750
42. Portage Northern, 1328, 3-1, 70.750
43. Caledonia, 1308, 4-0, 90.000
44. Wyandotte Roosevelt, 1304, 4-0, 78.000
45. Farmington Hills Harrison, 1302, 3-1, 68.250
46. Farmington, 1278, 4-0, 90.000
47. Grand Rapids Forest Hills Central, 1278, 3-1, 64.750
48. Taylor Truman, 1253, 4-0, 88.000
49. Swartz Creek, 1223, 4-0, 90.000
50. Fenton, 1202, 3-1, 60.750
51. Grand Rapids Northview, 1180, 3-1, 62.000
52. Lowell, 1177, 3-1, 66.750
53. Bay City Western, 1171, 4-0, 72.000
54. Gibraltar Carlson, 1160, 4-0, 78.000
55. Muskegon, 1144, 4-0, 98.000
56. East Lansing, 1142, 4-0, 76.000
57. Mattawan, 1124, 4-0, 82.000
58. Marquette*, 1112, 3-1, 68.250
59. Redford Thurston, 1088, 3-1, 52.500
60. Auburn Hills Avondale, 1080, 4-0, 82.000
61. St. Johns, 1068, 4-0, 82.000
62. Zeeland East, 1067, 4-0, 88.000
63. Detroit East English, 1030, 3-1, 60.750
64. Lansing Waverly, 1011, 3-1, 54.750
65. St. Joseph, 974, 3-1, 58.500
66. Mason, 969, 4-0, 76.000
67. Milan, 959, 4-0, 78.000
68. Grand Rapids Christian, 954, 3-1, 68.750
69. Cedar Springs, 950, 3-1, 50.250
70. DeWitt, 931, 3-1, 62.750
71. Fruitport, 929, 4-0, 76.000
72. Orchard Lake St. Mary's, 926, 3-1, 66.750
73. Bloomfield Hills Lahser, 925, 4-0, 78.000
74. Linden, 923, 4-0, 92.000
75. Niles, 920, 3-1, 66.750
76. Hazel Park, 909, 3-1, 58.750
77. Stevensville Lakeshore, 906, 4-0, 94.000
78. St. Clair, 901, 4-0, 74.000
79. Tecumseh, 887, 4-0, 82.000
80. Carleton Airport, 868, 3-1, 60.500
81. Detroit Central Collegiate, 868, 3-1, 60.250
82. Hastings, 850, 3-1, 54.750
83. Plainwell, 832, 3-1, 62.750
84. Cadillac, 820, 4-0, 80.000
85. Madison Heights Lamphere, 814, 3-1, 60.750
86. Edwardsburg, 805, 3-1, 52.500
87. North Branch, 803, 3-1, 56.500
88. Hamilton, 801, 4-0, 80.000
89. Marysville, 794, 4-0, 84.000
90. Three Rivers, 760, 3-1, 52.500
91. Goodrich, 748, 3-1, 56.500
92. Dearborn Heights Robichaud, 720, 4-0, 82.000
93. Big Rapids, 706, 3-1, 48.750
94. Croswell-Lexington, 704, 4-0, 82.000
95. St. Clair Shores South Lake, 704, 3-1, 62.500
96. Pontiac Notre Dame Prep, 701, 4-0, 78.000
97. Otsego, 698, 3-1, 54.500
98. Detroit Country Day, 685, 3-1, 66.250
99. Comstock Park, 678, 3-1, 60.000
100. Grand Rapids Catholic Central, 674, 4-0, 76.000
101. Grand Rapids South Christian, 660, 3-1, 56.500
102. Battle Creek Pennfield, 656, 4-0, 56.000
103. Grosse Ile, 649, 3-1, 52.750
104. Saginaw Swan Valley, 642, 4-0, 72.000
105. Paw Paw, 639, 4-0, 68.000
106. Allendale, 636, 3-1, 66.500
107. Williamston, 636, 3-1, 56.750
108. Cheboygan, 631, 3-1, 58.500
109. Marine City, 629, 3-1, 66.250
110. Alma, 614, 3-1, 60.750
111. Saginaw Valley Lutheran, 608, 3-1, 36.750
112. Dowagiac, 605, 4-0, 74.000
113. Livonia Clarenceville, 597, 3-1, 57.417
114. Clawson, 582, 3-1, 46.500
115. Remus Chippewa Hills, 581, 3-1, 50.500
116. Essexville Garber, 572, 3-1, 54.500
117. Clinton Township Clintondale, 570, 4-0, 78.000
118. Lake Fenton, 564, 3-1, 54.500
119. Freeland, 561, 3-1, 54.500
120. Kingsford, 559, 3-1, 50.750
121. Portland, 555, 4-0, 72.000
122. Flint Powers Catholic, 542, 4-0, 78.000
123. Menominee, 539, 4-0, 82.000
124. Macomb Lutheran North, 537, 4-0, 74.000
125. Hopkins, 531, 4-0, 64.000
126. Detroit University Prep, 528, 4-0, 72.667
127. Grayling, 516, 4-0, 66.000
128. Ann Arbor Gabriel Richard, 515, 3-1, 48.750
129. Allen Park Cabrini, 512, 3-1, 42.750
130. Olivet, 509, 3-1, 48.750
131. Frankenmuth, 507, 4-0, 72.000
132. Newaygo, 507, 3-1, 54.750
133. Ida, 503, 4-0, 64.000
134. River Rouge, 495, 4-0, 66.667
135. Carrollton, 492, 4-0, 56.000
136. Lansing Catholic, 487, 3-1, 52.500
137. Reed City, 480, 4-0, 70.000
138. Muskegon Oakridge, 474, 4-0, 68.000
139. Kingsley, 473, 3-1, 40.250
140. Jackson Lumen Christi, 472, 4-0, 74.000
141. Buchanan, 467, 3-1, 50.500
142. Leslie, 467, 4-0, 66.000
143. Roscommon, 461, 3-1, 46.750
144. Kalkaska, 459, 3-1, 38.750
145. Millington*, 459, 3-1, 58.750
146. Warren Michigan Collegiate, 446, 4-0, 66.000
147. Boyne City, 437, 4-0, 66.000
148. Monroe St. Mary Catholic Central, 437, 3-1, 52.500
149. Negaunee, 433, 4-0, 66.000
150. Beaverton, 422, 3-1, 40.250
151. Hemlock, 421, 3-1, 56.750
152. Shelby, 417, 4-0, 78.000
153. Vassar, 416, 4-0, 50.000
154. Clinton, 413, 4-0, 68.000
155. Maple City Glen Lake, 409, 4-0, 54.000
156. Michigan Center, 406, 4-0, 64.000
157. Manchester, 404, 3-1, 44.750
158. Ithaca, 402, 4-0, 76.000
159. Montrose Hill-McCloy, 400, 3-1, 58.750
160. Niles Brandywine, 396, 3-1, 38.917
161. Grass Lake, 395, 3-1, 48.750
162. Hillsdale, 391, 4-0, 70.000
163. Madison Heights Madison, 391, 3-1, 58.000
164. Ecorse, 390, 3-1, 42.500
165. Montague, 390, 3-1, 50.750
166. Sanford Meridian, 388, 3-1, 48.250
167. Saranac, 383, 3-1, 50.250
168. Constantine, 371, 3-1, 44.750
169. Grandville Calvin Christian, 371, 3-1, 46.750
170. Watervliet, 369, 4-0, 48.000
171. Schoolcraft, 366, 4-0, 68.000
172. Byron Area, 364, 3-1, 40.750
173. Reese, 350, 4-0, 54.000
174. Union City, 350, 4-0, 54.000
175. Burton Bendle, 348, 3-1, 40.750
176. Pellston, 347, 4-0, 32.000
177. Saginaw Nouvel, 344, 3-1, 64.750
178. Carson City-Crystal, 337, 3-1, 34.250
179. Hartford, 337, 4-0, 62.667
180. Marlette, 336, 4-0, 56.000
181. Whittemore-Prescott, 328, 3-1, 40.750
182. Lawton, 317, 4-0, 60.000
183. Lake City, 316, 4-0, 48.000
184. Pewamo-Westphalia, 316, 3-1, 46.500
185. Hesperia, 309, 3-1, 38.500
186. Ishpeming, 307, 4-0, 62.000
187. Unionville-Sebewaing, 303, 3-1, 38.500
188. Evart, 302, 3-1, 34.750
189. Homer, 302, 3-1, 36.750
190. Detroit Loyola, 298, 4-0, 76.000
191. Lincoln Alcona, 292, 3-1, 30.500
192. Genesee, 288, 3-1, 34.000
193. Mancelona, 288, 4-0, 50.000
194. Royal Oak Shrine Catholic, 284, 3-1, 56.750
195. Grosse Pointe Woods University Liggett, 283, 3-1, 36.500
196. Reading, 283, 3-1, 38.500
197. Decatur, 277, 4-0, 50.000
198. Gobles, 271, 3-1, 38.750
199. Ottawa Lake Whiteford, 268, 3-1, 40.750
200. Waterford Our Lady, 263, 4-0, 64.000
201. Newberry, 260, 3-1, 26.750
202. Mayville, 258, 3-1, 50.500
203. Melvindale Academy for Business & Tech, 254, 3-1, 52.500
204. Marcellus, 249, 4-0, 44.000
205. Harbor Beach, 245, 3-1, 38.750
206. Vestaburg, 242, 3-1, 36.500
207. Coleman, 239, 3-1, 38.250
208. New Lothrop, 237, 4-0, 64.000
209. Bessemer*, 233, 3-1, 38.750
210. L'Anse, 233, 4-0, 54.000
211. Petersburg-Summerfield, 232, 3-1, 40.750
212. Atlanta, 224, 3-1, 30.917
213. Mendon, 216, 4-0, 50.000
214. Beal City, 213, 4-0, 68.000
215. Pittsford, 213, 3-1, 36.250
216. Morenci, 207, 3-1, 40.000
217. St. Ignace La Salle, 207, 4-0, 46.000
218. Pickford, 197, 4-0, 48.000
219. Onaway, 194, 4-0, 38.000
220. Powers North Central, 194, 3-1, 26.250
221. Fowler, 186, 3-1, 48.750
222. Climax-Scotts, 183, 4-0, 44.000
223. Morrice, 171, 4-0, 48.000
224. St. Joseph Lake Michigan Catholic*, 171, 3-0, 46.667
225. Colon, 164, 3-1, 30.750
226. Crystal Falls Forest Park, 164, 4-0, 48.000
227. Mt. Pleasant Sacred Heart, 121, 3-1, 42.750
228. Iron Mountain North Dickinson*^, 112, 4-0, 54.000
229. Ashley, 99, 3-1, 28.500
---------------------------------------------------------------------------------
8-Player Playoff Listing
1. Deckerville, 194, 3-1, 36.750
2. Battle Creek St. Philip, 182, 3-1, 34.750
3. Kingston, 175, 3-1, 30.500
4. Cedarville, 169, 4-0, 45.333
5. Peck, 156, 4-0, 40.000
6. Eben Junction Superior Central, 132, 4-0, 42.000
7. Rapid River, 115, 4-0, 34.000
8. Portland St. Patrick, 104, 4-0, 46.000
9. Owendale-Gagetown, 60, 3-1, 32.250
1st & Goal: 2021 Week 2 in Review
By
Geoff Kimmerly
MHSAA.com senior editor
September 6, 2021
From Niles to Napoleon to Petoskey, teams that frequently were stopped in their tracks a year ago have successfully made that first cut into the open over the first two weeks of the 2021 season.
Others like Detroit Cass Tech and Martin Luther King have found full stride – their breakaways coming over the weekend against a pair of annual contenders from the opposite side of the Lower Peninsula and right on time to set up potentially the most high-powered matchup of this regular season.
Below is a glance at especially eye-catching scores and some of the stories behind them from Week 2.
Bay & Thumb
HEADLINER Bad Axe 42, Cass City 0 The game that couldn’t be played last season was finally played last week, and Bad Axe sent a statement in the Greater Thumb Conference West. Both Bad Axe (2-0) and Cass City (0-2) had finished unbeaten in the league last season, but their early-season game had been canceled. The Hatchets won this matchup for the first time since 2014, ripping 50 and 60-yard touchdown runs on the way. Click for more from the Huron Daily Tribune.
Watch list Croswell-Lexington 28, North Branch 7 The Pioneers’ lost last season only twice, both times to eventual Blue Water Area Conference and District champion North Branch. Circle Croswell-Lexington’s Week 5 against Richmond as a potential BWAC title decider.
Remember this one Standish-Sterling 27, Ithaca 20 While last week’s big win over Pinconning was worth celebrating too, this week’s Panthers victory over Ithaca could be much more telling of a potential turnaround. Standish-Sterling (2-0) is seeking its first winning season since 2013; its only victory last season came by forfeit.
More shoutouts Marlette 36, Sandusky 12 The Red Raiders (1-1) defeated reigning GTC East champion Sandusky for the first time since 2013. Grand Blanc 38, Grand Rapids Forest Hills Central 34 The Bobcats moved to 2-0 thanks to Hunter Ames’ 74-yard go-ahead touchdown toss to Nasir Carson with 30 seconds to play.
Greater Detroit
HEADLINER Detroit Martin Luther King 40, Muskegon Mona Shores 19 With their first of three recent meetings in the 2019 Division 2 Final, these two have arguably the best cross-state series running. The Sailors (1-1) won the first two matchups and had won 19 straight including the last two Division 2 titles. King (1-1) couldn’t have earned a better bounce-back after falling in its opener on a game-ending touchdown pass. Click for more from the Detroit Free Press.
Detroit King junior running back Sterling Anderson Jr. (@TheRealSterl) with two rushing touchdowns in the win over Mona Shores tonight. @DetKingFootball @coachtspence #StateChamps X @LTUAthletics pic.twitter.com/hBHdTPqW6z
— STATE CHAMPS! Michigan (@statechampsmich) September 4, 2021
Watch list Detroit Cass Tech 49, Muskegon 14 Undefeated Cass Tech’s dominating performance on the road against one of the top programs in the state just added to the anticipation of this week’s matchup with King.
Remember this one Warren De La Salle 38, River Rouge 29 Both had to scramble after losing Week 2 opponents, and the result was a high-caliber matchup between two teams that ended at Ford Field last season.
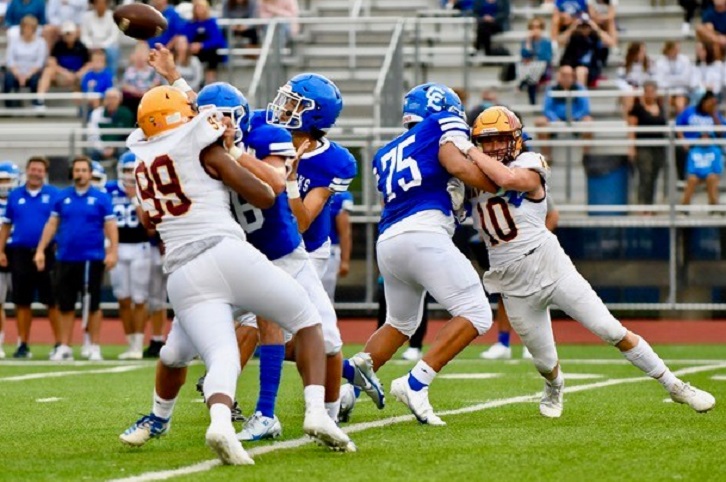
More shoutouts Detroit Catholic Central 35, Davison 14 The Shamrocks quickly bounced back from their Week 1 loss to Chippewa Valley with a solid win over a Davison team that while 0-2 has to be one of the best teams in Michigan still looking for a first win. Orchard Lake St. Mary’s 17, Hudsonville 15 The Eaglets are 2-0 with those wins by a combined seven points against strong opponents; consider Hudsonville another of the best 0-2 teams in the state after two defeats by a combined six points against top competition.
Mid-Michigan
HEADLINER Portland 20, DeWitt 17 Keeping in mind that Portland played for the Division 5 championship just three seasons ago and had split games the last two seasons with the Panthers (1-1), this one still reverberated across the state. That’s mostly because of how the Raiders pulled it off. First, Portland (2-0) stopped a veteran DeWitt offense that averaged 45 points per game last year and scored 47 in its season opener. Then came the game-winning score with 22 seconds to play. Click for more from the Ionia Sentinel-Standard.
Watch list Hartland 19, Novi 7 The Eagles are seeking their first winning season since 2015 and are off to a 2-0 start for the second season in a row. They just missed getting back over the hump last year finishing 3-4 with two close losses at the end.
Remember this one Corunna 20, Hemlock 13 The Cavaliers (1-1) won more games last season than the previous two combined in going 5-4. If they take another step, this could be remembered as the win that put them back on the right track. Jaden Edington’s touchdown run with 10:26 left was the game-winner.
More shoutouts Hastings 38, Battle Creek Harper Creek 35 The reigning Interstate 8 Athletic Conference champ Saxons (2-0) survived a close one as they embarked on their repeat quest. Lansing Catholic 30, Williamston 21 Portland is going to get all the buzz coming out of this week, but the Cougars also showed against a top-tier program that they’ll be in the thick of the Capital Area Activities Conference White race as well.
Northern Lower Peninsula
HEADLINER Kingsley 48, Maple City Glen Lake 0 The Stags (2-0) are going to be a team we all watch this season. They’ve now won 22 of their last 23 on the field, and Glen Lake (1-1) hadn’t taken a loss of this magnitude since the teams’ 2019 meeting (after which the Lakers bounced back to finish Division 6 runner-up). League play starts next week for both, and you can already circle Kingsley vs. Traverse City St. Francis in Week 9 among the most intriguing regular-season finales statewide. Click for more from the Traverse City Record-Eagle.
Watch list Petoskey 44, Escanaba 27 The Northmen (2-0) haven’t won more than two games in a season since 2018, but that’s almost assured with this especially impressive as Escanaba (1-1) has been one of the Upper Peninsula’s best again over the last half-decade.
Remember this one Boyne City 27, Charlevoix 8 The Ramblers (2-0) had dropped two straight to the Red Rayders, who suffered their first regular-season loss since Week 8 of 2019.
More shoutouts Traverse City Central 60, Marquette 28 The Trojans (1-1) bounced back from an opening loss to DeWitt with their seventh-straight win over Marquette (1-1). Elk Rapids 48, Johannesburg-Lewiston 28 Even with the Cardinals (0-2) off to a rare slow start, this provided plenty of reason to celebrate after Elk Rapids won once last season.
Southeast & Border
HEADLINER Hudson 22, Erie Mason 0 The Tigers raised some eyes with an opening-night win over Ithaca, and many more will be watching now that they’ve shut out the reigning Tri-County Conference champion as well. They are 2-0 for the first time since 2017, and they have another opportunity to make some noise this week when they start the Lenawee County Athletic Association schedule against last season’s Division 6 runner-up Clinton. Click for more from the Adrian Daily Telegram.
Watch list Napoleon 54, East Jackson 0 The Pirates are 2-0 for the first time since 2002, and already have doubled their victory total from 2020.
Remember this one Ottawa Lake Whiteford 34, Ida 14 In these teams’ first meeting since 1976, Whiteford earned its first win over Ida since 1968 according to Michigan-football.com.
More shoutouts Reading 30, Grass Lake 12 The Rangers’ defense has been especially impressive so far, following up a shutout by giving up only 12 points to a Warriors team that hasn’t finishing below .500 since 2001. Milan 27, New Boston Huron 19 These two tied for second in the Huron League last season behind Riverview. This season’s race is only getting started, of course, and Huron (1-1) gets the undefeated Pirates this week while Milan has defeated opponents that went a combined 16-3 in 2020.
Southwest Corridor
HEADLINER Niles 26, Buchanan 0 Former Three Rivers coach Scott Shaw – who led that program to the 2003 Division 4 title – has made Niles another team on the rise in his first season. The Vikings won one game a year ago, two the season before and no more than three since 2014. But Niles followed up an opening-night victory over Sturgis with this shutout of the Bucks, who finished 8-1 in 2020. Click for more from the South Bend Tribune.
Watch list Niles Brandywine 30, Cassopolis 24 After opening with a win over reigning Division 8 champ Centreville, Brandywine moved to 2-0 against a Rangers team (1-1) looking to bounce back from a rare off year.
Remember this one Battle Creek Lakeview 42, Portage Northern 21 The Spartans (2-0) also are off to a strong start, including this win over the team that would’ve had a claim to the Southwestern Michigan Athletic Conference title if one had been awarded during the abbreviated 2020 season. Lakeview takes on River Rouge this week – an excellent test – and regardless of the result should be a contender in the SMAC when it returns to league play Week 4.
More shoutouts Centreville 28, Schoolcraft 7 The Bulldogs (1-1) rebounded from that Brandywine defeat by handing the second this fall to last season Division 7 semifinalist Schoolcraft. Stevensville Lakeshore 41, Kalamazoo United 19 Ryan Korfmacher set a Lakeshore passing record with 385 yards as his team moved to 2-0.
Upper Peninsula
HEADLINER Ishpeming Westwood 28, Iron Mountain 0 The Patriots (2-0) already look like the team to beat in the Western Peninsula Athletic Conference Copper, and running back Zack Carlson just missed getting to 10 touchdowns before Labor Day. And don’t forget the defense, which handed the Mountaineers (1-1) their first shutout since 2018. Click for more from the Iron Mountain Daily News.
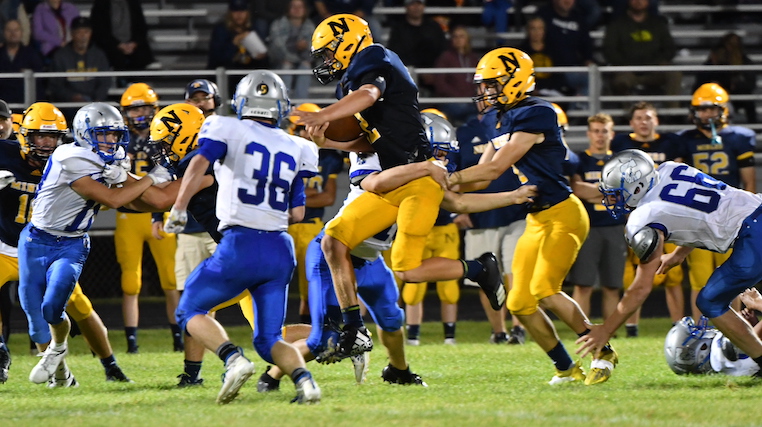
Watch list Negaunee 35, Calumet 21 The Miners (1-1), who lost by two Week 1 to Iron Mountain, are now the main candidates standing in the way of a Westwood league title – although Calumet (0-2) still has a say as well and will face Westwood this week.
Remember this one Bark River-Harris 53, West Iron County 6 The Broncos (2-0) already look very good in the West-PAC Iron title race at 2-0 with two games to play and this big win over a Wykons team coming off an undefeated 2020 regular season.
More shoutouts Hancock 20, Ishpeming 12 The Bulldogs (1-1) bounced back nicely from an opening-night loss, while handing Ishpeming (1-1) its first of the fall. Kingsford 21, Gladstone 6 The Flivvers (2-0) haven’t lost in this series since 1998 and this fall have given up only 12 points total.
West Michigan
HEADLINER Muskegon Oakridge 32, Whitehall 19 Although reigning champ Montague bounced back big from its Week 1 loss, this early matchup very well could have a lot to say in the West Michigan Conference race before it’s over. Oakridge (2-0) got up by 20 during the third quarter and held on the rest of the way. The Eagles see Montague in Week 4, and Whitehall (1-1) gets the Wildcats in Week 8. Click for more from the Muskegon Chronicle.
Watch list Spring Lake 56, Zeeland East 21 Spring Lake had to wait an extra week to get started, taking a forfeit win in Week 1. But the Lakers were the talk of West Michigan once they finally got on the field, impressing against one of the region’s annual powers.
Remember this one Rockford 35, Cedar Springs 6 This was a great sign for the Rams heading into Ottawa-Kent Conference Red play, especially defensively, as Cedar Springs is likely again to make some noise in the Gold.
More shoutouts Allendale 14, Hopkins 0 The Falcons head into O-K Blue play coming off a shutout of last season’s Silver champion. East Grand Rapids 30, Grand Rapids South Christian 21 The Pioneers (1-1) rebounded from an opening loss to run their winning streak over the Sailors to five with the O-K White schedule set to begin.
8-Player
HEADLINER Deckerville 50, Mount Pleasant Sacred Heart 26 The Eagles also had to wait an extra week to get rolling, but it didn’t take long for them to catch up against an Irish team that reached the Division 2 Regional Finals last season. Both should contend in North Central Thumb League divisions, Deckerville after finishing third in the Stars last season and Sacred Heart coming off a runner-up run in the Stripes.
Watch list Mio 12, Hillman 0 The Thunderbolts went from 9-2 in 2019 to 0-6 in 2020, but at 2-0 they’re headed back up in a hurry. They have yet to give up a point.
Remember this one Rudyard 63, Cedarville 6 The Bulldogs (2-0) had lost all eight games to Cedarville since moving to 8-player football in 2016, and they also upped their scoring margin this fall to a combined 115-6.
More shoutouts Lake Linden-Hubbell 60, Rapid River 6 The Lakes (2-0) are finding their footing in 8-player and have outscored their first two opponents of the season by a combined 102-14. Pellston 36, Hale 12 After trailing at the half, Pellston (2-0) outscored Hale 28-0 during the second to run its regular-season winning streak to 10.
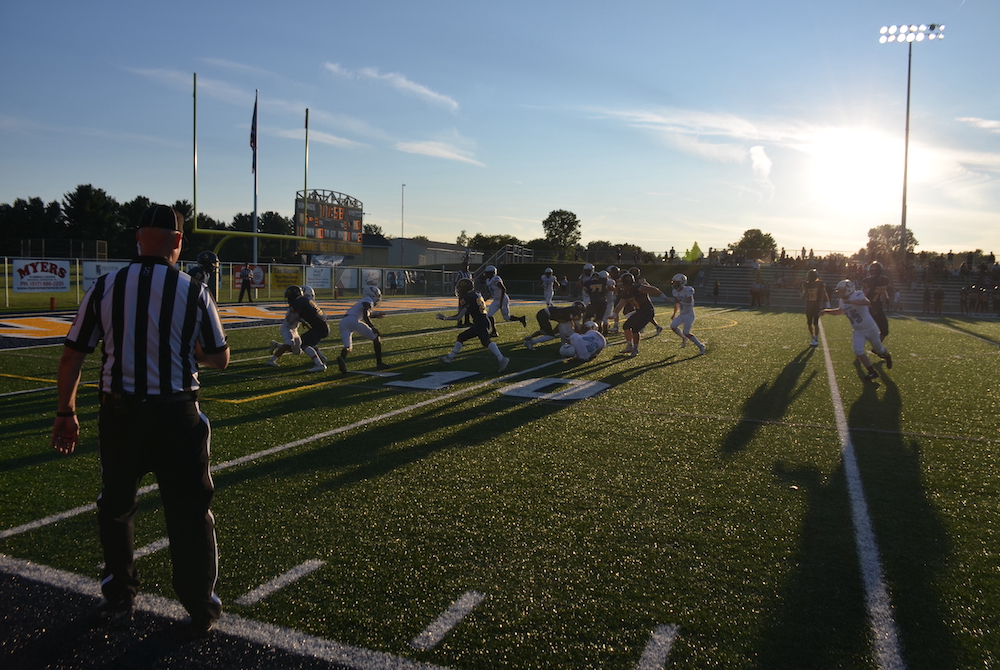
PHOTOS: (Top) Haslett drives on Okemos during Thursday's 47-0 win. (Middle) Detroit Catholic Central's Declan Byle unloads a pass as Davison defenders close in. (Below) Negaunee quarterback Gerald Johnson keeps the ball but is tackled by Calumet's Hans Killunen. (Photos by John Johnson, Terry Lyons and Cara Kamps, respectively.)