

Week 6 Football Playoff Listing
September 26, 2012
Here is a list of Michigan High School Athletic Association football playing schools, displaying their win-loss records and playoff averages through the fifth week of the season. Schools on this list are in enrollment order. An asterisk (*) beside a record indicates that a team has eight or fewer games scheduled. A carrot (^) beside a school’s name indicates that a team is one win away from playoff qualification.
Those schools with 11-player teams with six or more wins playing nine-game schedules, or five or more wins playing eight games or fewer, will qualify for the MHSAA Football Playoffs beginning Oct. 26-27. Schools with 5-4, 4-3 or 4-4 records may qualify if the number of potential qualifiers by win total does not reach the 256 mark. Schools with six or more wins playing nine-game schedules or five or more wins playing eight games or fewer may be subtracted from the field based on playoff average if the number of potential qualifiers exceeds the 256 mark.
Once the 256 qualifying schools are determined, they will be divided by enrollment groups into eight equal divisions of 32 schools, and then drawn into regions of eight teams each and districts of four teams each.
Those schools with 8-player teams will be ranked by playoff average at season’s end, and the top 16 programs will be drawn into regions of eight teams each for the playoff in that division, which also begins Oct. 26-27.
To review a list of all football playoff schools, individual school playoff point details and to report errors, visit the Football page of the MHSAA Website.
The announcement of the qualifiers and first-round pairings for both the 11 and 8-player playoffs will take place at 7 p.m. on Oct. 21 on the Selection Sunday Show on FOX Sports Detroit. The playoff qualifiers and pairings will be posted to the MHSAA Website following the Selection Sunday Show.
---------------------------------------------------------------------------------
11-Player Playoff Listing
|
1. |
Utica Eisenhower |
2772 |
3-2 |
62.000 |
|
2. |
Sterling Heights Stevenson |
2766 |
4-1 |
75.800 |
|
3. |
Clarkston ^ |
2721 |
5-0 |
94.400 |
|
4. |
Grand Blanc |
2644 |
3-2 |
57.600 |
|
5. |
Macomb Dakota |
2608 |
4-1 |
80.600 |
|
6. |
Lake Orion ^ |
2565 |
5-0 |
96.000 |
|
7. |
Rockford |
2526 |
3-2 |
57.400 |
|
8. |
Troy |
2502 |
3-2 |
57.400 |
|
9. |
Clinton Township Chippewa Valley |
2462 |
4-1 |
77.000 |
|
10. |
Dearborn Fordson |
2442 |
4-1 |
83.400 |
|
11. |
Holland West Ottawa |
2262 |
4-1 |
71.000 |
|
12. |
Northville |
2220 |
3-2 |
60.400 |
|
13. |
Detroit Cass Tech |
2200 |
4-1 |
77.400 |
|
14. |
Canton |
2166 |
3-2 |
51.200 |
|
15. |
Monroe ^ |
2154 |
5-0 |
83.200 |
|
16. |
Detroit Catholic Central |
2060 |
3-2 |
47.800 |
|
17. |
Plymouth |
2050 |
4-1 |
71.200 |
|
18. |
Salem |
2039 |
4-1 |
75.600 |
|
19. |
Livonia Stevenson |
2005 |
4-1 |
77.200 |
|
20. |
Holt |
1992 |
3-2 |
57.200 |
|
21. |
Hartland ^ |
1932 |
5-0 |
91.200 |
|
22. |
Warren Mott ^ |
1879 |
5-0 |
86.400 |
|
23. |
Livonia Churchill ^ |
1877 |
5-0 |
100.800 |
|
24. |
Walled Lake Central |
1857 |
3-2 |
52.200 |
|
25. |
Macomb L'Anse Creuse North |
1853 |
3-2 |
58.400 |
|
26. |
Saline |
1849 |
4-1 |
72.400 |
|
27. |
Grandville |
1846 |
3-2 |
53.600 |
|
28. |
Flint Carman-Ainsworth ^ |
1772 |
5-0 |
88.000 |
|
29. |
Grand Ledge |
1743 |
4-1 |
70.600 |
|
30. |
Rochester |
1725 |
4-1 |
72.800 |
|
31. |
Traverse City West |
1720 |
4-1 |
72.200 |
|
32. |
White Lake Lakeland |
1700 |
4-1 |
72.400 |
|
33. |
Harrison Township L'Anse Creuse |
1680 |
3-2 |
Be the Referee: Football Holding
By
Sam Davis
MHSAA Director of Officials
August 27, 2024
Be The Referee is a series of short messages designed to help educate people on the rules of different sports, to help them better understand the art of officiating, and to recruit officials.
Below is this week's segment – Football Holding - Listen
In football, it’s often said that holding happens on every play. But does it?
When an offensive player uses their hands or arms to illegally restrain a defensive player – that’s holding. This typically happens when blockers grab or pull defensive players away from their path – impeding their ability to make a play. The penalty is 10 yards from the previous spot.
Defensive players can be flagged for holding as well. That’s also a 10-yard penalty. An example of defensive holding is when a cornerback grabs a receiver to slow him down before the ball is thrown. If that same contact happens while the pass is in the air – then it’s pass interference. Defensive pass interference is a 15-yard penalty.
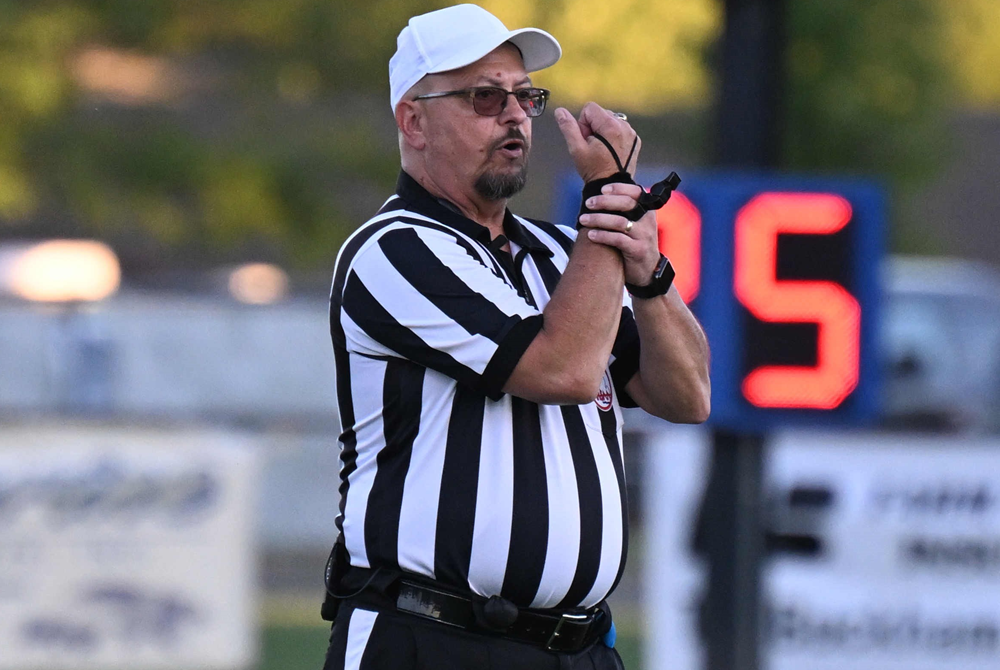
PHOTO A football official signals holding during a 2023 game. (Photo by Gary Shook.)