

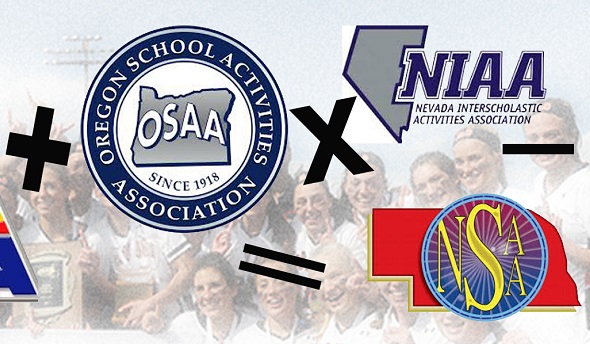
Add, Subtract, Divide, Multiply: MHSAA Not Alone
July 25, 2017
By Rob Kaminski
MHSAA benchmarks editor
This is the third part in a series on MHSAA tournament classification, past and present, that will be published over the next two weeks. This series originally ran in this spring's edition of MHSAA benchmarks.
As the MHSAA faces its most recent classification task with 8-Player Football, and opinions continue to swirl about as to the method, timeframe, location and other procedures, a look around the country provides plenty of company among state association brethren factoring variables into their own equations.
In the Pacific Northwest, the Oregon School Activities Association Football Playoffs are under public scrutiny as leadership ponders a five or six classification format beginning with the 2018-19 school year.
The OSAA has crowned six champions on the gridiron since 2006-07. Many of the state’s smaller schools would like to keep it that way, while larger schools lean toward a five-classification system, citing larger leagues, ease of travel and credibility to state championships as the advantages.
Still others would prefer more than six classes, pointing to safety issues and the opportunity to increase participation numbers as positives.
Moving southeast of Oregon, the Nevada Interscholastic Activities Association recently voted to hold serve on a classification proposal that was volleyed to the membership.
However, changes still could be forthcoming by as early as the 2018-19 season which would add a fifth classification in more populated southern Nevada while allowing northern schools to participate in four classifications. Such divisions could mean no state championship for the fifth class in southern Nevada.
Because of that, the NIAA wants equal numbers of schools in each classification on both ends of the state. Complicating the issue is the fact that the 24 largest schools in the state, by enrollment, are all in Clark County in Southern Nevada.
Across Nevada’s border into Arizona, charter schools are asking the Arizona Interscholastic Association to reconsider classification that was voted upon and approved in September 2015. That agreement called for the largest 33 percent of charter schools by enrollment to be placed in the state’s largest school classification, 3A, the middle 33 percent into 2A, and the smallest 33 percent into 1A.
Less than two years later the charter schools have had a change of heart and have asked to be considered the same as other Arizona public schools and be placed appropriately by enrollment beginning with the 2018-19 school year.
The situation in Arizona further illustrates how the public/private debate that all state associations have faced throughout existence now has the added dynamic of rapidly growing charter schools in today’s educational system, along with virtual school enrollment.
In the nation’s heartland, Nebraska has retooled its football classifications by using enrollment of boys students only in its schools rather than total enrollment. The Nebraska School Activities Association football-playing schools will kick off the 2018 season using this alignment.
Nebraska has three classes of 11-player football, with the smallest class divided in two, Class C-1 and C-2. The state also will have 8-player football for boys enrollments under 47, and the NSAA will sponsor a new 6-player tournament in 2018 for schools with 27 or fewer boys.
“This is a good proposal because some schools have a sizable imbalance between the number of boys and girls, and there’s a large gap (in enrollment) between the largest and smallest schools in Classes A and B,” NSAA executive director Jim Tenopir said. “I think this addresses both of those concerns.”
Swimmers in Georgia, meanwhile, will feel like they are moving with the current, rather than upstream in 2017-18, as the Georgia High School Association recently doubled the number of team championship events from two to four.
Swim enthusiasts can also count on longer days at the finals, as the top 30 finishers from the prelims will advance to the finals instead of 20, and all championship events will have three heats versus two.

MHSAA Sports Participation Continues Upward Trend for 3rd-Straight Year
By
Geoff Kimmerly
MHSAA.com senior editor
August 6, 2024
Participation in Michigan High School Athletic Association-sponsored sports rose for the third-straight school year in 2023-24 – this time by nearly one percent – and continued to do so despite another 2-percent decrease in school enrollment among the MHSAA’s 754 member high schools.
A total of 270,664 participants were counted across the 28 sports for which the MHSAA sponsors postseason tournaments – a 0.97-percent increase from 2022-23 and despite a 1.8-percent decrease in MHSAA member school enrollment. Boys participation rose 1.1 percent to 158,260, despite a 1.8 percent decrease in boys enrollment. Girls participation rose 0.7 percent to 112,377, while girls enrollment dipped 1.9 percent from the previous school year.
MHSAA participation totals count students once for each sport in which they participate, meaning students who are multiple-sport athletes are counted more than once. The boys participation total for 2023-24 was its highest since 2018-19, predating the sharp decrease brought on by the COVID-19 pandemic during the 2020-21 school year.
Only 11 sports saw increases in participation during 2023-24 – compared to 18 sports that reported increases between 2021-22 and 2022-23. However, two sports set participation records this past school year. Girls golf reported 3,936 athletes, an increase of 6.2 percent from the previous year and that sport’s most since 2002-03. Girls lacrosse broke its record set in 2019-20 with 3,245 athletes, up nine-tenths of a percent from the previous year.
Wrestling reported the largest increase in participation for the second-straight school year, this time by 12.8 percent with 11,814 athletes – and the rise again mostly attributable to the rapid growth in girls participation in the sport, which jumped another 39 percent with 1,216 wrestlers this past season. Girls tennis enjoyed the next largest participation jump, increasing 9.1 percent with 8,911 athletes, that sport’s most since 2018-19.
Both girls and boys track & field increased for the third-straight year, girls by 5.2 percent to 17,325 competitors and boys 2.9 percent to 23,888. Boys lacrosse (up 3.9 percent to 5,236 athletes) and boys golf (up 3.3 percent to 7,222) also joined their girls counterparts in those sports in trending upward.
Boys soccer (up 5.1 percent to 13,953 athletes), girls competitive cheer (3.9 percent to 6,172) and football (11 and 8-player combined – 0.5 percent to 35,174) also showed increases. Football remains the most-played sport statewide with more than 11,000 more athletes than the next highest, boys track & field, and the 2023-24 football participation total was that sport’s highest since 2018-19. Boys basketball (20,199 participants), girls volleyball (19,119) and girls track & field ranked third through fifth, respectively, among the state’s most-played sports this past school year.
Although 17 sports saw lower participation in 2023-24 than the previous year, five experienced decreases smaller than the overall 1.8-percent loss in enrollment at member schools – boys ice hockey (-0.03 percent with just one fewer participant than in 2022-23), girls soccer (-0.3 percent), girls volleyball (-0.8 percent), boys tennis (-1.2 percent), boys cross country (-1.3 percent) and girls softball (-1.5 percent). Girls cross country just missed that line with only a 1.9-percent decrease from the previous year.
The participation figures are gathered annually from MHSAA member schools to submit to the National Federation of State High School Associations (NFHS) for compiling of its national participation survey. Results of Michigan surveys from the 2000-01 school year to present may be viewed on the Sports Participation Listing page of MHSAA.com.
The following chart shows participation figures for the 2023-24 school year from MHSAA member schools for sports in which the Association sponsors a postseason tournament:
|
BOYS |
|
GIRLS |
||
|
Sport |
Schools (A) |
Participants |
Schools (A) |
Participants (B) |
|
Baseball |
664/11 |
16,294 |
- |
-/15 |
|
Basketball |
730/3 |
20,193 |
722 |
13,113/6 |
|
Bowling |
431/0 |
4,292 |
425 |
2,767 |
|
Competitive Cheer |
- |
- |
348 |
6,172 |
|
Cross Country |
676/0 |
7,886 |
672 |
6,729 |
|
Football - 11 player |
509/78 |
32,431 |
- |
-/143 |
|
8-player |
120/16 |
2,583 |
- |
-/17 |
|
Golf |
549/41 |
7,135 |
389 |
3,936/87 |
|
Gymnastics |
- |
- |
104 |
529 |
|
Ice Hockey |
326/10 |
3,117 |
- |
-/11 |
|
Lacrosse |
187/13 |
5,210 |
132 |
3,245/26 |
|
Skiing |
135/0 |
822 |
133 |
786 |
|
Soccer |
495/15 |
13,903 |
490 |
11,829/50 |
|
Softball |
- |
- |
645 |
11,544 |
|
Swimming & Diving |
282/17 |
3,990 |
287 |
4,726/48 |
|
Tennis |
305/15 |
5,918 |
335 |
8,911/27 |
|
Track & Field |
692/0 |
23,888 |
694 |
17,325 |
|
Volleyball |
- |
- |
719 |
19,119 |
|
Wrestling |
511/288 |
10,598 |
-/1,216 |
(A) The first number is the number of schools reporting sponsorship on the Sports Participation Survey, including primary and secondary schools in cooperative programs as of May 15, 2024. The second number indicates the number of schools that had girls playing on teams consisting primarily of boys.
(B) The second number indicates the number of additional girls playing on teams consisting primarily of boys and entered in boys competition.