

Click for Hot Weather and Hydration Resources
July 24, 2012
The extreme temperatures this Summer in advance of the start of another season of high school sports give cause for concern about physical activity in such conditions, and the Michigan High School Athletic Association continues its role in providing its member schools educational information to assist them in minimizing the possibility of heat-related catastrophic injuries to student-athletes.
The topic of heat-related injuries receives a lot of attention at this time of year, especially when deaths at the professional, collegiate and interscholastic levels of sport occur, and especially since they are preventable in most cases with the proper precautions. In football, data from the National Federation of State High School Associations shows that 35 high school players have died from heat stroke between 1995 and 2010.
Each year, the MHSAA provides information to its member schools to help them prepare for hot weather practice and game conditions in the late Summer and early Fall. Football practice can begin at MHSAA member schools on August 6, followed by all other Fall sports on August 8.
Even before the days of the Internet, the MHSAA was providing resources each Spring to assist schools in their preparation for hot preseason practices. That same information is now available online for all interested parties to utilize, including a link to a free online course, A Guide to Heat Acclimatization and Heat Illness Prevention, produced by the National Federation of State High School Associations. The Health & Safety Resources page of the MHSAA Website has a set of Frequently Asked Questions about dehydration and a page dedicated to hydration and heat illness where preventative steps are outlined, as well as the signs and symptoms of heat illness and action steps to take when it is observed.
Visit MHSAA.com, click on Schools, and then on Health & Safety Resources to find the information.
“Heat stroke is almost always preventable,” said John E. “Jack” Roberts, executive director of the MHSAA. “We know now more than we ever have about when the risk is high and who is most at risk, and we’re fortunate to be able to communicate that information better than ever before to administrators, coaches, athletes and parents. We encourage everyone to avail themselves of the information on our website and through other sources, and to take the online course through the National Federation.”
Roberts added that the first days of formal practices in hot weather should be more for heat acclimatization than the conditioning of athletes, and that practices in such conditions need planning to become longer and more strenuous over a gradual progression of time.
“Then, schools need to be vigilant about providing water during practices, making sure that youngsters are partaking of water and educating their teams about the need for good hydration practices away from the practice and competition fields,” Roberts said.
Records Set Despite Overall Participation Dip
July 9, 2014
By Geoff Kimmerly
Second Half editor
Participation in high school sports in which postseason tournaments are sponsored by the Michigan High School Athletic Association decreased slightly for the third straight school year in 2013-14, following a continuing trend of declining member school enrollments.
However, nine MHSAA sports saw increases in participation from 2012-13, and four sports set records for the second straight school year.
A total of 288,230 participants took part in the 28 tournament sports offered by the MHSAA during the past year – a 1.9-percent decrease from the 2012-13 figure of 293,810. However, enrollments at member schools also decreased 0.7 percent from 2012-13 and have fallen 10 percent since the 2006-07 school year – while MHSAA participation has fallen only 7.9 percent during that time. This year’s dip was slightly larger than the 1.2-percent decrease from 2011-12 to 2012-13.
Overall boys participation fell 1.7 percent from 2012-13 to 2013-14, while girls participation fell 2.2 percent. The overall MHSAA totals count students once for each sport in which they participate, meaning students who are multiple-sport athletes are counted more than once.
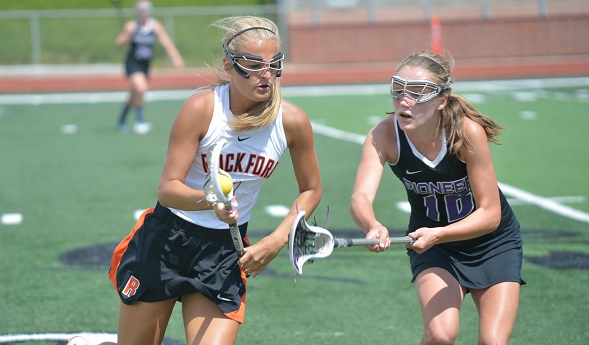
For the second straight school year, both boys and girls lacrosse (5,089 and 2,540, respectively) and boys and girls cross country (8,882 and 8,703) set participation records. Both lacrosse totals have increased annually during their 10 years as MHSAA tournament sports; the girls saw an increase of 1.6 percent from 2012-13. Participation in both boys and girls cross country increased for the fifth straight seasons – the girls this time by 3.9 percent.
Three girls sports rebounded from recent declines. Girls swimming and diving (6,604) broke a two-year downturn in participation with its highest total since 2010-11, while girls golf (3,427) increased by 2.8 percent and girls soccer (13,619) increased one percent after also falling from 2011-12 to 2012-13. Girls track and field (17,259) posted its second straight increase and highest participation total since 2009-10.
However, troubling trends continued in two of the most popular girls sports. Girls basketball participation fell for the eighth straight season to 16,329 participants, the sport’s fewest since records first were kept in 1991-92. The girls basketball total has decreased 14.7 percent since a U.S. District Court decision led to the switching of girls basketball season from fall to winter beginning in 2007-08. Comparatively, girls enrollment at MHSAA schools during that time has fallen 10.4 percent.
The sport that swapped seasons with girls basketball and moved to fall, volleyball, saw a 6.5-percent drop in participation this school year to 18,607 athletes, its fewest since 1993-94 and a decrease of 13.6 percent since its final season as a winter sport.
Also of note in this year’s survey:
- Total, nine sports saw increases in participation in 2013-14 (three boys, six girls), while 19 had decreases (11 boys, eight girls).
- Football participation, 11 and 8-player teams combined, dropped for the sixth straight season but this time by only 2 percent to 40,673 athletes. The drop from 2011-12 to 2012-13 was 3.7 percent.
- Wrestling saw a decrease for the fifth straight year, but also by a smaller percentage than the year before – 2.2 percent versus a 4.8-percent drop from 2011-12 to 2012-13.
- Baseball participation increased for the second straight year, up 0.7 percent to 18,227 participants. But softball saw the third-largest dip in 2013-14, 7.2 percent to 13,443 participants.
- Gymnastics (600) saw a decrease for the second straight year, this time by 11 percent – the largest percentage decrease of any sport this school year. Boys skiing (745) saw the second-largest drop, 9.7 percent.
The participation figures are gathered annually from MHSAA member schools to submit to the National Federation of State High School Associations for compiling of its national participation survey. Results of Michigan surveys from the 2000-01 school year to present may be viewed on the MHSAA Website.
The following chart shows participation figures for the 2013-14 school year from MHSAA member schools for sports in which the Association sponsors a postseason tournament:
BOYS GIRLS
SPORT |
SCHOOLS (A) |
PARTICIPANTS |
SCHOOLS (A) |
PARTICIPANTS (B) |
|
Baseball |
630/646/2 |
18,220 |
- |
-/7 |
|
Basketball |
727/732/2 |
21,504 |
676/723 |
16,321/8 |
|
Bowling |
341/359/1 |
3,573 |
326/357 |
2,939/7 |
|
Competitive Cheer |
- |
- |
311/337 |
7,120 |
|
Cross Country |
591/626/0 |
8,882 |
577/622 |
8,703/0 |
|
Football – 11 player |
596/660/3 |
39,963 |
- |
-/43 |
|
8-player |
36/39/0 |
667 |
- |
- |
|
Golf |
515/542/12 |
6,768 |
317/327 |
3,365/62 |
|
Gymnastics |
- |
- |
56/74 |
600 |
|
Ice Hockey |
219/268/2 |
3,564 |
- |
-/19 |
|
Lacrosse |
125/130/0 |
5,089 |
86/88 |
2,540/0 |
|
Skiing |
81/104/0 |
745 |
78/104 |
662/0 |
|
Soccer |
475/496/12 |
14,242 |
466/478 |
13,619/48 |
|
Softball |
- |
- |
569 |
13,443 |
|
Swimming & Diving |
242/266/1 |
5,243 |
260/274 |
6,064/8 |
|
Tennis |
312/318/2 |
6,464 |
338/347 |
8,856/6 |
|
Track & Field |
648/679/0 |
22,716 |
634/673 |
17,259/0 |
|
Volleyball |
- |
- |
662 |
18,607 |
|
Wrestling |