

Despite Overall Dip, 8 Sports Add Athletes
July 8, 2015
By Geoff Kimmerly
Second Half editor
Eight high school sports for which postseason tournaments are sponsored by the Michigan High School Athletic Association enjoyed gains in participation during the 2014-15 school year. However, total participation in MHSAA sports decreased slightly for the fourth straight school year, following a continuing trend of declining member school enrollments.
A total of 282,623 participants took part in the 28 tournament sports offered by the MHSAA during the past year – a 1.95-percent decrease from the 2013-14 figure of 288,230. However, enrollments at member schools also decreased 1.24 percent from 2013-14 and have fallen 11.1 percent since the 2006-07 school year – while MHSAA participation has fallen only 9.7 percent during that time. This year’s dip was only slightly larger than the 1.9-percent decrease from 2012-13 to 2013-14.
Overall boys participation fell 1.5 percent from 2013-14 to 2014-15, while girls participation fell 2.6 percent. The overall MHSAA totals count students once for each sport in which they participate, meaning students who are multiple-sport athletes are counted more than once.
Girls lacrosse was the only MHSAA sport to set a participation record during 2014-15, with 2,589 athletes (an increase of 1.9 percent) this spring, and has set a participation record every season since becoming a sponsored tournament sport in 2005. However, boys lacrosse, which also became tournament sponsored in 2005, saw its first decrease in participation, falling 2.6 percent to 4,958 athletes despite five schools adding programs to bring that total to 130.
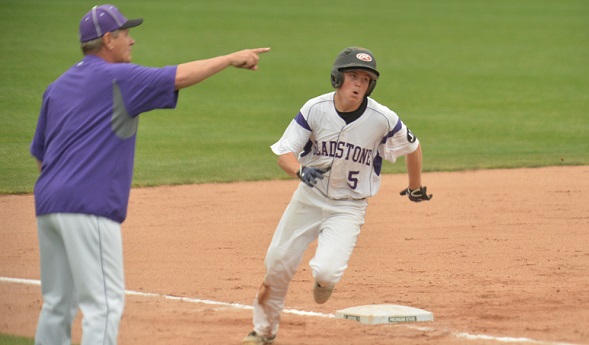
Baseball participation increased for the fourth straight school year, this season six tenths of a percent to 18,333 athletes. The other six sports that saw increased participation during 2014-15 all bounced back from decreases between 2012-13 and 2013-14. Boys bowling increased 4.2 percent to 3,724 athletes, its second-highest total as an MHSAA tournament sport. Both boys skiing (4.0 percent increase to 775 athletes) and girls skiing (1.4 percent to 671) also saw higher participation after two seasons of declines. Girls competitive cheer (1.0 percent to 7,189 athletes), girls gymnastics (3.0 percent to 618) and boys soccer (1.0 percent to 14,426) also saw bounce-back years after dips the school year before.
However, two of the most popular girls sports continued to experience downward trends. Girls basketball participation fell for the ninth straight season, to 15,702 athletes, the sport’s lowest total since records first were kept in 1991-92. The girls basketball total has decreased 18 percent since a U.S. District Court decision led to the switching of girls basketball season from fall to winter beginning in 2007-08. Comparatively, girls enrollment at MHSAA schools during that time has fallen 11.6 percent.
The sport that swapped seasons with girls basketball and moved to fall, volleyball, saw a 3.3-percent drop in participation this school year to 17,996 athletes, its fewest since 1991-92 and a decrease of 16.5 percent since its final season as a winter sport.
Also of note in this year’s survey:
- Total, eight sports saw increases in participation in 2014-15 (four boys, four girls), while 20 experienced decreases (10 boys, 10 girls).
- A recent drop in football participation, 11 and 8-player teams combined, has continued to slow, the total this season falling only 1.4 percent to 40,088 athletes. The drop from 2011-12 to 2012-13 was 3.7 percent, and the drop from 2012-13 to 2013-14 was two percent.
- Wrestling saw a decrease for the sixth straight year, this season to 9,475 participants, a 7.9-percent drop from 2013-14 with its lowest total since the collection of data began.
- Girls cross country, after five straight years of increases, fell back 4.1 percent, to 8,350 athletes, although that total still represented the third highest of the last seven seasons. The trend was identical for boys cross country, except this season’s total of 8,786 athletes was down only 1.1 percent from a year ago and the second-highest over the seven-season string.
- Swimming and diving saw the largest decrease among a pair of related sports; girls participation fell six percent to 4,938 athletes and boys fell 7.4 percent to 5,617 after both had experienced slight increases during the last three school years.
- Boys golf participation fell for the sixth straight season, to 6,533 athletes, its lowest since 1991-92.
The participation figures are gathered annually from MHSAA member schools to submit to the National Federation of State High School Associations for compiling of its national participation survey. Results of Michigan surveys from the 2000-01 school year to present may be viewed on the MHSAA Website – www.mhsaa.com – by clicking on Schools > Administrators > Sports Participation Listing.
The following chart shows participation figures for the 2014-15 school year from MHSAA member schools for sports in which the Association sponsors a postseason tournament:
BOYS GIRLS
SPORT |
SCHOOLS (A) |
PARTICIPANTS |
SCHOOLS (A) |
PARTICIPANTS (B) |
|
Baseball |
639/650/6 |
18,325 |
- |
-/8 |
|
Basketball |
726/733/5 |
21,401 |
665/726 |
15,702/14 |
|
Bowling |
355/371/9 |
3,711 |
339/366 |
2,970/13 |
|
Competitive Cheer |
- |
- |
335/348 |
7,189 |
|
Cross Country |
605/639/0 |
8,786 |
587/637 |
8,350/0 |
|
Football – 11 player |
597/621/59 |
39,338 |
- |
-/65 |
|
8-player |
33/38/0 |
685 |
- |
- |
|
Golf |
503/532/46 |
6,460 |
325/331 |
3,334/73 |
|
Gymnastics |
- |
- |
66/75 |
618 |
|
Ice Hockey |
232/269/11 |
3,448 |
- |
-/15 |
|
Lacrosse |
130/137/3 |
4,955 |
88/91 |
2,589/3 |
|
Skiing |
87/100/0 |
775 |
90/98 |
671/0 |
|
Soccer |
466/495/16 |
14,370 |
459/479 |
13,333/56 |
|
Softball |
- |
- |
570/635 |
13,113 |
|
Swimming & Diving |
233/264/3 |
4,935 |
256/275 |
5,617/3 |
|
Tennis |
299/316/6 |
6,294 |
335/345 |
8,628/11 |
|
Track & Field |
661/684/0 |
22,439 |
645/681 |
16,855/0 |
|
Volleyball |
Inglis Finds Next Home at MHSAA
By
Geoff Kimmerly
MHSAA.com senior editor
December 4, 2013
The theme chosen by Portage Northern’s student section for its hockey Regional Final in 1989 was “Kings of the Ice,” and as such they wore Burger King crowns as a sign of the royalty their classmates soon would earn.
Just before team captain Cody Inglis accepted the championship trophy, he skated to his friends and was anointed as well as one placed a crown upon his head.
Golden cardboard and all, Inglis received his team’s prize and circled the ice.
Inglis returned home that night eager to discuss the highlights with his dad Bill, a former professional player and one-time coach of the NHL’s Buffalo Sabres. But there was only one thing Bill had to say – and it’s a principle that’s continued to guide Cody throughout his career in high school athletics.
“I was really looking for his input and congratulations, and he looked at me and said very succinctly, ‘There’s a right way and a wrong way to do things. And you chose the wrong way,’” Inglis remembered this week. “At the time, I couldn’t see it with the perspective of a 17-year-old kid. But now I look back on it as the most valuable life lesson I’ve ever gotten.
“I knew he was proud of me. But the lesson he was trying to impart on me was doing things the right way is much more important than winning.”
Inglis has been doing things the right way for two decades while serving first at Suttons Bay and then Traverse City Central High School. He’ll bring a winning list of achievements and wealth of knowledge when he joins the Michigan High School Athletic Association staff as an assistant director in January.
Inglis, 42, has served as athletic director and assistant principal at Traverse City Central since February 2008, taking over after 11 years as athletic director at Suttons Bay. He also has served as secretary for both the Big North and Northwest Conferences and for 13 years as the northern Lower Peninsula representative of 125 athletic directors for the Michigan Interscholastic Athletic Administrators Association.
Inglis will serve as the MHSAA’s director of ice hockey, girls and boys cross country, girls and boys golf, and girls and boys bowling. In addition, he will assist in the direction of girls and boys skiing and girls and boys track and field, and be in charge of the junior high and middle school committee. Inglis also will assist with the administration of the MHSAA’s Coaches Advancement Program and provide his expertise as an instructor.
“We had more than 100 candidates, including a half dozen of the finest ADs in America – not just Michigan. They couldn’t be any better,” MHSAA Executive Director John E. “Jack” Roberts said. “Cody’s selection was based in part on his being just a slightly better fit to the job description we had in mind.
“He’s had to do some tough things as an administrator. But he’s got a personality that causes people to rally around him.”
On the move
Inglis’ dad, Bill, spent 50 years in pro hockey, most of his final 20 as general manager of the Kalamazoo K-Wings, and Cody grew up in lockerrooms around future pros like Ron Hextall, Dirk Graham and Marty Turco. When the Toledo Goaldiggers won the IHL’s Turner Cup when Cody was in sixth grade, he got to carry the cup through downtown. The family moved 17 times, and prior to the stop in Kalamazoo, Cody had never lived anywhere longer than 2½ years.
Inglis graduated from Portage Northern High School in 1989 and went on to Hope College, where he earned a bachelor’s degree in physical education and his teaching certification. He also was the captain of Hope’s 1992 men’s cross country team and captain of the men’s track & field team in both 1992 and 1993, and earned academic All-America honors for cross country.
Given his ties to pro hockey, Inglis might have had an opportunity to follow his dad. But it wasn’t for him. After graduating from Hope, Inglis enrolled at Western Michigan University to study sports management. He went to class for one day and withdrew – his heart just wasn’t into it.
 Instead, Inglis hooked up with his Portage Northern cross country coach Bill Fries and found what he did want to do – coach, and in doing so, teach athletics.
The rest is northern Lower Peninsula history.
Inglis hooked on at Suttons Bay as a 23-year physical education teacher and head cross country and track & field coach, and two years later took over the athletic department.
“I was thrown into the fire right away, but I had a desire to be in sports somehow and coaching was a passion of mine,” Inglis said. “It was kinda sink or swim. I realized the craziness and hecticness of it, but it was something I embraced. I was lucky to have the opportunity to do it at Suttons Bay, to grow there and have people who were willing to let me make some mistakes, learn from my mistakes and become a better administrator.”
Inglis has supervised a group of more than 100 coaches while at Traverse City Central, plus a group of more than 20 teachers and staff as part of his assistant principal duties.
He’s managed more than 100 MHSAA Tournaments, including Ski Finals, Football Semifinals and Hockey Quarterfinals, and a variety of lower tournament levels for hockey, wrestling, track and field, cross country, basketball and golf.
His programs have achieved plentiful success under his leadership. Traverse City Central won the Big North Conference all-sport award every year from 2008-12 and earned six MHSAA Finals team championships during his tenure. The varsity programs have produced 34 academic all-state awards over the past three school years – including 14 in 2012-13 – and 62 percent of the student body was involved in athletics last school year.
While at Suttons Bay, Inglis led an athletic program that won the Northwest Conference sportsmanship trophy nine times and earned two MHSAA Finals championships. He also redeveloped athletic boosters programs, oversaw construction projects and was instrumental in the rewriting of athletic policies at both schools.
He was recognized in the spring with the MHSAA’s Allen W. Bush Award, which recognizes those who serve in high school athletics but do not always receive attention for their contributions.
Mentor to follow
Inglis was instrumental in the creation and later served as an assistant coach for the Traverse City Bay Reps ice hockey team, a co-operative headed by Traverse City St. Francis High School that’s now been in existence 15 seasons. He also was named Division 4 Girls Cross Country Coach of the Year in 2002 by the Michigan Interscholastic Track Coaches Association after leading his team to a runner-up finish at the MHSAA Finals.
Inglis coached a string of girls cross country teams that made the top 10 at MHSAA Finals five straight seasons, plus 25 all-state athletes in cross country and track and field including three individual MHSAA champions.
He has been a member of seven MHSAA sport committees, including for ice hockey. He’s been a frequent presenter at the MIAAA’s annual conferences, covering topics including fundraising, budgeting, organizing successful tournaments, balancing multiple roles and responsibilities, leadership and technology. He’s also taught MIAAA Leadership Training Courses.
Of little surprise, Inglis has been greatly impacted by growing up following his dad. While mother Jeris was the rock of the family, Bill was Cody’s idol and made a significant impact on the manager Inglis has become.
“My dad was so good at the way he treated people. I just saw how he treated them, whether it was the Zamboni drive or an assistant or secretary, he treated them with so much respect,” Inglis said. “That’s the part I’ve really taken from him, how he treated people and the relationships he made. How you treat people in athletics is so key; they’ll treat you the same way back, I’ve found most of the time.”
Inglis received minor degrees at Hope in business administration and communications, and has completed a number of courses toward a master’s in athletic administration from Ohio University.
He is married to Carrie (Ham) Inglis, an MHSAA Finals cross country individual champion for Big Rapids in 1987. They have three sons.
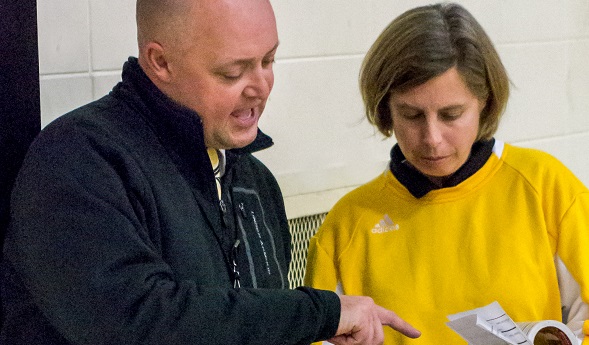
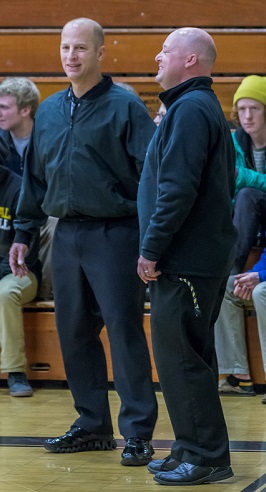
PHOTO: (Top) Traverse City Central athletic director Cody Inglis converses with a member of his staff Tuesday. (Middle) Inglis shares a laugh with an official before Tuesday's girls basketball games. (Photos courtesy of Rick Sack.)