

Despite Overall Dip, 8 Sports Add Athletes
July 8, 2015
By Geoff Kimmerly
Second Half editor
Eight high school sports for which postseason tournaments are sponsored by the Michigan High School Athletic Association enjoyed gains in participation during the 2014-15 school year. However, total participation in MHSAA sports decreased slightly for the fourth straight school year, following a continuing trend of declining member school enrollments.
A total of 282,623 participants took part in the 28 tournament sports offered by the MHSAA during the past year – a 1.95-percent decrease from the 2013-14 figure of 288,230. However, enrollments at member schools also decreased 1.24 percent from 2013-14 and have fallen 11.1 percent since the 2006-07 school year – while MHSAA participation has fallen only 9.7 percent during that time. This year’s dip was only slightly larger than the 1.9-percent decrease from 2012-13 to 2013-14.
Overall boys participation fell 1.5 percent from 2013-14 to 2014-15, while girls participation fell 2.6 percent. The overall MHSAA totals count students once for each sport in which they participate, meaning students who are multiple-sport athletes are counted more than once.
Girls lacrosse was the only MHSAA sport to set a participation record during 2014-15, with 2,589 athletes (an increase of 1.9 percent) this spring, and has set a participation record every season since becoming a sponsored tournament sport in 2005. However, boys lacrosse, which also became tournament sponsored in 2005, saw its first decrease in participation, falling 2.6 percent to 4,958 athletes despite five schools adding programs to bring that total to 130.
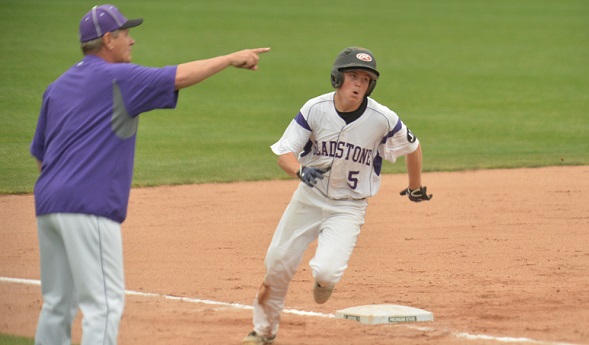
Baseball participation increased for the fourth straight school year, this season six tenths of a percent to 18,333 athletes. The other six sports that saw increased participation during 2014-15 all bounced back from decreases between 2012-13 and 2013-14. Boys bowling increased 4.2 percent to 3,724 athletes, its second-highest total as an MHSAA tournament sport. Both boys skiing (4.0 percent increase to 775 athletes) and girls skiing (1.4 percent to 671) also saw higher participation after two seasons of declines. Girls competitive cheer (1.0 percent to 7,189 athletes), girls gymnastics (3.0 percent to 618) and boys soccer (1.0 percent to 14,426) also saw bounce-back years after dips the school year before.
However, two of the most popular girls sports continued to experience downward trends. Girls basketball participation fell for the ninth straight season, to 15,702 athletes, the sport’s lowest total since records first were kept in 1991-92. The girls basketball total has decreased 18 percent since a U.S. District Court decision led to the switching of girls basketball season from fall to winter beginning in 2007-08. Comparatively, girls enrollment at MHSAA schools during that time has fallen 11.6 percent.
The sport that swapped seasons with girls basketball and moved to fall, volleyball, saw a 3.3-percent drop in participation this school year to 17,996 athletes, its fewest since 1991-92 and a decrease of 16.5 percent since its final season as a winter sport.
Also of note in this year’s survey:
- Total, eight sports saw increases in participation in 2014-15 (four boys, four girls), while 20 experienced decreases (10 boys, 10 girls).
- A recent drop in football participation, 11 and 8-player teams combined, has continued to slow, the total this season falling only 1.4 percent to 40,088 athletes. The drop from 2011-12 to 2012-13 was 3.7 percent, and the drop from 2012-13 to 2013-14 was two percent.
- Wrestling saw a decrease for the sixth straight year, this season to 9,475 participants, a 7.9-percent drop from 2013-14 with its lowest total since the collection of data began.
- Girls cross country, after five straight years of increases, fell back 4.1 percent, to 8,350 athletes, although that total still represented the third highest of the last seven seasons. The trend was identical for boys cross country, except this season’s total of 8,786 athletes was down only 1.1 percent from a year ago and the second-highest over the seven-season string.
- Swimming and diving saw the largest decrease among a pair of related sports; girls participation fell six percent to 4,938 athletes and boys fell 7.4 percent to 5,617 after both had experienced slight increases during the last three school years.
- Boys golf participation fell for the sixth straight season, to 6,533 athletes, its lowest since 1991-92.
The participation figures are gathered annually from MHSAA member schools to submit to the National Federation of State High School Associations for compiling of its national participation survey. Results of Michigan surveys from the 2000-01 school year to present may be viewed on the MHSAA Website – www.mhsaa.com – by clicking on Schools > Administrators > Sports Participation Listing.
The following chart shows participation figures for the 2014-15 school year from MHSAA member schools for sports in which the Association sponsors a postseason tournament:
BOYS GIRLS
SPORT |
SCHOOLS (A) |
PARTICIPANTS |
SCHOOLS (A) |
PARTICIPANTS (B) |
|
Baseball |
639/650/6 |
18,325 |
- |
-/8 |
|
Basketball |
726/733/5 |
21,401 |
665/726 |
15,702/14 |
|
Bowling |
355/371/9 |
3,711 |
339/366 |
2,970/13 |
|
Competitive Cheer |
- |
- |
335/348 |
7,189 |
|
Cross Country |
605/639/0 |
8,786 |
587/637 |
8,350/0 |
|
Football – 11 player |
597/621/59 |
39,338 |
- |
-/65 |
|
8-player |
33/38/0 |
685 |
- |
- |
|
Golf |
503/532/46 |
6,460 |
325/331 |
3,334/73 |
|
Gymnastics |
- |
- |
66/75 |
618 |
|
Ice Hockey |
232/269/11 |
3,448 |
- |
-/15 |
|
Lacrosse |
130/137/3 |
4,955 |
88/91 |
2,589/3 |
|
Skiing |
87/100/0 |
775 |
90/98 |
671/0 |
|
Soccer |
466/495/16 |
14,370 |
459/479 |
13,333/56 |
|
Softball |
- |
- |
570/635 |
13,113 |
|
Swimming & Diving |
233/264/3 |
4,935 |
256/275 |
5,617/3 |
|
Tennis |
299/316/6 |
6,294 |
335/345 |
8,628/11 |
|
Track & Field |
661/684/0 |
22,439 |
645/681 |
16,855/0 |
|
Volleyball |
Rep Council Wrap-up: Fall 2012
December 7, 2012
A change in format for the Boys Basketball Finals highlighted actions taken by the Representative Council of the Michigan High School Athletic Association during its annual Fall Meeting, Nov. 30 in East Lansing.
Mirroring closely the format of the MHSAA Girls Basketball Finals, the Boys Finals will move this season from three to two sessions. The first session will tip off with the Class D Final at 10 a.m., followed by the Class A championship game. The second session will begin tentatively at 4:30 p.m. with the Class C Final and conclude with the Class B title game.
Previously, the Class A and B Finals were separate sessions, with the Class A Final tipping at 4 p.m. and Class B at 8 p.m. The change will make for a shorter day for spectators wishing to attend all four games, and also allow them to do so by purchasing tickets for two sessions instead of three.
 The Fall Meeting also saw the addition of two members to the 19-person council. Reese Public Schools athletic director Dave Derocher began a two-year term after being elected earlier this fall to represent Class C and D schools in the northern Lower Peninsula. Orlando Medina, who serves as athletic coordinator for Harrison Township L’Anse Creuse Public Schools, was appointed for a two-year term. He also previously served as athletic director at Detroit Cesar Chavez Academy. They fill positions formerly held by Beal City superintendent William Chilman IV and Romulus High School athletic director Mark Woodson, whose terms ended.
Also, Carmen Kennedy, principal at St. Clair Shores South Lake High School, was reappointed for a second two-year term. The Representative Council is the legislative body of the MHSAA. All but five members are elected by member schools. Four members are appointed by the Council to facilitate representation of females and minorities, and the 19th position is occupied by the Superintendent of Public Instruction or designee.
The most prominent points discussed at the Fall Meeting were risk minimization for athletes and possible strategies for making school sports safer. Among topics discussed were raising expectations for coaches’ participation in online safety courses and schools’ management of heat illness; the possible restructuring of practice policies in regards to hot weather; and game rules revisions to enhance safety especially in football, soccer and ice hockey.
The Council reviewed its previous actions on those topics, including discussions in December 2011 that led to the inclusion of health and safety content in online rules meetings. Council members considered a model policy for managing heat and humidity, and also a number of ideas collected during Fall Update meetings with administrators throughout the state.
No action was requested on those items at the Fall Meeting. Complete and vetted proposals are likely to be considered when the Council next meets in March and then May.
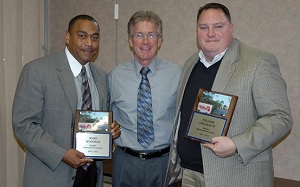
PHOTO: Outgoing Representative Council members Mark Woodson of Romulus (left) and William Chilman IV (right) are presented plaques for their service by MHSAA Executive Director Jack Roberts (middle) during the Fall Meeting.