
Hoopfest returns Thursday to Jenison
March 21, 2012
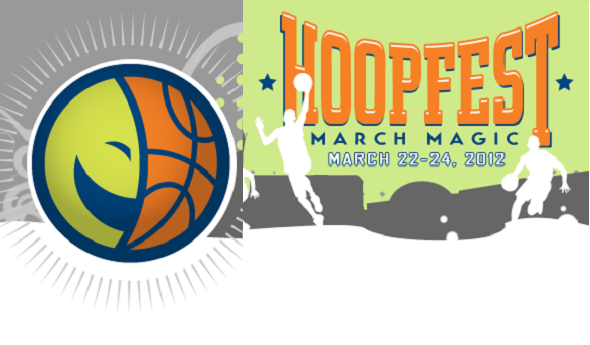
March Magic Hoopfest will return to Jenison Field House for this weekend’s Michigan High School Athletic Association Boys Basketball Finals, marking the fourth year the event has run concurrent with the games being played at Michigan State’s Breslin Center.
A number of favorite attractions will return this weekend, including slam dunk (on lowered rims), 3-point shootout and rainbow shot areas where fans can come at any time and participate. Also returning is the Hall of History, showcasing championship games, life-size photos and display boards from throughout the MHSAA Finals’ near century-long run.
A large video screen will play a series of “Buzzer Beaters,” “Battle of the Fans” and other MHSAA-produced videos. Also, teams of boys and girls in grades 5-8 will play in the “JumpBall Jamboree” on two center courts.
Admission to the March Magic Hoopfest is $2 per person, and fans attending the MHSAA Boys Basketball Semifinals and Finals will be admitted free with their game tickets. Hours on March 22 and 23 will be 2 p.m. to 7 p.m.; the event is open from 10 a.m. to 7 p.m. on March 24. More than 12,000 fans attended the 2011 event. Jenison Field House, site of the Hoopfest, also was the site of the MHSAA Boys Basketball Finals for 31 years.
The March Magic Hoopfest is being conducted in a partnership between the Greater Lansing Sports Authority, a division of the Greater Lansing Convention and Visitors Bureau; and the MHSAA, with vital support coming from the Department of Intercollegiate Athletics at Michigan State University. To find out more general information about the event, visit the March Magic Hoopfest Website at http://www.marchmagichoopfest.com.
“March Magic Hoopfest is a great partnership between the Greater Lansing Sports Authority, Michigan State and the MHSAA,” MHSAA Director of Brand Management Andy Frushour said. “The event gives fans at the Finals an opportunity to extend their championship weekend experience, and provides those who do not attend the Finals a small taste of the excitement.”
The Greater Lansing Sports Authority (GLSA) is a division of the Greater Lansing Convention and Visitors Bureau. The GLSA’s mission is to be the leading voice of sports tourism in the Greater Lansing area and to promote economic growth by attracting a diverse range of sporting events to the region. The GLSA strives to enhance the quality of life for area residents through the development of local sports and fitness programs for all ages, and supports the continued development and maintenance of safe, high-quality athletic facilities.
"The March Magic Hoopfest sets off a great weekend of MHSAA tournament games and helps create a multi-day event which will involve the Lansing area and thousands of visitors coming to town," said Mike Price of the Greater Lansing Sports Authority. "If you're coming to the championships, Hoopfest is a destination to visit before and after the games; and if you're not coming to the games, Hoopfest is a fun, wholesome, inexpensive, family activity."

Rep Council Wrap-Up: Winter 2016
March 31, 2016
By Geoff Kimmerly
Second Half editor
An increased effort to ensure student-athletes and their parents or guardians receive concussion education information was among topics that generated the most attention from the Representative Council of the Michigan High School Athletic Association during its annual Winter Meeting on March 24 in East Lansing.
Most of the Council’s discussion pointed toward possible actions at its Spring Meeting in May, with possible additions to the MHSAA Physical Exam/Clearance/Consent forms among those that may be voted upon when the Council reconvenes. The Council did take a first step, approving a requirement at its Winter Meeting mandating all students and their parent/guardian to sign a post-concussion consent form signifying they have received information on potential risks prior to returning to activity following a concussion.
Continuing its emphasis on the importance of collecting in-depth student-athlete health histories, the Council approved PRIVIT on a two-year trial basis as an electronic-based health history record-keeping tool to serve as an alternative to written communications and forms that accompany pre-participation physical examination of athletes.
The Council also discussed for possible action in May standardizing MHSAA rules/risk management meeting content for assistant and subvarsity coaches and increasing the frequency of in-depth concussion information within those meetings while still giving adequate attention to a variety of other important health and safety topics, including heat illness, sudden cardiac arrest and overuse injuries.
In other ongoing business, the Council reviewed necessary modifications to the MHSAA Membership Resolution and Handbook in advance of a change to the MHSAA Constitution that will permit schools to join the MHSAA at the 6th-grade level beginning in 2016-17. The amendment will allow schools which join the MHSAA at the 6th-grade level to let 6th-graders participate with MHSAA services and support and with and against 7th- and 8th-graders without MHSAA Executive Committee approval. It allows all districts, but requires no districts, to provide athletic opportunities for 6th-graders under the auspices of the MHSAA, either on separate teams or with 7th-and 8th-graders.
The Council considered one sport matter, in track & field, voting to begin this 2016 season to eliminate one preliminary round of the boys 110-meter hurdles, girls 100-meter hurdles and boys and girls 100 and 200-meter dashes at all Lower Peninsula Regionals that use fully automatic time (FAT) to determine race results. The Council also voted to require all Lower Peninsula Regional sites to use FAT beginning in 2017. Both actions were recommended by the MHSAA Cross Country/Track & Field Committee.
The Council also approved an Officials Review Committee recommendation to require all new officials to complete the National Federation of State High School Associations (NFHS) online course “Interscholastic Officiating” in addition to current requirements to complete the MHSAA Officials Guidebook exam and mechanics exams for new officials seeking to work football and basketball games.
The Representative Council is the legislative body of the MHSAA. All but five members are elected by member schools. Four members are appointed by the Council to facilitate representation of females and minorities, and the 19th position is occupied by the Superintendent of Public Instruction or designee.
The MHSAA is a private, not-for-profit corporation of voluntary membership by more than 1,400 public and private senior high schools and junior high/middle schools which exists to develop common rules for athletic eligibility and competition. No government funds or tax dollars support the MHSAA, which was the first such association nationally to not accept membership dues or tournament entry fees from schools. Member schools which enforce these rules are permitted to participate in MHSAA tournaments, which attract more than 1.4 million spectators each year.