
March Magic Hoopfest Returns to MSU
March 17, 2014
By Geoff Kimmerly
Special to Second Half
March Magic Hoopfest will return to Jenison Field House for this weekend’s Michigan High School Athletic Association Boys Basketball Finals, marking the fifth championship weekend the event has run concurrent with the games being played at Michigan State University’s Breslin Center.
A number of favorite attractions will return including slam dunk (on lowered rims), 3-point shootout and full-court rainbow shot areas where fans can come at any time and participate. Also returning is the Walk of History, showcasing championship games, life-size photos and display boards from throughout the MHSAA Finals’ near century-long run. A large video screen will play a series of “Buzzer Beaters,” “Battle of the Fans” and other MHSAA-produced videos.
Two Hoopfest center courts will host a number of games throughout the event, including the “JumpBall Jamboree” made up of teams of boys and girls in grades 5-8, a wheelchair basketball tournament and a series between four Special Olympics Project UNIFY high school teams.
Admission to the March Magic Hoopfest is $2 per person, and fans attending the MHSAA Boys Basketball Semifinals and Finals will be admitted free with their game tickets. Hours on March 20 and 21 will be 2 p.m. to 7 p.m.; the event is open from 10 a.m. to 7 p.m. on March 22. Jenison Field House, site of Hoopfest, also was the site of the MHSAA Boys Basketball Finals for 31 years. To find out more general information about the event, visit the March Magic Hoopfest Website.
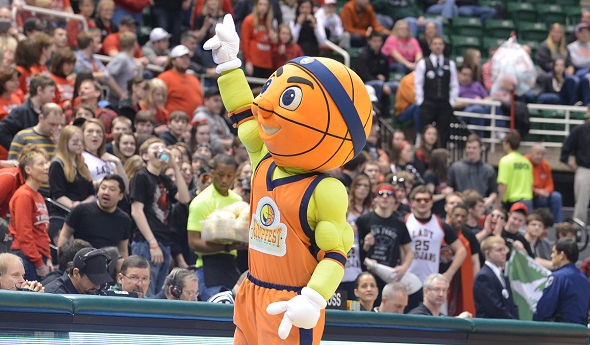
Hoopfest also will be home to Hoopie, the event’s mascot who made his first public appearances during the MHSAA Girls Basketball Finals. Click for video of Hoopfest’s newest volunteer as he helped prepare for this weekend’s event:
The March Magic Hoopfest is being conducted in a partnership between the Greater Lansing Sports Authority (GLSA), a division of the Greater Lansing Convention and Visitors Bureau; and the MHSAA, with vital support coming from the Department of Intercollegiate Athletics at Michigan State University.
“March Magic Hoopfest is a giant playground. There are opportunities for fun all over Jenison – and it’s a great way to spend an hour while waiting for the next round of games to start,” MHSAA Director of Brand Management Andy Frushour said. “All of us can remember reenacting games of our high school heroes. What better place to let kids do so now than across the street from Breslin Center in one of the most storied buildings in this state’s basketball history.”
The Greater Lansing Sports Authority’s mission is to be the leading voice of sports tourism in the Greater Lansing area and to promote economic growth by attracting a diverse range of sporting events to the region. The GLSA strives to enhance the quality of life for area residents through the development of local sports and fitness programs for all ages and supports the continued development and maintenance of safe, high-quality athletic facilities.
Hoopfest was not held at the 2013 Finals due to a Big Ten championship event being hosted by Jenison Field House.
"The GLSA is excited to partner with the MHSAA on the re-launch of March Magic Hoopfest," said Mike Price of the Greater Lansing Sports Authority. "While Hoopfest was absent in 2013, planning and improvement were ongoing. We are excited to showcase an improved Hoopfest that includes new games and activities, as well as the launch of our new mascot, Hoopie!”
PHOTO: Hoopie made his first public appearance during the weekend's MHSAA Girls Basketball Finals at the Breslin Center.

Vermontville Star Named to NFHS Hall
By
Geoff Kimmerly
MHSAA.com senior editor
March 1, 2016
Record-setting Vermontville High School baseball star Ken Beardslee, who continues to hold two national strikeout records more than 65 years after his final high school pitch, was one of 12 individuals named Tuesday to the National High School Sports Hall of Fame by the National Federation of State High School Associations (NFHS).
 Beardslee, who died in 2007, will be inducted as one of five athletes selected for the 34th Hall of Fame class at a ceremony during the NFHS summer meeting July 2 in Reno, Nev.; the rest of the class is made up of coaches, administrators and an official. He was nominated through the Michigan High School Athletic Association.
Beardslee has been proclaimed as “prep baseball’s first ace” in the NFHS National High School Sports Record Book and was featured in the former print version of the book for his incredible feats from 1947-49. In his three years on the mound for Vermontville, Beardslee won 24 of his 25 starts (the team was 31-1 during that time). His 24 victories included eight no-hitters, with two perfect games, and seven one-hitters.
He set seven national records, and two still stand after 66 years: his per-game season strikeout mark of 19.0 and his per-game career strikeout mark of 18.1.
Beardslee will become the Hall of Fame’s eighth inductee from Michigan, joining Charles Forsythe, the first executive director of the Michigan High School Athletic Association (inducted 1983); River Rouge boys basketball coach Lofton Greene (1986), Warren Regina softball coach Diane Laffey (2000), Fennville basketball, football, track and baseball standout Richie Jordan (2001), Grosse Pointe Woods University Liggett boys and girls tennis coach Bob Wood (2005), Bloomfield Hills Cranbrook hockey standout Jim Johnson (2007) and Owosso football, basketball and baseball all-stater Brad Van Pelt (2011).
“It’s been said that records are made to be broken,” wrote MHSAA Executive Director John E. “Jack” Roberts in his letter supporting Beardslee’s nomination. “But the strikeout numbers Ken Beardslee recorded in the late 1940s have stood the test of time, just like some of the shutout and strikeout numbers 2009 Hall of Fame honoree David Clyde amassed some 20 years later. But Clyde never came close to Beardslee’s 19.0 Ks per game in a season or 18.1 per game for a career, and neither has anyone else.”
Beardslee is listed 10 times in the MHSAA record book. He shares the record for career no-hitters and is second with two career perfect games and a 0.32 career earned run average. In addition to his two national strikeout records still standing, he’s listed in the MHSAA records with games of 26, 25 (both extra innings) and 20 strikeouts (in seven innings) during the 1949 season. His 209 strikeouts that spring rank fourth for one season in MHSAA history, and his 452 over three seasons rank 12th on the career strikeouts list.
Beardslee was drafted by the New York Yankees immediately after graduating from high school and pitched in the minor leagues from 1949 to 1956, when an injury ended his playing career. Beardslee went on to scout for the Pittsburgh Pirates for 21 years, and he received a World Series ring after the team’s championship win in 1971. He also went on to write eight books including novels, poetry and an instructional on pitching.
He is survived by his wife Marilene, who is expected to attend the ceremony this summer to accept his honor.
The National High School Hall of Fame was started in 1982 by the NFHS. This year’s class increases the number of individuals in the Hall of Fame to 447.
The 12 individuals were chosen after a two-level selection process involving a screening committee composed of active high school state association administrators, coaches and officials, and a final selection committee composed of coaches, former athletes, state association officials, media representatives and educational leaders. Nominations were made through NFHS member associations. Also chosen for this class were athletes Steve Spurrier (Tennessee), Marlin Briscoe (Nebraska), Joni Huntley (Oregon) and Tom Southall (Colorado); coaches Chuck Kyle (Ohio), Peg Kopec (Illinois), Pete Boudreaux (Louisiana) and Jack Holloway (Delaware); administrators Tim Flannery (NFHS) and Ennis Proctor (Mississippi), and official Eugene “Lefty” Wright (Minnesota).
For more on this year’s Hall of Fame class, visit the NFHS Website. For more on Michigan’s past inductees, visit the MHSAA Website.