

MHSAA Attendance Posts 5-Year High
October 6, 2016
By Geoff Kimmerly
Second Half editor
Michigan High School Athletic Association postseason events enjoyed a five-year high in attendance in 2015-16 as two sports saw record fan turnout.
Total attendance for 2015-16 was 1,483,724 fans, an increase of 6.8 percent over the previous year. Girls attendance was 461,419, less than a percent lower than the record set in 2014-15 but still the second largest overall girls turnout since data was first tracked in 1990-91. Boys attendance was 1,022,305 fans, a four-year high helped notably by an increased football crowd last fall. Attendance is kept for all sports except golf, skiing and tennis, for which admission typically is not charged.
The track & field and bowling tournaments, which include attendance for girls and boys events combined, set overall records. Track & field broke a 2011-12 record with 37,773 fans overall and a Regional record of 22,413, and bowling set an overall attendance record for the fifth straight season with 13,919 fans and a Regional record of 9,948.
Football attendance did rebound significantly after a snowy opening weekend in 2014 resulted in the lowest playoff attendance since the 256-team 11-player field was introduced in 1999. Overall football attendance jumped to a three-year high of 389,897, a 25.4 percent increase from the 2014 postseason and with increases seen at the Pre-District, District and Regional levels.
Ten more tournament series showed increases in total attendance over the 2014-15 school year: gymnastics (2.0 percent), softball (2.8 percent), baseball (0.5 percent), girls swimming & diving (12.7 percent), boys swimming & diving (14.6 percent), boys basketball (1.5 percent), girls and boys cross country (combined, 2.1 percent), boys soccer (2.4 percent), team wrestling and individual wrestling all saw increases in overall attendance from the previous school year. Volleyball fell just shy of equaling the previous year’s record, drawing 110,638 fans, a decrease of 293 from the 2014 season but still the second-most since records first were kept in 1990-91. Volleyball did, however, set attendance records at the Regional (26,445) and Semifinal (4,765) levels of the tournament.
Also of note:
• The Boys Basketball Finals draw of 47,407 was a five-year high and a 16.9 percent increase from 2014-15. The Girls Basketball Finals drew 22,301 fans, the most for a Semifinals/Finals weekend since 2004-05 and an increase of 12 percent over 2014-15. Girls basketball’s overall tournament attendance of 169,523 was a decrease of 1.2 percent from 2014-15, but still the second-highest attendance for the sport since 2005-06.
• Overall softball attendance increased for the third straight year to 44,515, the highest total since the record-setting spring of 1994-95.
• Boys Soccer Finals drew 4,906 fans, the most for that event since 2007-08.
• Coming off a record high in 2013-14 and then a sharp decrease the following year, the Ice Hockey Finals rebounded with 10,709 fans, a 7.9 percent increase from the winter before.
The MHSAA is a private, not-for-profit corporation of voluntary membership by more than 1,400 public and private senior high schools and junior high/middle schools which exists to develop common rules for athletic eligibility and competition. No government funds or tax dollars support the MHSAA, which was the first such association nationally to not accept membership dues or tournament entry fees from schools. Member schools which enforce these rules are permitted to participate in MHSAA tournaments, which attract more than 1.4 million spectators each year.
'Check-in Champ' Back with More Prizes
August 30, 2017
By Geoff Kimmerly
Second Half editor
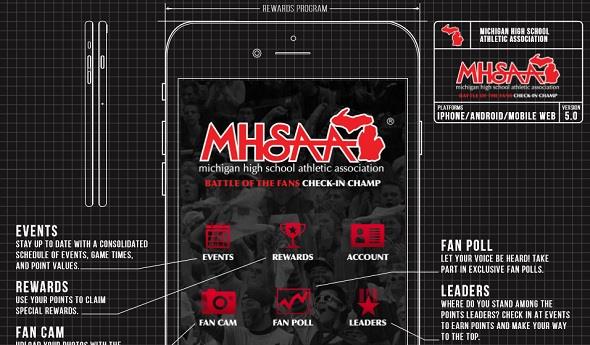
The Michigan High School Athletic Association and SuperFanHigh have again launched the "Check-in Champ" app to allow students, faculty, alumni, community members and all fans to earn prizes and college scholarships by showing support for high school football teams.
And there’s plenty of time to catch up and win season and weekly awards as the season moves into its second weekend.
To participate, fans simply need to download the “Check-in Champ” app for free from Apple iTunes by searching “MHSAA” or by searching “BOTF” on the Google Play online store and then check in at high school football games they are attending this season. SuperFanHigh will track these check-ins and provide standings of fans who attend the most events statewide. Fans “checking in” accrue points toward prizes including a total of $4,000 in college scholarships powered by MI Student Aid.
For the remainder of this Michigan high school football season, fans who attend games will earn points. When registering on the app, fans must select their favorite school. Schools will be divided by Class: A, B, C and D. A $2,000 scholarship will be awarded to the fan who earns the most points overall across all four classes, and $500 scholarships will be awarded to fans who earn the most points in each class.
Only student fans will be eligible to use the college scholarships; however, fans who are not students may still compete for the scholarships and designate them for specific students should they win the contest. All fans, including those who are not students, will be able to earn app “badges” as they accrue points, and each week those who check into games will be registered into a drawing for a $50 gift card.
The app provides other information for students and fans including their selected schools’ football team schedules, MHSAA news and an opportunity to share photos through a ‘fan cam.’ Participants may accrue bonus points by answering MHSAA football trivia questions and promoting their “check-ins” on social media.
SuperFanHigh is a division of its parent company, SuperFanU and provides fan experiences for more than 300 high schools and colleges/universities across the country. The company is leading the market in developing innovative platforms that allow the communication and marketing between students/fans and schools to be more engaging and efficient.