

MHSAA Attendance Posts 6-Year High
September 21, 2017
By Geoff Kimmerly
Second Half editor
MHSAA tournament events posted an increase in attendance for the second straight school year in 2016-17, drawing 1,492,469 fans – with eight boys sports enjoying larger audiences that the previous year.
Total attendance rose sixth-tenths (0.6) of a percent from 2015-16 to its highest total since 2010-11. Boys attendance rose to 1,034,625 (or 1.2 percent) to its highest total since 2011-12. Girls attendance was 457,844, continuing a trend that has seen the last three school years post the largest audiences for girls tournament events since the MHSAA began annually tracking data in 1990-91. Attendance is kept for all sports except golf, skiing and tennis, for which admission typically is not charged.
The second straight boys increase was keyed in part by a pair of records. Baseball drew 50,820 fans, breaking the previous record set during the 2009 season while also seeing a record turnout at the District level. Boys lacrosse, with 11,211 total attendance, broke the previous record set in 2010.
The boys basketball tournament, with 330,588 fans, enjoyed its highest turnout since 2010-11. Football attendance rose for the second straight year with 395,894 fans total, enjoying single-round increases at the Pre-District, District and Regional levels. Ice hockey, with 51,812 fans, also saw an increase from 2015-16, as did the boys swimming & diving tournament with 5,694 fans – its highest overall attendance since 2010-11.
Three more records contributed to the overall increase in 2016-17. Softball drew 47,364 fans total, breaking the previous record set in 1994-95. The bowling and cross country tournaments, which both include girls and boys competing at the same sites, both set records as well – bowling with 14,012 fans overall to set a record for the second straight year, and cross country with 20,671 fans, its most since 2011-12.
Two more girls sports also enjoyed increased attendance from 2015-16. The girls lacrosse tournament drew 5,691 fans, a 29 percent increase from the year before and with a record at the Regional level. Girls soccer drew 28,203 fans with increases at the District, Regional and Semifinal levels; the overall attendance was a 3.9 percent increase and the highest since the record 2006-07 season.
Also of note:
• Although girls basketball overall attendance was down half a percent to 168,674, both the Quarterfinals and Semifinal-Finals rounds saw increases from the previous season. The Semifinal-Finals weekend drew 24,120 fans, the most since the record was set for those rounds combined during the 1996 fall season (girls basketball moved from fall to winter beginning with the 2007-08 season.
• The boys basketball attendance increase was bolstered in part by the highest Semifinal-Finals weekend attendance (53,990) since 2008-09 and an increase that weekend of 14 percent from 2015-16.
• Boys Soccer Districts were watched by 15,048 fans, the most since 2008-09, and individual wrestling also enjoyed a bounce-back at its earliest rounds with a three-year high at the District level (10,792 fans) and a six-year high (8,488) at the Regional level.
• Girls gymnastics Regionals (1,146) drew their largest audience since 2002-03, while competitive cheer Regionals (7,333) enjoyed a nine-year high.
The MHSAA is a private, not-for-profit corporation of voluntary membership by more than 1,500 public and private senior high schools and junior high/middle schools which exists to develop common rules for athletic eligibility and competition. No government funds or tax dollars support the MHSAA, which was the first such association nationally to not accept membership dues or tournament entry fees from schools. Member schools which enforce these rules are permitted to participate in MHSAA tournaments, which attract more than 1.4 million spectators each year.
Scholars and Athletes 2013: Class A
By
Geoff Kimmerly
MHSAA.com senior editor
February 19, 2013
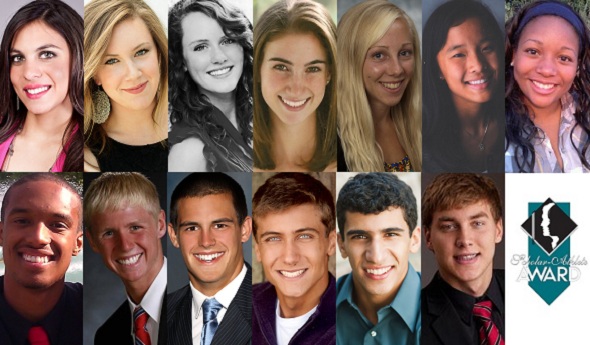
The Michigan High School Athletic Association has selected 13 student-athletes from Class A member schools to receive scholarships through its Scholar-Athlete Award program.
Farm Bureau Insurance, in its 24th year of sponsoring the award, will give a $1,000 college scholarship to 32 individuals who represent their member school in at least one sport in which the Association sponsors a postseason tournament. The first 30 scholarships are awarded proportionately by school classification and the number of student-athletes involved in those classes; also, there are two at-large honorees which can come from any classification. Of Class A honorees, seven are girls and six are boys – with the seventh girl an at-large selection.
Each scholarship recipient will be honored during a halftime ceremony at the Class C Boys Basketball Final game March 23 at the Breslin Student Events Center in East Lansing. Commemorative medallions will be given to other finalists in recognition of their accomplishments.
The Class A Scholar-Athlete Award honorees are: Lara Fawaz, Dearborn; Kayla Giese, Macomb Dakota; Kristin Nicole Green, Saline; Kelly Hall, Saline; Brooke Kovacic, Oxford; Teresa LaForest, St. Joseph; Reinie Thomas, Portage Central; Marcus Barnett, St. Clair Shores Lake Shore; Connor James Bos, Holland; Bryan Condra, Hartland; Kalvis Hornburg, Traverse City Central; Jeremy Simon, Richland Gull Lake; and Adam Whitener, Saline.
Overviews of the scholarship recipients of the Class A Scholar-Athlete Award follow. A quote from each recipient's essay also is included:
Lara Fawaz, Dearborn. Four-year letterwinner in Basketball and Tennis, served at team captain and captured all-league and academic all-league honors in both sports. Has played doubles on Dearborn tennis team which has qualified for MHSAA Finals the past three years. Four-year participant in Key Club, Arabic Club and Sadr Foundation USA. Has served as student government vice president for two years, and as an officer for National Honor Society and Arabic Club. Helped launch a book drive for Oakwood Center for Exception Families, which garnered over 500 books. Has also been a tutor. Plans neuroscience studies at the University of Michigan.
Essay Quote – “Those who lose and start to cause trouble with their opponents, do not only lose, but also undermine the respectable system of the game. Sometimes you lose and others you win, but how you react to a certain loss or win is what will define you as an athlete.”
Kayla Giese, Macomb Dakota. In four years on swimming team, was team captain, most valuable, all-county and league all-academic. Helped lead squad to back-to-back conference championships. Also lettered twice in track, earning all-county and league all-academic on teams which won league and county championships. Served as vice president of student government and National Honor Society, and was class secretary. Delegate to Michigan Association of Student Councils & Honor Societies. Active in Key Club and Be The Change at Dakota High School, and has performed numerous hours of community service. Will attend Michigan State University, studying cellular and molecular biology.
Essay Quote – “I have evolved as a sportsman, as well as a leader. I have flourished and succeeded through this development of sportsmanship. It has allowed me to expand my leadership skills as my teammates admire the encouragement and support I provide for them.”
Kristin Nicole Green, Saline. Will letter for four seasons in both cross country in track. Earned all-conference, academic all-conference and league sportsmanship awards. Captain of both cross country and track teams as a senior. Medaled at MHSAA Lower Peninsula Track & Field Finals twice as part of relay teams. Also earned all-conference and academic all-conference honors in track. Organized effort by cross country team to provide Christmas for local family. Youth soccer referee and a certified swimming lifeguard. Part of Link Crew at Saline, which helps freshmen transition into high school. Plans to major in marketing and psychology at the University of Michigan.
Essay Quote – “When there is no sportsmanship in an athletic event, whether it is a recreational soccer match or the football state championships there is a gaping hole for bitterness, frustration, and even hatred to fill.”
Kelly Hall, Saline. A four-time letterwinner in cross country, and also earned three letters in track. Received hardest worker award as a senior. Received league all-academic award each year in cross country and track. Recipient of school’s Coach Mike Smith Scholarship for sportsmanship, leadership and character. Has been an officer with National Honor Society, Saline Youth Council and Interact Club. Has played violin in school symphony orchestra. Selected Homecoming Queen in 2012. Received INTERACT Award three times. Volunteer work ranges from food bank to youth membership. Will attend either the University of Michigan or Yale University to study informatics and epidemiology and eventually pursue an MBA degree.
Essay Quote – “It may sound like a cliché, but I truly believe that the lessons learned every day in practice are as important as those learned in the classroom. One of the most important of these lessons is sportsmanship, and I’m blessed to have a coach who recognizes this. He has instilled in us values and respect and modesty, reminding us often ‘Humble when you win, gracious when you lose.’”
Brooke Kovacic, Oxford. Served as team captain of cross country squad for the past three seasons, as well as the past two seasons in track. Will win four varsity letters in each sport. Medaled at MHSAA Division 1 Lower Peninsula Cross Country Finals all four years, finishing fourth as a junior, sixth as a senior. Team most valuable and all-league four times. Academic all-state honoree. On the track, also earned all-state, all league and all-country awards. Played clarinet in concert band four years. Helps mentor and tutor younger students through Captain’s Club and Link Crew. Member of National Honor Society, and captain of Adventure Club. Plans to study Kinesiology at Michigan State University.
Essay Quote – “These acts and manners that we learn through sports effortlessly carry into our everyday behaviors and transform us into well rounded, caring citizens. Sportsmanship is contagious, and the leadership, discipline, and determination that we learn from competing against others who share these qualities make the experiences all the more beneficial and applicable to life.”
Teresa LaForest, St. Joseph. Performs in cross country in the fall and tennis in the spring, winning seven varsity letters to date. A team captain in cross country, and a Regional Singles champion and all-conference honoree in tennis. Has participated in student government all four years, and served as class treasurer and vice president. Also a member of Key Club, Latin Club and Math Club, and is as an officer in all three groups. Has been a youth tennis instructor and a volunteer with a local soup kitchen and Habitat for Humanity. Engineering will be her course of study at the University of Michigan.
Essay Quote – “The strength of the human spirit will always be tested by challenges, but making choices based on the values of respect, integrity and fairness – the essentials of sportsmanship – brings out the best in all people, athletes and non-athletes alike.”
Reinie Thomas, Portage Central. Will finish high school playing days with 10 varsity letters – four each in basketball and track; and two in volleyball. A team captain in hoops and on the track. Most valuable and most improved in basketball; and also won all-conference honors. Helped organize Pink Out games for American Cancer Society. All-conference performer in the 200-meter dash in track. Elected to leadership positions with National Honor Society and youth councils for Portage and Kalamazoo. Plays the saxophone and piano. Also attends Kalamazoo Area Math & Science Center and competes on computer science team. Active in numerous community volunteer roles. Will continue education at the University of Chicago and study pre-med.
Essay Quote – “Though many times good sportsmanship is overlooked, it is a very valuable piece to every game. The fact that someone is still able to care about someone other than themselves during a contest almost means more than the game itself. After all, it is only a game. I love to win, but what’s a win with a bad attitude and reputation?”
Marcus Barnett, St. Clair Shores Lake Shore. Three-sport athlete, winning four letters in soccer and track and field, and three in basketball. All-state and academic all-state in soccer, and was team captain as a senior. Won all-academic awards three straight years in basketball and track and field. Was team captain in track and field, and a qualifier for the MHSAA Lower Peninsula Finals first three years in school. Involved for four years in Principals & Leadership. Treasurer in National Honor Society. Took part in Chinese Foreign Cultural Exchange Program and Lake Shore Chinese/American Student Summit. Member of Goodfellows of Madison Heights, and active in church activities. Plans to study engineering at Lawrence Technological University or the University of Michigan.
Essay Quote - “My mother always taught me to treat people the way you would like to be treated. This life lesson is the very same principle I use on the soccer field, basketball court, and the track. I know that in other areas of my life, such as college or my career, I will encounter people who will try to advance themselves by putting others down. In these situations I can fall back on the sportsmanship lessons that I have practices through high school athletics.”
Connor James Bos, Holland. Four-year standout in swimming, qualifying for MHSAA Lower Peninsula Finals each year. Finished sixth in 100-yard backstroke as a junior, and also was part of two relay teams that medaled. Also earned all-conference honors, and was part of winning 400-yard relay team. Spent four years on Student Council, and was class president three times. Member of choir and Fellowship of Christian Athletes throughout high school. Worked for three years on Holland Youth Advisory Council and West Michigan Airport Authority Board. Took part in Boy’s State and Boy’s Nation. Member of church praise band. Will study business and political science in college; considering Hope College, the University of Kentucky, Auburn University and Gardner-Webb University.
Essay Quote – “Too often, our eyes are only on the prize of winning and not the process it takes to really be a ‘winning’ team in all aspects. When I interview for a job, is a first place medal going to define who I am, or will it be my character? You be the judge.”
Bryan Condra, Hartland. Eleven varsity letters – four each in swimming and diving, and track and field; and three in soccer – were earned in prep career. A team captain in swimming and soccer. Three-time academic all-state in the pool, and qualified for MHSAA Lower Peninsula Finals first three years in school. Led soccer team in scoring as junior and garnered most valuable and most improved honors that year. Holds school record in 3,200-meter run in track. Four-year involvement in student government, three as class president. Helped create Be The Change program in school, and anti-bullying campaign. Participated in Bible Club and teaches youngsters at a local church. Has served for two years in program that mentors freshmen students. Plans to attend Grand Valley State University and study business management/finance.
Essay Quote – “I led my team to the understanding that there is more to what we do on the field any given day. The way in which we present ourselves reflects directly on our community and how people from other districts view Hartland. I led them to believe that sportsmanship was the single most important aspect of the game.”
Kalvis Hornburg, Traverse City Central. Skiing, soccer and track and field are his sports. Captured all-state honors in skiing as a junior, finishing second in the slalom. Will earn fourth varsity letter this season. Helped ski team to MHSAA titles as a freshman and sophomore. Team most valuable as a junior and team captain this year. Won all-conference honors three times. Was also a team captain in soccer, and won all-academic honors on three occasions. Chapter officer in National Honor Society. Participated for four years in school choir and advanced Science, Math and Technology Program. Played lead role in two school musicals. Active in local church choir. Plans neuroscience/pre-med studies in college.
Essay Quote – “True sportsmanship lies in building mutual respect, in the cooperative aspects of competition, in finding friendship and camaraderie in shared dedication to something you love. Consequently, sportsmanship transcends the athletic boundary, and has a resounding influence on the way we deal with others in school and the workplace.”
Jeremy Simon, Richland Gull Lake. A standout in cross country and track and field; will finish with four letters in each sport. Two-time team captain in both sports. Won academic all-state in all –conference honors in each. Was team most valuable in cross country as a junior. Won all-state honors as part of medaling relay team at MHSAA Lower Peninsula Track & Field Finals as a sophomore. Four-year member of Student Senate and served as class president three years. Participant in National Honor Society, Spanish Honor Society and Volunteens. Also serves on Superintendents Advisory Committee, as a tutor to other students and as a youth Deacon at his church. Plans to pursue studies in finance or pre-medicine at either Hope College or the University of Michigan.
Essay Quote – “After my experience with Scottie, I grew immensely as a sportsman because I realized the kind of impact my leadership and moral discipline could have on people, and I recognized the evident significance of sportsmanship. I learned to stand firmly for what I believe and for what is right.”
Adam Whitener, Saline. Captained Saline’s swimming and diving team, and will win four letter in the sport this winter. MHSAA Lower Peninsula Division 1 champion in the 100 and 200-Yard Freestyle as sophomore and junior, and swam on winning 400 Free Relay teams both years. Part of winning 200 Freestyle Relay quintet as a freshman and junior. All-conference performer on multiple occasions. Member of Boys Scouts throughout high school, attaining rank of Eagle Scout. Participated in band each year, playing the saxophone, and winning top competition ratings three times. Community service includes Special Olympics, food drives and work with local historical society. Plays with church praise band. Will attend the University of Virginia and study computer science.
Essay Quote – “Jake Englemeier, the captain of the high school team my freshman year is the embodiment of what sportsmanship should be in educational athletics. Jake was most admired by the team for his patience and positive approach as a captain. He never resorted to belittling us lower classmen in practice. Instead, he would use humor and wit to motivate and encourage us.”
Other Class A girls finalists for the Scholar-Athlete Award were: Kristy Allen, East Grand Rapids; Casie Ammerman, Ann Arbor Huron; Jacqueline Burke, Troy; Francesca Ciaramitaro, Grosse Pointe North; Morgan Alexandria Gilliam, North Farmington; Sarah Gutknecht, Farmington; Hailey Hrynewich, Muskegon Mona Shores; Jessica Kalbfleisch, Traverse City West; Jillian Klein, Muskegon Mona Shores; Elizabeth Michno, Macomb L'Anse Creuse North; Kelly Raterink, Zeeland East; Roxanne Raven, Okemos; Kerigan Riley, Livonia Churchill; Haley Schaafsma, Riverview; Carley Serowoky, Waterford Kettering; Kendall Tamler, Birmingham Seaholm; and Lindsay Walter, Saline.
Other Class A boys finalists for the Scholar-Athlete Award were: Andrew Camp, Midland Dow; Jarrod Eaton, St. Johns; Tristan Eggenberger, Okemos; Alex Fauer, Macomb Dakota; Thomas Greidanus, Grand Rapids Christian; Reed Hrynewich, Muskegon Mona Shores; Austin Jones, Bay City Central; Tyler Scott Kemerer, Saginaw Heritage; Anthony Lamus, Saline; Jacob J. Presto, Orchard Lake St. Mary's; Charles Robert Proctor, Bay City Western; David Read, Midland Dow; Harrison Schurr, Jenison; Jonathan Sollish, Berkley; Thomas Spicuzza, Oxford; Jason Vander Horst, Milford; Kevin W. Walsh, Detroit Catholic Central; and Pierce Watson, Lowell.
Previously announced were the scholarship award recipients in Classes B, C and D. The Class B Scholar-Athlete Award honorees are: Ashley M. Carney, Jackson Northwest; Amanda Ciancio, Comstock Park; Mary Emington, Cadillac; Nicole L. Green, Portland; Alec Robert Fisher, Battle Creek Harper Creek; Patrick Gifford, Haslett; Scott Parkinson, Grayling; and Keeton Thayer Ross, Grosse Ile. The Class C Scholar-Athlete Award honorees are: Kylei Ratkowski, Bronson; Grace Smith, Kalamazoo Hackett; Nicole Winter, Watervliet; Jesse Anderson, Union City; Ashwin Fujii, Ann Arbor Greenhills; and Connor Lockman, Royal Oak Shrine. The Class D Scholar-Athlete Award scholarship recipients are: Elyse Kathleen Lisznyai, Hillsdale Academy; Elena Victoria Luce, Mason County Eastern; Charles Barchett, Watervliet Grace Christian; Chip A. Blood, Hillsdale Academy; and Francisco Jay Noyola, Lansing Christian
Farm Bureau Insurance, one of Michigan's major insurers, has a statewide force of more than 400 agents serving more than 380,000 Michigan policyholders. Besides providing life, home, auto, farm, business and retirement insurance, the company also sponsors life-saving, real-time Doppler weather tracking systems in several Michigan communities.